. 2021 Nov 1;220(11):e202104100.
doi: 10.1083/jcb.202104100. Epub 2021 Oct 25.

Cnm1 mediates nucleus-mitochondria contact site formation in response to phospholipid levels

Affiliations

Cnm1 mediates nucleus-mitochondria contact site formation in response to phospholipid levels

Michal Eisenberg-Bord et al. J Cell Biol. .

Abstract

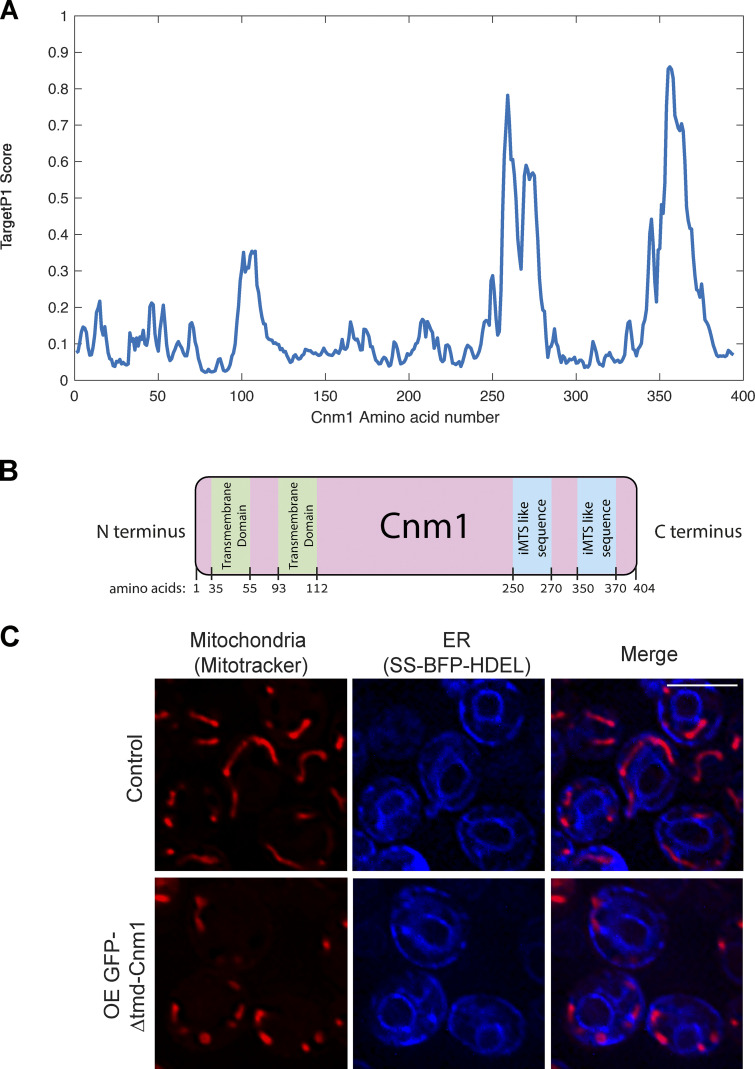
Mitochondrial functions are tightly regulated by nuclear activity, requiring extensive communication between these organelles. One way by which organelles can communicate is through contact sites, areas of close apposition held together by tethering molecules. While many contacts have been characterized in yeast, the contact between the nucleus and mitochondria was not previously identified. Using fluorescence and electron microscopy in S. cerevisiae, we demonstrate specific areas of contact between the two organelles. Using a high-throughput screen, we uncover a role for the uncharacterized protein Ybr063c, which we have named Cnm1 (contact nucleus mitochondria 1), as a molecular tether on the nuclear membrane. We show that Cnm1 mediates contact by interacting with Tom70 on mitochondria. Moreover, Cnm1 abundance is regulated by phosphatidylcholine, enabling the coupling of phospholipid homeostasis with contact extent. The discovery of a molecular mechanism that allows mitochondrial crosstalk with the nucleus sets the ground for better understanding of mitochondrial functions in health and disease.


Figures

Figure 1.
Figure 1.
Mitochondria form contact sites with the nuclear ER that are ERMES independent. (A) EM images of yeast S288c background demonstrate different mitochondrial contact sites with the various subcompartments of the ER (peripheral, tubular, and nuclear). Each image was differentially adjusted for brightness. M, mitochondrion; N, nucleus. Scale bar, 200 nm. (B) Tomograms of yeast (SEY6210.1 background) show the contact sites between the two organelles. M, mitochondrion, N, nucleus, scale bar, 300 nm. Inset: High-density regions that may represent molecular tethers (arrowheads). Scale bar, 50 nm. (C) Schematic illustration of a nucleus–mitochondria contact site reporter. The C-terminal part of a Venus protein (VC) was attached to outer mitochondrial membrane protein, Tom70. The N-terminal part of the Venus protein (VN) was attached to the nuclear ER protein Nsg1. These proteins are homogenously distributed on the OM of their respective organelles, as demonstrated by the images when tagged with GFP on their C terminus. Only in cases where the two organelles are in proximity, as in the case of contact sites, the full Venus protein forms and the fluorescent signal is detected. Scale bar, 5 µm. (D) The nucleus–mitochondria reporter Nsg1-VN/Tom70-VC correctly identifies proximities between the two organelles. Nuclei are visualized by the red fluorophore (tdTomato) fused to a NLS (NLS-TFP). Mitochondria are visualized by a BFP fused to a mitochondrial targeting sequence (MTS-BFP). The fluorescent signal of the reporter is only localized to areas of proximity between mitochondria and the nucleus. Scale bar, 5 µm. (E) Some nucleus–mitochondria contacts are distinct from ERMES-mediated ER–mitochondria contacts. The ERMES subunits Mmm1 and Mdm34 were tagged with mKate and integrated into the nucleus–mitochondria reporter strain. Cells were imaged in stationary phase. Yellow arrows mark areas of colocalization between the ERMES-mKate signal and the reporter, while white arrows mark areas where only the reporter signal is detected (ERMES-independent contacts). Scale bar, 5 µm.
Figure S1.
Figure S1.
Overexpression of the ERMES complex does not extend nucleus–mitochondria contacts. (A) Quantitation of the distances (nanometers) between the nuclear and mitochondrial membranes in a SEY6210.1 strain as determined by three different tomograms. The boxes represent the interquartile range of distance measurements per tomogram (tomogram 1: n = 27,743; tomogram 2: n = 40,401; tomogram 3: n = 9,509); bars mark 0.95 and 0.05 percentiles. The line at the center of the box represents the median. The dotted line represents the mean distance of all three samples. (B) 3D segmentation of the nucleus–mitochondria contact in yeast based on the tomogram in Fig. 1 B. M, mitochondrion; N, nucleus; PM, plasma membrane. (C) The nucleus–mitochondria reporter Nsg1-VC/Tom70-VN correctly identifies proximities between the two organelles. Nuclei are visualized by the red fluorophore (tdTomato) fused to a nuclear localization signal (NLS-TFP) . Mitochondria are visualized by a BFP fused to a mitochondrial targeting sequence (MTS-BFP). The fluorescent signal of the reporter is only localized to areas of proximity between mitochondria and the nucleus. Scale bar, 5 µm. (D) Quantitation of either the nucleus–mitochondria reporter (Nsg1-VN/Tom70-VC) or the ER–mitochondria reporter (Tom70-VN/Pho88-VC) sizes in control strains or those overexpressing Mdm34 (OE Mdm34) N terminally tagged with mCherry. The reporter sizes were determined by the number of pixels of the reporter signal using ScanR Olympus soft imaging solutions version 3.2. While Mdm34 overexpression affects the ER–mitochondria reporter, it does not alter the nucleus–mitochondria one. (E) An example of the effect of overexpressing Mdm34 N terminally tagged with mCherry on the background of the two reporters in D. Scale bar, 5 µm. (F) Statistical analysis of colocalization between the nucleus–mitochondria contact reporter and the ERMES subunit Mmm1 tagged with mKate on its C terminus. Cells were imaged in stationary phase, and colocalization events were counted manually using a cell counter plugin in ImageJ (Schindelin et al., 2012). Full colocalization was denoted in cases where both punctate signals were completely overlapping (see top image), partial colocalization was designated if the Mmm1 signal only colocalized with a small fraction of the reporter signal (see middle image), whereas no colocalization was scored when the reporter did not overlap any Mmm1 signal whatsoever (see bottom image). Scale bar, 5 µm; n = 400.
Figure 2.
Figure 2.
High-content screens reveal residents and effectors of the nucleus–mitochondria contact. (A) Illustration of the high-content screen directed at finding resident proteins of the nucleus–mitochondria contact site. The reporter (NSG1-VN/TOM70-VC) was integrated into a library of ∼6,000 yeast strains, each harboring an overexpressed and mCherry-tagged version of a different yeast protein. Strains were imaged using automated microscopy, and images were manually examined to identify proteins that colocalize, either fully or partially, with the reporter. (B) List of all proteins that either fully (left) or partially (right) colocalized with the reporter, organized by alphabetical order. The proteins shown in the representative images are marked in bold. Scale bars, 5 µm. For a complete list of all proteins and their descriptions, see Table S1. (C) Illustration of a screen aimed at identifying effectors of the nucleus–mitochondria contact site. The reporter (NSG1-VC/TOM70-VN) was integrated into all 57 hits from the primary screen (shown in B). The effect of their overexpression on the reporter was inspected and 12 hits were found. A representative image shows the protein marked in bold out of the full list of hits. Scale bar, 5 µm.
Figure S2.
Figure S2.
Ybr063c (Cnm1) does not affect the extent of ERMES-mediated contacts. (A) ERMES components Mmm1 or Mdm34 were C terminally tagged with GFP on the background of a control strain or strains overexpressing YBR063C (TEF2pr-YBR063C) or deleted for it (Δybr063c). Overexpression of Ybr063c resulted in clustering of ERMES signal to the nuclear ER area but did not change the number or intensity of ERMES puncta. Deleting ybr063c had no effect on these proteins. Scale bar, 5 µm. (B) Ybr063c can be found in distinct areas from ERMES subunits. Overexpressed Ybr063c was N terminally tagged with mCherry on the background of Mdm34 or Mmm1 C terminally tagged with GFP. The yellow arrows represent areas of proximity between the Ybr063c signal and the ERMES proteins, while the white arrows represent areas of Ybr063c signal that does not colocalize with ERMES. Scale bar, 5 µm. (C) A spot dilution assay of strains expressing ybc063c under a GAL promoter in control strains and strains that harbor deletions in mdm34 or vam6. Repressed expression of ybr063c when controlled under the GALpr and grown in glucose caused a complete rescue of the growth defect of Δvam6 in glucose. In contrast, repressing ybr063c on the background of Δmdm34 aggravated the severe growth phenotype of this strain. All strains were grown on both synthetic media with glucose (no expression of Ybr063c) or galactose (Ybr063c is expressed) as a control. (D) 100 representative samples of either the nucleus (on the left) or mitochondria (on the right) that were considered in the quantification analysis of Fig. 3 D. The nuclei were marked by Nsg1-GFP, while the mitochondria were dyed using MitoTracker Orange. (E) Representation of the overlap analysis between the nucleus and mitochondria by artificial intelligence algorithms (ScanR Olympus soft imaging solutions, version 3.2). Mitochondria segmented in the RFP channel (561 nm) are recognized and marked in red, the nucleus segmented in the GFP channel (488 nm) is recognized and marked in blue, and the overlap between them is recognized and marked with cyan. Scale bar, 5 µm.
Figure 3.
Figure 3.
Ybr063c (Cnm1) has the characteristics of a molecular tether. (A) Overexpressed mCherry-Ybr063c is localized only to areas of proximity between the nuclear envelope and mitochondria. The nuclear envelope was visualized with Nsg1-GFP and mitochondria by the blue mitochondrial dye (MitoView 405). Insets show an enlarged region of a single nucleus and mitochondria interface with mCherry-Ybr063c signal present where the two organelles connect. Scale bar, 5 µm. (B) Ybr063c is a membrane protein embedded in the lipid bilayer. Enriched mitochondrial fractions from cells overexpressing Ybr063c tagged with 3HA on its N terminus were either treated by CE or left untreated (UT). Following this, they were separated into membrane proteins in the pellet (P) or soluble proteins in the supernatant (S). (C) Overexpression (OE) of Ybr063c drives clustering of mitochondria around the nucleus. The nuclear membrane was visualized by Nsg1-GFP and mitochondria were stained using a red dye (MitoTracker Orange). Scale bar, 5 µm. (D) Quantitation of the proximity between mitochondria and nucleus from C is shown as the percentage of mitochondrial signal that overlaps with the nuclear envelope signal in both a strain that overexpresses Ybr063c (OE Ybr063c) and a control strain. Bars represent standard deviation. n = 500; ***, P = 7.24e−73. (E) EM images of the extended contact sites between nucleus and the mitochondria that are formed by overexpressing Ybr063c (OE Ybr063c, highlighted by a green outline). Scale bars, 200 nm. (F) Tomograms of nucleus–mitochondria contacts in yeast overexpressing Ybr063c (OE Ybr063c, left). Scale bars, 300 nm. Insets show high densities that may indicate molecular tethers (arrowheads). Scale bars, 50 nm. 3D segmentations of the contact site area seen in the tomograms (right). The nucleus membrane is marked in yellow, and the mitochondrial membrane is marked in green. Dashed lines on tomograms indicate the area that is seen in the 3D segmentation. M, mitochondrion; N, nucleus.
Figure 4.
Figure 4.
Identifying factors that are involved in Cnm1-induced contact sites. (A) A schematic representation of the systematic screen to find modulators of Cnm1 overexpression. Cnm1, overexpressed under the strong TEF2 promoter, and the nuclear envelope protein Nsg1, tagged with GFP on its C terminus, were integrated into the deletion/hypomorphic allele library. In this library, each colony harbors a loss-of-function mutant in each of the ∼6,000 yeast genes. Prior to imaging, cells were stained with a red mitochondrial dye (MitoTracker Orange). The genes that when mutated resulted in partial or reduced mitochondrial clustering around the nucleus were considered as hits. Representative images of the mutants labeled in white are shown. Scale bar, 5 µm. (B) A table of all deleted genes that caused reduced mitochondrial clustering on the background of Cnm1 overexpression arranged by alphabetical order. GPI, glycosylphosphatidylinositol. Protein localization and description are presented in the middle and right columns, respectively. For a full list of the mutant genes that resulted in partial clustering, see Table S2.
Figure S3.
Figure S3.
Cnm1-mediated clustering of mitochondria around the nucleus is ERMES independent. A strain overexpressing Cnm1 (OE Cnm1) and deleted for the ERMES subunit mdm34 shows no difference in mitochondrial clustering around the nucleus. The nucleus was visualized with Nsg1-GFP and mitochondria with MitoTracker Orange. Scale bar, 5 µm.
Figure 5.
Figure 5.
Cnm1-mediated contact sites are affected by PC metabolism. (A) Schematic illustration of the biosynthesis pathway of PC. PS formed in the ER is transferred to mitochondria to generate PE, which is then transferred back to the ER for the formation of PC by Cho2 and Opi3. Ino2 and Ino4 are the transcriptional activators of both Cho2 and Opi3. Opi1 is a negative regulator of the pathway. PC molecules can also be synthesized through the Kennedy pathway when exogenous choline is present. IM, inner membrane. (B) Deletion of PC biosynthesis–related genes reduced Cnm1 signal levels. Overexpressed (OE) Cnm1 was tagged with GFP on its C terminus and mitochondria were stained using MitoTracker Orange. Scale bar, 5 µm. (C) Reduced levels of Cnm1-GFP (expressed from a strong constitutive promoter) in strains harboring a deletion of cho2, opi3, or ino2 can be rescued by addition of choline. Western blot analysis of four different strains without or with 5mM choline supplementation. Immunoblotting was performed with antibodies against GFP and Histone H3 as a loading control. (D) Cnm1 mediated mitochondrial clustering around the nucleus is dependent on choline levels. Cells overexpressing Cnm1 under the TEF2 promoter and harboring deletion of cho2, opi3, or ino2 were grown to mid-logarithmic phase in synthetic minimal medium without or with 5mM choline. The nucleus is visualized by Nsg1-GFP and mitochondria by MitoTracker Orange staining. Scale bar, 5 µm. (E) Overexpression of Cnm1 using the TEF2 promoter in strains deleted for proteins involved in PC biosynthesis resulted in a reduced growth rate. Strains were grown overnight in synthetic minimal medium, back diluted to OD600∼0.05 and monitored for growth over 48 h. (F) Choline buffered the growth defect of overexpressing Cnm1 in strains deleted for genes involved in PC biosynthesis. Strains were grown overnight in synthetic minimal medium, back diluted to OD600∼0.05 and monitored for growth over 48 h with or without 5mM choline supplementation.
Figure S4.
Figure S4.
Choline supplementation rescues reduced Cnm1-GFP levels in strains lacking genes related to PC biosynthesis. (A) Cells overexpressing Cnm1-GFP (OE Cnm1-GFP) on the background of deletions in cho2, opi3, and ino2 were grown to mid-logarithmic phase in synthetic minimal medium and imaged with or without 5 mM choline. Mitochondria were dyed using MitoTracker Orange. Scale bar, 5 µm. (B) Cells lacking ino4 and overexpressing (OE) Cnm1-GFP were grown to mid-logarithmic phase in synthetic minimal medium and imaged with or without 5 mM choline supplementation. Mitochondria were stained using MitoTracker Orange. Scale bar, 5 µm. (C) Quantitation of the overexpressed (by TEF2pr) Cnm1-GFP signal brightness in either control or Δopi1 strains, determined by the mean intensity level of the 488-nm excitation wavelength using ScanR Olympus soft imaging solutions, version 3.2. While the mean intensity was maintained in most control cells, deletion of opi1 resulted in a higher probability of having cells with stronger Cnm1-GFP signal. a.u., arbitrary units. (D) An example of the strains quantified in C. Overexpression of Cnm1 tagged with GFP (OE Cnm1-GFP) on its C terminus on the background of opi1 deletion showed enhanced GFP signal intensity in some of the cells compared with control. Mitochondria were dyed using MitoTracker Orange. Scale bar, 5 µm. (E) Cells overexpressing (OE) Cnm1 and C terminally tagged with mCherry on the background of Δcho2 strain were grown to mid-logarithmic phase in synthetic minimal medium and imaged with or without supplementation of 1 mM PC. Scale bar, 5 µm.
Figure S5.
Figure S5.
Domain architecture of Cnm1 and the effect of losing its TMD on mitochondrial morphology. (A) Prediction of an internal mitochondrial targeting signal–like (iMTS-L) sequence in Cnm1 calculated as described before (Boos et al., 2019). A peak with the highest TargetP1 scores can be found around amino acids 350–370 of the nuclear protein Cnm1, suggesting the presence of an iMTS-L sequence in this region. Since iMTS-Ls have been shown to directly bind Tom70, this highlights this region as a potential binding interface of Cnm1 with Tom70 on the mitochondrial membrane. (B) An illustrated model of Cnm1 protein containing the localization of its two predicted transmembrane domains and the predicted iMTS-like signals. (C) Overexpression of the soluble Cnm1 (Δ1–112 aa) tagged with GFP on its N terminus (OE GFP-Δtmd-Cnm1) has a dramatic effect on mitochondrial morphology. The ER is marked by a BFP with a signal sequence and an ER retention signal (SS-BFP-HDEL). Mitochondria were dyed with MitoTracker Orange. Scale bar, 5 µm.
Figure 6.
Figure 6.
Cnm1-mediated contact sites require Tom70. (A) Cnm1 is an outer nuclear membrane protein. A strain overexpressing Cnm1-GFP (OE Cnm1-GFP) during stationary phase shows areas where Cnm1 is not localized to mitochondria (stained by MitoTracker Orange) but does colocalize with the outer nuclear membrane (nuclear ER) visualized using a BFP with a signal sequence and an ER retention signal (SS-BFP-HDEL). Arrows mark areas where Cnm1-GFP signals colocalize with the nuclear ER signal, but not with the mitochondrial signal. Scale bar, 1 µm. (B) Loss of tom70 results in Cnm1 redistributing uniformly around the nucleus. Shown are strains overexpressing (OE) Cnm1-GFP on the background of Δtom70 or control cells, imaged in mid-logarithmic phase using MitoTracker Orange for mitochondrial staining. Scale bar, 5 µm. (C) Tom70 physically interacts with Cnm1. Pull-down of overexpressed Cnm1 tagged with GFP on its C terminus in strains expressing either Tom70 or Tom20 tagged with mCherry on their C termini. Coimmunoprecipitation (co-IP) samples were analyzed by Western blotting and probed with antibodies against GFP and mCherry. Input (10% of total immunoprecipitates) is shown. The number above each immunoprecipitation band represents the enrichment of the protein. (D) Overexpression (OE) of Cnm1 results in the accumulation of soluble GFP-Tom70 around the nuclear membrane. Overexpressed Tom70 whose TMD (1–38 aa) has been truncated and is tagged with GFP on its N terminus (OE GFP-Δtmd-Tom70) shows cytosolic distribution in control cells. Overexpression of Cnm1 concentrates the soluble Tom70 around the nuclear membrane marked by a BFP with a signal sequence and an ER retention signal (SS-BFP-HDEL). Mitochondria were dyed with MitoTracker Orange. Control and overexpressed Cnm1 strains are adjusted to different intensities. Scale bar, 5 µm. (E) Overexpressed (OE) GFP-Δtmd-Tom70 is fully colocalized with overexpressed Cnm1-mCherry on the nuclear periphery. Scale bar, 5 µm. (F) Deletion of the predicted iMTS-L sequence of Cnm1 (350–404 aa) abrogates mitochondrial clustering around the nucleus and results in redistribution of Cnm1 over the entire nuclear membrane. Cnm1-GFP (full length or mutant) were expressed under a TEF2 promoter. Mitochondria are dyed with MitoTracker Orange. Scale bar, 5 µm. (G) Soluble Cnm1 decorates the mitochondrial OM. Overexpressed Cnm1 truncated at its N terminus by fusion of a GFP molecule to remove its predicted TMD (1–112 aa; OE GFP-Δtmd-Cnm1) was expressed in either WT Tom70 cells or cells overexpressing Tom70 (OE Tom70) under the NOP1 promoter. The nuclear envelope is visualized by a BFP with a signal sequence and an ER retention signal (SS-BFP-HDEL; SS-BFP-HDEL in WT Tom70 and OE Tom70 strains is adjusted to different intensities). Mitochondria are marked by MitoTracker Orange. In control cells, GFP-Δtmd-Cnm1 shows cytosolic distribution as well as enrichment around the mitochondrial periphery and no nuclear periphery staining. Overexpression of Tom70 causes an even brighter signal to accumulate around mitochondria, suggesting that its levels are restrictive to Cnm1 recruitment to mitochondrial surfaces. Scale bar, 5 µm. (H) Schematic working model on Cnm1 activity in mediating nucleus–mitochondria contacts. PC levels regulate Cnm1 abundance in the cell. Cnm1 on the nuclear ER membrane interacts with Tom70 on the mitochondrial membrane.

Comment in

References

    1. Aikawa, M., Huff C.G., and Strome C.P.A.. 1970. Morphological study of microgametogenesis of Leucocytozoon simondi. J. Ultrastruct. Res. 32:43–68. 10.1016/S0022-5320(70)80037-5 - DOI - PubMed
    1. Atkinson, K., Fogel S., and Henry S.A.. 1980. Yeast mutant defective in phosphatidylserine synthesis. J. Biol. Chem. 255:6653–6661. 10.1016/S0021-9258(18)43619-8 - DOI - PubMed
    1. Backes, S., Hess S., Boos F., Woellhaf M.W., Gödel S., Jung M., Mühlhaus T., and Herrmann J.M.. 2018. Tom70 enhances mitochondrial preprotein import efficiency by binding to internal targeting sequences. J. Cell Biol. 217:1369–1382. 10.1083/jcb.201708044 - DOI - PMC - PubMed
    1. Baker, T.G., and Franchi L.L.. 1969. The origin of cytoplasmic inclusions from the nuclear envelope of mammalian oocytes. Z. Zellforsch. Mikrosk. Anat. 93:45–55. 10.1007/BF00325022 - DOI - PubMed
    1. Bernhard, W., and Rouiller C.. 1956. Close topographical relationship between mitochondria and ergastoplasm of liver cells in a definite phase of cellular activity. J. Biophys. Biochem. Cytol. 2(4, Suppl):73–78. 10.1083/jcb.2.4.73 - DOI - PMC - PubMed

Publication types

MeSH terms

Substances