. 2021 Dec 6;153(12):e202112871.
doi: 10.1085/jgp.202112871. Epub 2021 Oct 25.

Piezo1-Pannexin1 complex couples force detection to ATP secretion in cholangiocytes

Affiliations

Piezo1-Pannexin1 complex couples force detection to ATP secretion in cholangiocytes

Angélique Desplat et al. J Gen Physiol. .

Abstract

Cholangiocytes actively contribute to the final composition of secreted bile. These cells are exposed to abnormal mechanical stimuli during obstructive cholestasis, which has a deep impact on their function. However, the effects of mechanical insults on cholangiocyte function are not understood. Combining gene silencing and pharmacological assays with live calcium imaging, we probed molecular candidates essential for coupling mechanical force to ATP secretion in mouse cholangiocytes. We show that Piezo1 and Pannexin1 are necessary for eliciting the downstream effects of mechanical stress. By mediating a rise in intracellular Ca2+, Piezo1 acts as a mechanosensor responsible for translating cell swelling into activation of Panx1, which triggers ATP release and subsequent signal amplification through P2X4R. Co-immunoprecipitation and pull-down assays indicated physical interaction between Piezo1 and Panx1, which leads to stable plasma membrane complexes. Piezo1-Panx1-P2X4R ATP release pathway could be reconstituted in HEK Piezo1 KO cells. Thus, our data suggest that Piezo1 and Panx1 can form a functional signaling complex that controls force-induced ATP secretion in cholangiocytes. These findings may foster the development of novel therapeutic strategies for biliary diseases.


Figures

Figure S1.
Figure S1.
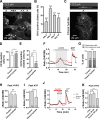
Mouse cholangiocytes in primary culture are not sensitive to hypertonic stress. (A) Cultured cells from mouse IBDUs were colabeled at DIV5 with an antibody against the cholangiocyte marker CK19 (red) and an antibody against the hepatocyte marker albumin (green). The cell nucleus is stained with DAPI (blue) to allow cell counting. Note that all cells reactive to the CK19 antibody (asterisks) are negative for albumin. The arrow indicates a cell negative to both CK19 and albumin, possibly a fibroblast. Inset: a rare albumin-positive cell seen in mouse IBDU cultures at DIV5. Scale bars, 20 μm. (B) Percentage of CK19-positive cells in mouse IBDU cultures. Data normalized to the number of DAPI-positive cells (indicated on each bar). (C) IBDU cultures at DIV5 express the typical cholangiocyte markers CK19, CK7, ASBT, CFTR, and AE2a at the mRNA level. Black dots indicate 500-bp DNA marker. Each band is separated by 100 bp. (D) Effects of a hypertonic solution (460 mOsmol ⋅ liter−1) on DIV5 cholangiocytes. Data points are mean ± SEM (n = 26). ATP (150 µM) was applied at the end of the experiment to probe cell viability. (E) Ratiometric values determined before (Krebs) and after (HYPER) exposure to the hypertonic solution. Note that ATP (150 µM) caused normal Ca2+ mobilization in cells insensitive to the hypertonic solution. ns, not significant (P = 0.5029), paired t test.
Figure 1.
Figure 1.
Hypotonic stress-induced Ca2+ signals in mouse cholangiocytes depend on a plasmalemmal calcium-permeable pathway. (A) Left: Composition of the Krebs, isotonic (ISO), and hypotonic (HYPO) solutions. Hypotonic stress is induced by varying the concentration of mannitol, keeping constant the concentration of external ions. Right: Recording of Ca2+ signals and determination of the response parameters. Responses to individual stimuli were considered positive (i.e., responsive cells) if deflections exceeded twice the SD (dashed blue line) of the baseline (blue line). AUC (area under the curve) for the time of stimulus application. (B and C) Changes in fluorescent signals of the ratiometric calcium indicator Fura-2AM in DIV5 cholangiocytes exposed to hypotonic solution. Representative examples of responsive and nonresponsive cholangiocytes to hypotonic solution are illustrated in B and C, respectively. ATP (150 µM) was applied at the end of the ratio-imaging experiment to monitor cell viability. (D) Hypotonic Ca2+ signals in cholangiocytes bathed with a Ca2+-free external solution. (E) Proportion of cholangiocytes showing hypotonic Ca2+ responses in the presence or absence of extracellular Ca2+. The number of cells analyzed in each condition is indicated. ****, P < 0.0001, Fisher test. (F and G) Peak Δratio (340/380 nm; F) and AUC (G) of hypotonic Ca2+ responses recorded with and without external Ca2+. ***, P = 0.0006; ****, P < 0.0001, unpaired t test. (H and I) Peak Δratio (340/380 nm; H) and AUC (I) of ATP (150 µM)–induced Ca2+ responses with and without external Ca2+. ****, P < 0.0001, unpaired t test.
Figure S2.
Figure S2.
The primary cilium is not involved in osmosensation. (A) CK19-positive DIV5 cholangiocytes stained with acetylated-tubulin in cultures. Primary cilia are indicated by arrows. The confocal image z-stacks spanned 0.33 µm. Upper: 3-D reconstruction pointing out primary cilia (arrowheads). (B) Percentage of ciliated CK19-positive cholangiocytes in mouse IBDU cultures at different times in vitro. The total number of analyzed CK19-positive cells is indicated on each bar. (C) Cholangiocytes stained with acetylated-tubulin in cultures treated with chloral hydrate (4 mM, 24 h). (D) Percentage of CK19-expressing cells in DIV5 IBDU cultures treated or not with chloral hydrate. *, P = 0.044, Fisher test. (E) Chloral hydrate treatment reduces the percentage of ciliated cells among the CK19-expressing cells. ****, P < 0.0001, Fisher test. (F) Hypotonic shock-induced Ca2+ responses in cholangiocytes pretreated with chloral hydrate (4 mM; red trace) or with the vehicle (black trace). (G) Percentage of responsive cholangiocytes in control and chloral hydrate conditions. ns, not significant (P = 0.5378, Fisher test). (H) Peak amplitude of hypotonic Ca2+ responses in control and chloral hydrate conditions. ns, not significant (P = 0.4445, t test). (I) Peak Δratio of ATP (150 µM) responses in cholangiocytes from control and chloral hydrate–treated IBDU cultures. ****, P < 0.0001 (unpaired t test). (J) Hypotonic shock–induced Ca2+ responses in cholangiocytes pretreated with suramin (20 µM; red trace) or with the vehicle (black trace). (K) Peak amplitude of hypotonic Ca2+ responses in control (CTRL) and suramin conditions (20 and 200 µM). ***, P < 0.001 (unpaired t test); ns, not significant (P = 0.34; unpaired t test). HYPO, hypotonic.
Figure 2.
Figure 2.
Hypotonic stress induces ATP secretion and subsequent stimulation of P2X4Rs. (A) Representative changes of ratiometric Ca2+ signals in response to hypotonic stress in two DIV5 cholangiocytes treated (red trace) or not (black trace) with apyrase (5 U/ml). (B) Percentage of cholangiocytes exhibiting hypotonic Ca2+ responses in the presence or absence of apyrase. ****, P < 0.0001 (Fisher test). (C and D) Amplitude (C) and AUC (D) of hypotonic Ca2+ responses with and without apyrase. ****, P < 0.0001 (unpaired t test). (E) Paired-pulse ATP stimulation with (red trace) and without (black trace) apyrase. Responses were evoked by two sequential applications of ATP (150 µM) elapsed by 20-min interval. (F) Paired pulse depression (P2/P1) of ATP responses examined in the presence or absence of apyrase. ****, P < 0.0001, paired t test. (G) Cholangiocytes at DIV5 express a variety of P2XR subtypes, including P2X1, P2X2, P2X4, P2X5, and P2X7 receptors at the mRNA level. Black dots indicate 500-bp DNA marker. (H) Hypotonic Ca2+ responses of DIV5 cholangiocytes treated with A-804598 (0.1 µM, red trace) and A-740003 (0.5 µM, blue trace) or its vehicle (0.1% DMSO, black trace). (I) Percentage of cholangiocytes showing hypotonic Ca2+ responses in the presence of A-804598 (0.1 µM), A-740003 (0.5 µM), or the vehicle (control). ns, not significant (Fisher test). (J and K) Peak Δratio (J) and AUC (K) of hypotonic Ca2+ responses recorded with prior incubation with A-804598 (0.1 µM) or A-740003 (0.5 µM). **, P = 0.0027, unpaired t test. (L) Peak Δratio of ATP responses recorded with prior incubation with A-804598 (0.1 µM) or A-740003 (0.5 µM). ****, P < 0.0001, unpaired t test. (M) Hypotonic Ca2+ responses of DIV5 cholangiocytes treated with 5-BDBD (10 µM, red trace) or its vehicle (0.1% DMSO, black trace). Note the reduced amplitude of both hypotonic and purinergic Ca2+ responses. (N) Percentage of cholangiocytes showing hypotonic Ca2+ responses in the presence of 5-BDBD (10 µM) or its vehicle. ns, not significant (P = 0.5389). (O and P) Peak Δratio (O) and AUC (P) of hypotonic Ca2+ responses recorded with 5-BDBD (10 µM) or its vehicle. ****, P < 0.0001 (unpaired t test). (Q) Peak Δratio of ATP responses recorded with prior incubation of 5-BDBD (10 µM). ****, P < 0.0001 (unpaired t test). HYPO, hypotonic; ISO, isotonic.
Figure 3.
Figure 3.
Piezo1 is expressed and functional in mouse cholangiocytes. (A) Hypotonic Ca2+ responses of DIV5 cholangiocytes treated (red trace) or not (black trace) with Gd3+ (50 µM). Note that Gd3+ reduces the amplitude of the hypotonic Ca2+ response and converts the response into spike-like signal. (B) Percentage of cholangiocytes showing hypotonic Ca2+ responses in the presence of Gd3+ (50 µM). ****, P < 0.0001 (Fisher test). (C and D) Peak Δratio (C) and AUC (D) of hypotonic Ca2+ responses recorded in the presence of Gd3+ (50 µM). **, P = 0.0042 (C) and P = 0.0018 (D; unpaired t test). (E) Immunostaining for Piezo1 in HEK293T-P1KO cells transfected with GFP-mpiezo1 cDNA (top panels) and in DIV5 mouse cholangiocytes (bottom). (F) RT-PCR for mpiezo1 in DIV5 cholangiocytes. Black dot indicates 500-bp DNA marker. (G) Ca2+ signals of DIV5 cholangiocytes in response to increasing concentrations (10, 50, and 100 µM) of Yoda1. (H) Concentration-response profile for Yoda1 in mouse DIV5 cholangiocytes, yielding apparent EC50 of 29.37 ± 1.25 µM (n = 99–278). (I) Effect of Yoda1 (50 µM) in the absence of external calcium. Data averaged over 84 individual cholangiocytes. (J) Ca2+ signals in response to Yoda1 (50 and 100 µM) in HEK293T-P1KO cells transfected with mPiezo1iresGFP or pGFP cDNAs (100 µM Yoda1). Traces are mean ± SEM of 60 individual responses per condition. (K) Peak Δratio of Yoda1 responses in HEK293T-P1KO cells transfected with mPiezo1iresGFP or pGFP cDNAs. HYPO, hypotonic; ISO, isotonic.
Figure S3.
Figure S3.
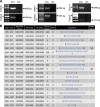
Expression of putative mechanosensitive channels in cholangiocytes. (A) RT-PCR products from DIV5 cholangiocyte RNA extracts, demonstrating the presence of TRPV2, TRPV4, TRPP1, TRPP2, Piezo1, and Piezo2. Size markers are shown in the left lanes. Black dots indicate the 500-bp DNA marker. (B) Identification of Piezo1 by mass spectrometry in cholangiocytes. Piezo1 protein was identified with a sequence coverage of 10%. The identified peptides from mpiezo1 (https://db.systemsbiology.net/sbeams/cgi/PeptideAtlas; E2JF22) are shown in blue, and their position on Piezo1 sequence indicated in column one. Experimental peptide ions m/z (mass to charge ratios), experimental and theoretical peptide masses, experimental error (in ppm), trypsin misscleavages, peptide sequence, and modifications are also indicated. (C), Carbamidomethyl; (M), oxidation.
Figure 4.
Figure 4.
Piezo1 contributes to hypotonic stress-induced Ca2+ signals in cholangiocytes. (A) Quantitative real-time PCR analysis of the efficiency of piezo1-siRNA. Relative levels of piezo1 mRNA in cholangiocytes normalized to the housekeeping genes β-actin, GAPDH, and CK19. Data are presented as mean ± SEM based on cholangiocytes transfected with piezo1 or siCtr. (B) Yoda1-induced Ca2+ responses recorded in DIV5 cholangiocytes 96 h after transfection with siCtr (black trace) or siPiezo1 (red trace). (C and D) Percentage of cholangiocytes showing Yoda1-induced Ca2+ responses (C) and corresponding peak amplitude (D) after transfection with siCTR or siPiezo1. ****, P < 0.0001, Fisher test (C) and unpaired t test (D). (E) Hypotonic Ca2+ responses recorded in DIV5 cholangiocytes 96 h after transfection with siCtr (black trace) or siPiezo1 (red trace). (F) Percentage of cholangiocytes showing hypotonic Ca2+ responses 96 h after transfection with siCtr or siPiezo1. **, P = 0.0031, Fisher test. (G and H) Peak Δratio (G) and AUC (H) of hypotonic Ca2+ responses recorded after 96 h transfection with siCtr or siPiezo1. ****, P < 0.0001, unpaired t test. (I) Hypotonic Ca2+ responses in HEK293T-P1KO cells transfected with GFP cDNA (black trace) or mPiezo1iresGFP cDNA (red trace). Data shown are mean ± SEM for 52 and 36 cells, respectively. (J and K) Peak Δratio of hypotonic responses (J) and ATP (150 µM) responses (K) in HEK293T-P1KO cells transfected with GFP or mPiezo1iresGFP cDNAs. ****, P < 0.0001; ns, P = 0.4124, unpaired t test. HYPO, hypotonic.
Figure 5.
Figure 5.
Piezo1 contributes to hypotonic shock-induced ATP secretion. (A) ATP release induced by hypotonic shock in DIV5 cholangiocytes in the presence of Gd3+ (100 µM) or GsMTx4 (5 µM). Data represent means ± SEM for five or six separate experiments. *, P = 0.0176; **, P = 0.0012; ****, P < 0.0001; two-way ANOVA followed by Dunnett’s multiple comparison test. (B) ATP release induced by hypotonic shock in DIV5 cholangiocytes after 96 h transfection with siCtr or siPiezo1. Data from nine independent experiments normalized to nonstimulated sister cultures. ****, P < 0.0001, one-way ANOVA, Dunnett's multiple comparison test; **, P = 0.01, unpaired t test. (C) Yoda1 (50 µM)–induced Ca2+ response averaged (± SEM) over 110 individual DIV5 cholangiocytes. Note the biphasic shape of the Ca2+ response with an initial Ca2+ rise (arrowhead) followed by a delayed component (arrow). (D) Representative Yoda1 (50 µM)–induced Ca2+ responses in the absence (black trace) or presence of apyrase (5 U/ml; red trace). (E and F) Proportion of cholangiocytes showing Yoda1-induced Ca2+ responses in the presence or absence of apyrase (E) and corresponding amplitude of the initial component (F). **, P = 0.028, Fisher test; ****, P < 0.0001, unpaired t test. (G) Representative Yoda1 (50 µM)–induced Ca2+ responses in the presence of apyrase (5 U/ml) applied for different durations (10 min, black trace; 13 min, red trace) after Yoda1 washout. Note the occurrence of a rebound Ca2+ component at the apyrase offset. (H) Amplitude of Ca2+ rebound occurring at the offset of 10 and 13 min apyrase exposure. Experiments as in G (n = 3). (I and J) Amplitude of ATP responses as a function of prior exposure to Yoda1 at increasing concentrations. ATP (150 µM) was applied 10 min after the offset of Yoda1 application (I). Each data point in J shows mean ± SEM from 54–278 cells. HYPO, hypotonic.
Figure S4.
Figure S4.
Yoda1 does not induce ATP secretion by itself. (A) Apyrase did not reduce Yoda1 (50 µM)–induced Ca2+ responses in piezo1-GFP–transfected HEKP1KO cells. Data averaged from 115 cells in the two conditions. (B) Peak amplitude of Yoda1-induced Ca2+ responses in piezo1-GFP–transfected HEKP1KO cells with and without apyrase. (C) P2X4R is detected by RT-PCR in native, untransfected HEKP1KO cells. Black dot indicates the 500-bp DNA marker. Data from triplicates. (D) Lack of effect of Yoda1 (100 µM) on ATP secretion in HEK293T and HEK293T-P1KO cells. Data are mean ± SEM from triplicates. Normalized [ATP]=(ODkrebsODblank)ODkrebsODblank. (E) Lack of effect of Yoda1 on ATP secretion in HEK293T-P1KO cells overexpressing Piezo1-GFP. Data from triplicates.
Figure S5.
Figure S5.
Panx1 colocalizes with Piezo1 in cholangiocyte plasma membrane. (A) RT-PCR for Panx1 in DIV5 cholangiocytes and NMCs. Black dots indicate the 500-bp DNA marker. (B) Anti-flag and anti-Panx1 immunostainings in DIV5 cholangiocytes (bottom) and in HEK293T-P1KO cells transfected with flag-panx1 cDNA (top). (C) Western blot analysis of Panx1 expression in whole cell lysates from HEK293T-P1KO cells expressing Panx1-flag (left), cholangiocytes (middle), and NMCs (right; see also Fig. 7). (D) Immunofluorescent staining of Piezo1-GFP and Pannexin1-flag overexpressed in HEK293T-P1KO cells. Cells were labeled using an Alexa 647–coupled anti-flag (shown in green) and a TRITC (tetramethylrhodamine)-coupled anti-GFP (shown in red). (E) The line scan illustrates overlap of Piezo1-GFP and Panx1-flag labels at the cell periphery.
Figure 6.
Figure 6.
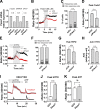
Pannexin1 contributes to hypotonic stress-induced ATP release. (A) ATP release induced by hypotonic stress in DIV5 cholangiocytes in the presence of PBC (500 µM, 1 mM) and CBX (50–100 µM). Data represent mean ± SEM for four to nine separate experiments. *, P < 0.026; ****, P < 0.0001 (ANOVA followed by Dunnett’s multiple comparison test). (B) Representative hypotonic Ca2+ responses in the presence (red trace) or absence (DMSO, black trace) of PBC (500 µM). (C) Percentage of cholangiocytes showing hypotonic Ca2+ responses in the presence or absence of PBC. ****, P < 0.0001 (Fisher test). (D and E) Peak Δratio (D) and AUC (E) of hypotonic Ca2+ responses recorded in the presence of PBC. ****, P < 0.0001 (unpaired t test). (F) Proportion of cholangiocytes showing hypotonic-induced Ca2+ responses in the presence or not of CBX. ****, P < 0.0001 (unpaired t test). (G) Representative Yoda1 (50 µM)–induced Ca2+ responses in the absence (black trace) or presence of PBC (500 µM, red trace). (H and I) Proportion of cholangiocytes showing Yoda1-induced Ca2+ responses (H) and corresponding peak amplitude (I) in the presence or not of PBC. **, P = 0.0035 (Fisher test; H); ****, P < 0.0001 (unpaired t test; I). (J) Yoda1 (50 µM)–induced Ca2+ responses in HEK293T-P1KO cells transfected with mPiezo1iresGFP cDNA in the presence (red trace, n = 123) or not (black trace, n = 115) of PBC (500 µM). (K) Peak Δratio of Yoda1-induced Ca2+ responses recorded in HEK293T-P1KO cells transfected with mPiezo1iresGFP cDNA with or without PBC. ns, P = 0.386 (unpaired t test). HYPO, hypotonic.
Figure 7.
Figure 7.
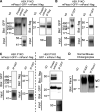
Identification of Panx1 as an interacting protein of Piezo1. (A and B) Immunoprecipitates from HEK293T-P1KO cells cotransfected with Piezo1-GFP and Panx1-flag cDNAs. Protein interaction was analyzed by immunoprecipitation (IP) using anti-flag (A) and anti-GFP (B) antibodies, followed by immunoblots with the indicated antibodies. Six independent experiments. Inputs: Blot membranes were stained with Ponceau red to verify appropriate protein transfer and the presence of the heavy chain of antibodies used for IPs. (C) Pull-down was absent using an anti-Ki67 antibody as control for isotype IgG (left). Immunoprecipitation of Panx1-flag was absent in HEK293T-P1KO cells transfected with GFP and mPanx1-flag cDNAs (right). (D) Immunoprecipitates from NMCs with anti-Piezo1 (right) or anti-Ki67 (left) antibodies. Immunoprecipitation was followed by immunoblots with the anti-Panx1 antibody. Three independent experiments. The arrow indicates Panx1.
Figure S6.
Figure S6.
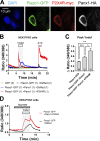
Reconstitution of Piezo1/Panx1/P2X4R mechanosecretory pathway in HEK293T-P1KO cells. (A) Triple immunofluorescent stainings in a HEK293T-P1KO cell transfected with Piezo1-GFP, Panx1-HA, and P2X4R-myc. (B) Ca2+ signals in response to Yoda1 (50 µM) in HEK293T-P1KO cells transfected with GFP (green trace), Piezo1-GFP, and DsRed (black trace), Piezo1-GFP, Panx1, and DsRed (blue trace), and Piezo1-GFP, Panx1, and P2X4R (red trace). The ratio of cDNA is indicated in brackets. Note the huge increase in the purinergic response in the cell expressing P2X4R. (C) Peak amplitude of Yoda1-induced Ca2+ responses in transfected HEK293T-P1KO cells as indicated. *, P = 0.0479; **, P = 0.0029; ***, P = 0.0005 (unpaired t test). n = 2. (D) Yoda1-induced Ca2+ responses in HEK293T-P1KO cells expressing Piezo-GFP and DsRed (black trace) or Piezo-GFP, Panx1, and P2X4R (red trace) and treated with apyrase (5 U/ml). Note the overshoot response when apyrase was turned off.
Figure 8.
Figure 8.
Piezo1Panx1 complex model for stretch-induced ATP release in cholangiocytes. Hypotonic stress elevates intracellular calcium in cholangiocytes through a mechanism that depends on Ca2+ influx and secreted ATP. The cellular mechanism of regulated ATP release involves sequential activation of Piezo1 and Panx1. By mediating a rise in intracellular Ca2+, Piezo1 is responsible for translating membrane stretch into Panx1-mediated ATP secretion. Released ATP binds P2X4R in an autocrine/paracrine manner, which may influence transport processes and ductal bile secretion. RE, endoplasmic reticulum.

References

    1. Banales, J.M., Huebert R.C., Karlsen T., Strazzabosco M., LaRusso N.F., and Gores G.J.. 2019. Cholangiocyte pathobiology. Nat. Rev. Gastroenterol. Hepatol. 16:269–281. 10.1038/s41575-019-0125-y - DOI - PMC - PubMed
    1. Botello-Smith, W.M., Jiang W., Zhang H., Ozkan A.D., Lin Y.C., Pham C.N., Lacroix J.J., and Luo Y.. 2019. A mechanism for the activation of the mechanosensitive Piezo1 channel by the small molecule Yoda1. Nat. Commun. 10:4503. 10.1038/s41467-019-12501-1 - DOI - PMC - PubMed
    1. Boyer, J.L. 2013. Bile formation and secretion. Compr. Physiol. 3:1035–1078. 10.1002/cphy.c120027 - DOI - PMC - PubMed
    1. Cinar, E., Zhou S., DeCourcey J., Wang Y., Waugh R.E., and Wan J.. 2015. Piezo1 regulates mechanotransductive release of ATP from human RBCs. Proc. Natl. Acad. Sci. USA. 112:11783–11788. 10.1073/pnas.1507309112 - DOI - PMC - PubMed
    1. Coddou, C., Sandoval R., Hevia M.J., and Stojilkovic S.S.. 2019. Characterization of the antagonist actions of 5-BDBD at the rat P2X4 receptor. Neurosci. Lett. 690:219–224. 10.1016/j.neulet.2018.10.047 - DOI - PMC - PubMed

Publication types