. 2022:2404:247-266.
doi: 10.1007/978-1-0716-1851-6_13.

Visualization and Quantification of Subcellular RNA Localization Using Single-Molecule RNA Fluorescence In Situ Hybridization

Affiliations

Visualization and Quantification of Subcellular RNA Localization Using Single-Molecule RNA Fluorescence In Situ Hybridization

Ankita Arora et al. Methods Mol Biol. 2022.

Abstract

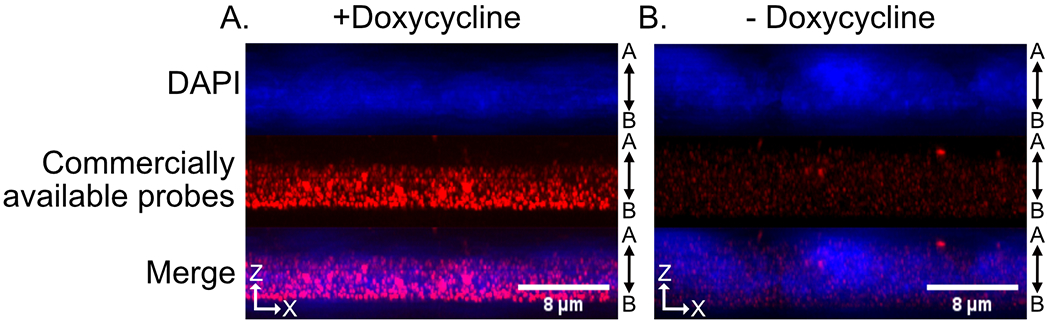
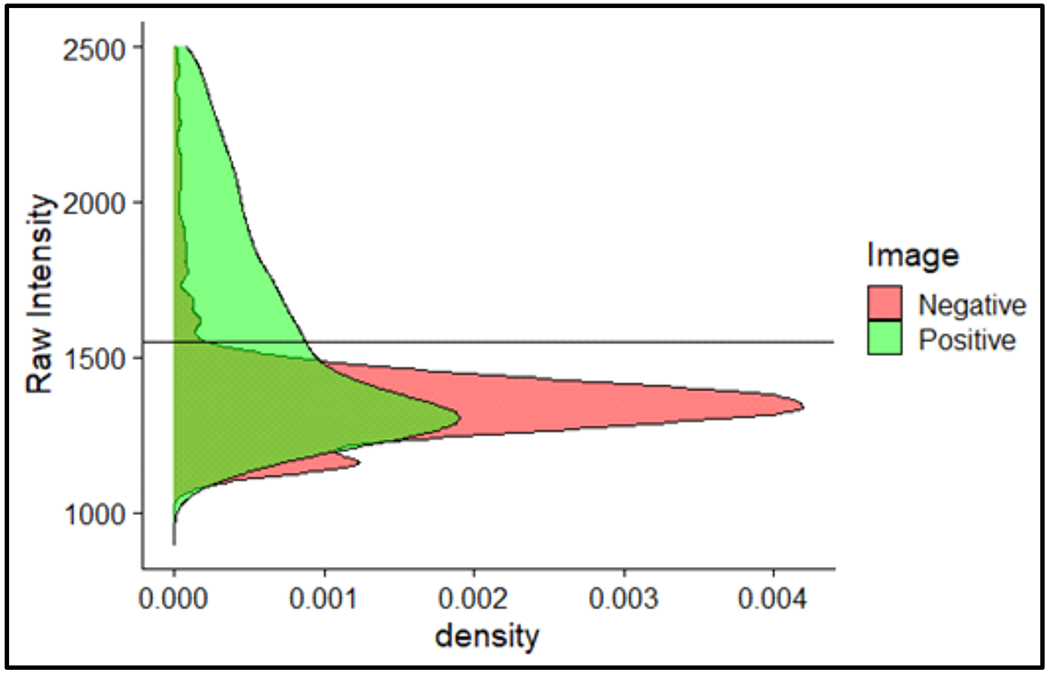
Advancements in imaging technologies, especially approaches that allow the imaging of single RNA molecules, have opened new avenues to understand RNA regulation, from synthesis to decay with high spatial and temporal resolution. Here, we describe a protocol for single-molecule fluorescent in situ hybridization (smFISH) using three different approaches for synthesizing the fluorescent probes. The three approaches described are commercially available probes, single-molecule inexpensive FISH (smiFISH), and in-house enzymatically labeled probes. These approaches offer technical and economic flexibility to meet the specific needs of an experiment. In addition, we provide a protocol to perform automated smFISH spot detection using the software FISH-quant.

Keywords: Fluorescence in situ hybridization; Fluorescence microscopy; RNA imaging; RNA localization; RNA transport; Single-molecule RNA quantification.


Figures

Figure 1:
Figure 1:
Schematics showing the principles of various techniques to perform smFISH. A) Commercially available probes, B) smiFISH probes and C) Enzymatically labeled probes.
Figure 2:
Figure 2:
Representative smFISH images from the three different strategies, commercially available probes from Stellaris, smiFISH probes and enzymatically-labeled probes. Undifferentiated mouse neuronal CAD cells expressing a doxycycline-inducible Firefly luciferase reporter construct were probed with A) commercially available probes from Stellaris, B) smiFISH probes or C) enzymatically labeled probes. The addition of doxycycline ensures robust reporter mRNA expression while doxycycline negative images show background probe signal. Images are representative max projections through a z-stack. Large blotches of signal, most visible in the smiFISH signal, are likely aggregates of probe that, due to their large and irregular size, will be ignored during the computational calling of spots. Scale bar: 25 μm
Figure 3:
Figure 3:
Using smFISH to image apical and basal localization in intestinal epithelial C2bbe1 cells. Differentiated human C2bbe1 intestinal epithelial cell monolayers expressing (A) and not expressing (B) Firefly luciferase reporter constructs. Images are representative orthogonal max projections through a z-stack with the apical surface of the cells towards the top and the basal surface of the cells towards the bottom (denoted by vertical arrows). Scale bar: 8 μm
Figure 4:
Figure 4:
Analyzing 3′ labeling of the oligonucleotide probes by PAGE. The unlabeled probes (Lane 1) are conjugated with amino-ddUTP at their 3′ end using the enzyme TdT (Lane 2). Q570–NHS ester is then reacted with NH2-ddUTP labeled probes to yield fluorescent probes for smFISH imaging (Lane 3-7). Lanes 3 - 7 show increase in labeling efficiency with increasing molar excess of the Q570-NHS ester compared to the ddUTP-labeled probes. The labeling reaches the maximum at 50X molar excess of Q570-NHS ester (Lane 6). Gel Green staining is shown in green and Q570 fluorescence is shown in red.
Figure 5:
Figure 5:
Screenshots of FISH-quant GUI. A) FISH-quant GUI after loading a single channel z-stack image. B) GUI for managing experimental parameters.
Figure 6:
Figure 6:
Outline designer GUI Screenshot of outline designer GUI with smFISH image with DAPI channel overlaid. The cell body and neurite have been outlined with the polygon feature.
Figure 7:
Figure 7:
Screenshot of pre-detection GUI A) GUI for managing pre-detection parameters. B) GUI of pixel intensity thresholding. C) Pre-detection of neuron cell body after thresholding.
Figure 8:
Figure 8:
Screenshot of FISH-quant main interface after fitting pre-detected spots. Results of detection after thresholding each spot characteristic are visualized.
Figure 9:
Figure 9:
Screenshot of FISH-quant Batch mode. Additional thresholding on aggregate spot population is available here.
Figure 10:
Figure 10:
Raw spot intensity for all detected spots in cells expressing Firefly luciferase reporter (green, positive) and cells not expressing Firefly luciferase reporter (red, negative). Here, a threshold intensity (black line) that excludes almost all spots in cells lacking the reporter is defined. This threshold for spot calling therefore removes many noisy, false positive spots.

References

    1. Kim-Ha J, Smith JL, and Macdonald PM (1991) oskar mRNA is localized to the posterior pole of the Drosophila oocyte. Cell 66:23–35 - PubMed
    1. Zimyanin VL, Belaya K, Pecreaux J, et al. (2008) In vivo imaging of oskar mRNA transport reveals the mechanism of posterior localization. Cell 134:843–853 - PMC - PubMed
    1. St Johnston D, Beuchle D, and Nüsslein-Volhard C (1991) Staufen, a gene required to localize maternal RNAs in the Drosophila egg. Cell 66:51–63 - PubMed
    1. Mowry KL and Melton DA (1992) Vegetal messenger RNA localization directed by a 340-nt RNA sequence element in Xenopus oocytes. Science 255:991–994 - PubMed
    1. Long RM, Singer RH, Meng X, et al. (1997) Mating type switching in yeast controlled by asymmetric localization of ASH1 mRNA. Science 277:383–387 - PubMed

Publication types

LinkOut - more resources