. 2022 Mar;289(6):1625-1649.
doi: 10.1111/febs.16248. Epub 2021 Nov 12.

Cytosolic localization and in vitro assembly of human de novo thymidylate synthesis complex

Affiliations

Cytosolic localization and in vitro assembly of human de novo thymidylate synthesis complex

Sharon Spizzichino et al. FEBS J. 2022 Mar.

Abstract

De novo thymidylate synthesis is a crucial pathway for normal and cancer cells. Deoxythymidine monophosphate (dTMP) is synthesized by the combined action of three enzymes: serine hydroxymethyltransferase (SHMT1), dihydrofolate reductase (DHFR) and thymidylate synthase (TYMS), with the latter two being targets of widely used chemotherapeutics such as antifolates and 5-fluorouracil. These proteins translocate to the nucleus after SUMOylation and are suggested to assemble in this compartment into the thymidylate synthesis complex. We report the intracellular dynamics of the complex in cancer cells by an in situ proximity ligation assay, showing that it is also detected in the cytoplasm. This result indicates that the role of the thymidylate synthesis complex assembly may go beyond dTMP synthesis. We have successfully assembled the dTMP synthesis complex in vitro, employing tetrameric SHMT1 and a bifunctional chimeric enzyme comprising human thymidylate synthase and dihydrofolate reductase. We show that the SHMT1 tetrameric state is required for efficient complex assembly, indicating that this aggregation state is evolutionarily selected in eukaryotes to optimize protein-protein interactions. Lastly, our results regarding the activity of the complete thymidylate cycle in vitro may provide a useful tool with respect to developing drugs targeting the entire complex instead of the individual components.

Keywords: cancer metabolism; protein-protein complex; purine synthesis; thymidylate synthesis; transient interactions.


Conflict of interest statement

The authors declare that they have no conflicts of interest.

Figures

Fig. 1
Fig. 1
Identification of proteins proximity in cancer cell lines. (A) Scheme of the is‐PLA: 1, primary antibodies bind specific proteins; 2, secondary antibodies conjugated with oligonucleotides (proximity probes) bind to anti‐rabbit or mouse primary antibodies; 3, if the two proteins are interacting (< 40 nm apart), the proximity probes can hybridize with the two connector oligos; 4, the ligation step produces a circular DNA template; 5, circular DNA is then amplified by DNA polymerase. Detection oligos coupled to fluorochromes hybridize to repeating sequences in the amplicons yielding the is‐PLA signal detected by fluorescent microscopy as discrete spots (inset). (B) is‐PLA signals, corresponding to DHFR/SHMT, SHMT/TYMS and DHFR/TYMS interactions, are shown (red dots). TYMSM and TYMSR both indicate antibodies against TYMS but anti‐mouse and anti‐rabbit, respectively. The is‐PLA spots of interaction of proteins are shown in A549 cells synchronised in the S‐phase after a 24‐h single thymidine block (upper) or in A549 asynchronous cells (bottom). Scale bars = 10 µm. The merge with DAPI signal is shown on the right. Controls are shown in Fig. 4B–F. (C) Nuclear localization of the is‐PLA signal (number of spots within the normalized nucleus area). In all of the experiments, the number of PLA spots increase in the S‐enriched cells (t‐test: **P < 0.005; ****P < 0.0001). At least 160 cells were analysed per condition. (D) Left: representation of PCNA positive cells, corresponding to S‐phase of the cell cycle. Scale bar = 10 µm. Right: immunofluorescence signal in an asynchronous population or after a single thymidine block of A549. The histogram on the right shows the percentage of PCNA positive or negative cells after and before synchronisation. At least 500 cells were counted per conditions, from three independent experiments; SD values are shown. After synchronisation, the cells in S‐phase comprise approximately 80% of the cellular population.
Scheme 1
Scheme 1
Scheme of the nuclear dTMP‐SC catalytic cycle. SHMT1, DHFR and TYMS are SUMOylated and translocate to the nucleus during G1/S‐phase, where they are proposed to assemble to form the dTMP synthesis complex (dTMP‐SC), anchored to the nuclear lamina [7]. The oligomeric state of the three enzymes is also reported.
Fig. 2
Fig. 2
Immunofluorescence co‐localization analysis. (A) Co‐localization of DHFR/SHMT1, SHMT1/TYMS and TYMS/DHFR in asynchronous A549 cells. Co‐localization is evident both in the cytosol (tubulin alpha, cyan) and in the nucleus (DAPI, blue) for all the three couples. The original red fluorescence signal of tubulin was changed to cyan for better visualization of the merged images. The merge of green, red and cyan pixels yields white pixels.
Fig. 3
Fig. 3
Immunofluorescence analysis. (A–C) Compartmentalization of the three proteins with respect to the cellular phase by Immunofluorescence analysis. SHMT1 (A), DHFR (B) and TYMS (C) show a cytoplasmic localization both in the asynchronous and S‐phase synchronised cells. Scale bar = 10 µm. (D) Nuclear localization (as deduced by the normalized intensity of the fluorescence signal) is clearly more abundant in the S‐enriched cells for SHMT1; a slight increase is observed for TYMS (with both the antibodies used in the PLA experiments; rabbit, TYMSR; and mouse, TYMSM; see Materials and methods). No change was observed for DHFR. (t‐test: *P < 0.05; **P < 0.005; ****P < 0.0001). Error bars represent the SD. At least 80 cells per condition from two independent experiment were analysed. (E) Western blot of subcellular fractionation of both asynchronous and S‐phase enriched A549 cell lines. Western blotting analysis was performed using a 1 : 1000 dilution of the primary antibodies. For Histone H3, the correct band is boxed in red. The other bands detected in the cytosol have a molecular weight lower than 15 kDa and are also present in the nuclear fractions. Giving that the molecular weight of Histone H3 is 17 kDa, and the bands recur in all the four lanes, it is plausible that they are detected because of non‐specific interactions of the primary or secondary antibody. In this experiment, the quantitative analysis was not performed, but it is still possible to detect the bands of SHMT1 and TYMS only in the nucleus of the S‐phase enriched cells. As shown in the IF experiments, it was not possible to detect an increase of the presence of DHFR in the nucleus of the synchronised cells.
Fig. 4
Fig. 4
is‐PLA analysis on HeLa cells and is‐PLA negative controls on A549 cells. (A) PLA signal of protein interaction is shown in HeLa non‐synchronized cells. (B) Negative controls of is‐PLA signals. PLA experiment was performed without one of the primary antibodies (A549 cells). In these conditions, there is no or little PLA signal. TYMSM and TYMSR both indicate antibodies against TYMS but anti‐mouse and anti‐rabbit, respectively. (C–E) is‐PLA for the three protein–protein interaction performed on A549 cells 48 h after transfection with scrambled or siRNA for shmt1. For the DHFR/SHMT1 and TYMS/SHMT1 interactions the PLA signal is significantly lower in the RNAi cells, whereas, for the DHFR/TYMS interaction, the signal of the scramble and RNAi samples is similar. For all panels (A‐E), the scale bar in the bottom right corner is 10 µm. (F) SHMT1 expression control of RNAi.
Fig. 5
Fig. 5
Designing human DHFR‐TYMS Chimera. (A) Cartoon representation of the chimeric model of human DHFR‐TYMS (in purple and blue, respectively; the linker is shown in red; the N‐terminus position is also indicated) superposed with the structure of the bifunctional enzyme from B. bovis (PDB ID: 3I3R [35]) in light grey. The enzyme is dimeric, the partner subunit is shown as surface representation. (B) Electrostatic surface potentials, as calculated using apbs (Adaptive Poisson–Boltzmann Solver) [61], at the modelled interface between hDHFR and hTYMS, showing a perfect complementarity. Partially positive or negative regions are indicated in blue and red, respectively. (C) Scheme of the final constructs differing only for the linker length and consequently named Chimera‐Long and Chimera‐Short. Structural renderings were produced using pymol.
Fig. 6
Fig. 6
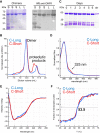
Purification and spectroscopic characterization of Chimera. (A) SDS/PAGE and western blotting of IMAC elution peaks (150–200 mm imidazole) of different preparations of Chimera‐Short (S) and ‐Long (L). (B) Typical SEC chromatogram of IMAC fractions of Chimera Constructs. The proteolyzed proteins are well separated from the main peak, containing the full‐length protein eluting as a dimer. The signal is normalized for a better comparison (column: Superdex 200 10/300). (C) Auto proteolysis assay: after IMAC, a small amount of Chimera‐Short was kept at 4 °C for 6 days to test whether the purified protein undergoes proteolysis in the purification buffer. Ctr, protein after SEC. No further proteolysis was observed. Typical final yields were between 6 and 4 mg·L−1 of culture for Chimera‐Long and ‐Short, respectively. (D) Normalised UV spectra of Chimera‐constructs in 100 mm potassium phosphate, pH 7.4. The shoulder at 325 nm is likely a result of bound NADPH. (E) Dichroic spectra of 10 µm Chimera constructs at 20 °C in a 1‐mm quartz cuvette. (F) Normalized thermal denaturation profiles of 10 µm Chimera constructs.
Fig. 7
Fig. 7
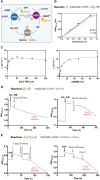
Activity assays: restoring the thymidylate cycle in vitro. (A) Scheme of the reactions assayed to test the catalytic activity of Chimera. All the reactions were performed at 20 °C in 20 mm K‐phosphate pH 7.2, 75 mm β‐mercaptoethanol. (B) Reaction 1; plot of the initial rate of dTMP formation as a function of Chimera concentration at constant substrate (0.1 mm dUMP, 0.2 mm CH2‐THF) (Chimera‐Short, black squares; Chimera‐Long, gray triangles). (C) Plot of initial rates of reaction 1 as a function of CH2‐THF concentration (left; 0.1 mm dUMP fixed concentration) and of dUMP concentration (right; 0.05 mm CH2‐THF fixed concentration). Error bars represent the SD of three independent measurements. (D) Reactions 1 + 2; time course of the coupled reactions of TMYS and DHRF. The observed rates (ΔAbs@340 nm·min−1) are also reported in red. To 0.1 mm dUMP and 0.1 mm NADPH, 0.1 mm CH2‐THF and 0.5 μm Chimera‐Long (left) or Chimera‐Short (right) were sequentially added (arrows). (E) Reactions 1 + 2 + 3; to the reaction mixture containing 0.1 mm dUMP, 10 mm serine and 0.1 mm NADPH, 16 μm THF and 0.5 μm Chimera‐Long (left) or Chimera‐Short (right) were added, and finally 0.5 μm SHMT1 was added (arrows). The thymidylate cycle can only start after the addition of SHMT1 that is needed to convert THF to CH2‐THF.
Fig. 8
Fig. 8
IP and FWB. (A) FWB: The prey proteins (SHMT1 or Chimera‐Long) were resolved alone by SDS/PAGE, electroblotted on a PVDF membrane, refolded and then incubated with 50 ng·mL−1 of the bait protein at 4 °C o.n. Left: the band detected at SHMT1 lane and height represents Chimera, and the band detected at Chimera lane and height, on the right image represents SHM1. The bait proteins were used in place of the prey proteins as positive controls, whereas RmcA (a bi‐domain bacterial protein construct from P. aeruginosa for which the two domains have a molecular weight comparable to DHFR and TYMS) was used as a negative control [63]. The formation of the complex between SHMT1 and Chimera‐Short (B) or SHMT1 dimeric mutant and Chimera‐Long (C) was tested by following the experimental set‐up described previously. Nevertheless, and despite over exposition of the membranes, in both cases, formation of the complex was not observed. (D) IP experiment: SHMT1 and Chimera‐Long were mixed at a ratio of 1 : 2 at a final concentration of 18 μm for SHMT1 and 36 μm for Chimera‐Long. The proteins were attached to the Protein G‐agarose beads by using specific antibodies (anti‐TYMS or anti‐SHMT1). The samples were incubated at 4 °C o.n. In the first two images (left), the detected band represents Chimera‐Long, whereas, in the image on the right, the detected band refers to SHMT1.
Fig. 9
Fig. 9
SPR and BLI experiments. (A) SPR: full kinetic analysis of SHMT1 (85, 42.5, 21.2, 5.3 and 2.66 μm) binding to Chimera (channel 3). Orange lines represent the global fits of the data to a 1 : 1 bimolecular interaction model. (B) BLI: aligned traces showing association and dissociation steps of SHMT1 (1, 3, 7.5, 15 and 30 µm) to Chimera, immobilized using mouse anti‐DHFR and a Protein‐A coated biosensor (in blue); time courses of each step were fitted with a two‐exponential equation (in red). The kinetic binding parameters [affinity (K d) and rate constants (k on, k off)] for the SHMT1‐Chimera interaction calculated from the SPR and BLI experiments are reported in Table 1. (C) Computational model of the dTMP‐SC: predicted interaction mode between human TS‐DHFR (light and dark grey surface) and SHMT1 tetramer (each dimer is depicted as pink and slate cartoons). Structural renderings were produced using pymol.
Fig. 10
Fig. 10
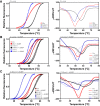
DSF. SHMT1 and Chimera constructs were mixed at a final concentration of 0.5 μm. When present, the concentration of CHO‐THF and NADPH were 0.1 mm, dUMP was 1 mm. All samples were incubated o.n. at 4 °C in 20 mm Na Hepes, pH 7.5, and 50 mm NaCl, before starting the analysis. (A) denaturation profiles of SHMT1, Chimera‐Long and of the mixed proteins in the absence of ligands or substrates. (B) Denaturation profiles of SHMT1 and Chimera‐Long in the presence of dUMP (square markers and continuous lines) compared to the signals obtained with no ligands/substrates (circle markers and dashed lines). (C) The same profiles as in (B) with the Short instead of Long construct. For all panels, plots in the left column show the change in fluorescence as a function of temperature, whereas, in the right column, the denaturation profiles are plotted as the first derivative of the fluorescence emission as a function of temperature. The calculated T m for all the substrates assayed are reported in Table 2.
Scheme 2
Scheme 2
dTMP‐SC formation equilibrium in the cytosol. Scheme of the processes that may be affected by the assembly of the dTMP‐SC in the cytosol. After complex formation, some regions of the three enzymes may become less accessible. This may in turn affect: (A) the SUMOylation/deSUMOylation equilibrium, which controls nuclear translocation and possibly other functions; (B) the ability of the proteins to bind mRNA and cross‐regulate protein homeostasis and, in the case of SHMT1, also the catalytic activity (riboregulation) [45] with a direct effect on the folate cycle and OCM; (C) other PPI or post‐transcriptional modifications, as well as the mitochondrial import of TYMS.

References

    1. Pai C & Kearsey S (2017) A critical balance: dNTPs and the maintenance of genome stability. Genes (Basel) 8, 57. - PMC - PubMed
    1. Chon J, Stover PJ & Field MS (2017) Targeting nuclear thymidylate biosynthesis. Mol Aspects Med 53, 48–56. - PMC - PubMed
    1. Amelio I, Cutruzzolá F, Antonov A, Agostini M & Melino G (2014) Serine and glycine metabolism in cancer. Trends Biochem Sci 39, 191–198. - PMC - PubMed
    1. Stover PJ & Field MS (2011) Trafficking of intracellular folates. Adv Nutr 2, 325–331. - PMC - PubMed
    1. Field MS, Kamynina E, Chon J & Stover PJ (2018) Nuclear folate metabolism. Annu Rev Nutr 38, 219–243. - PMC - PubMed

Publication types

MeSH terms

Substances