. 2021 Nov 26;6(11):4067-4075.
doi: 10.1021/acssensors.1c01527. Epub 2021 Oct 25.

Electrochemical Capillary-Flow Immunoassay for Detecting Anti-SARS-CoV-2 Nucleocapsid Protein Antibodies at the Point of Care

Affiliations

Electrochemical Capillary-Flow Immunoassay for Detecting Anti-SARS-CoV-2 Nucleocapsid Protein Antibodies at the Point of Care

Isabelle C Samper et al. ACS Sens. .

Abstract

Rapid and inexpensive serological tests for SARS-CoV-2 antibodies are needed to conduct population-level seroprevalence surveillance studies and can improve diagnostic reliability when used in combination with viral tests. Here, we report a novel low-cost electrochemical capillary-flow device to quantify IgG antibodies targeting SARS-CoV-2 nucleocapsid proteins (anti-N antibody) down to 5 ng/mL in low-volume (10 μL) human whole blood samples in under 20 min. No sample preparation is needed as the device integrates a blood-filtration membrane for on-board plasma extraction. The device is made of stacked layers of a hydrophilic polyester and double-sided adhesive films, which create a passive microfluidic circuit that automates the steps of an enzyme-linked immunosorbent assay (ELISA). The sample and reagents are sequentially delivered to a nitrocellulose membrane that is modified with a recombinant SARS-CoV-2 nucleocapsid protein. When present in the sample, anti-N antibodies are captured on the nitrocellulose membrane and detected via chronoamperometry performed on a screen-printed carbon electrode. As a result of this quantitative electrochemical readout, no result interpretation is required, making the device ideal for point-of-care (POC) use by non-trained users. Moreover, we show that the device can be coupled to a near-field communication potentiostat operated from a smartphone, confirming its true POC potential. The novelty of this work resides in the integration of sensitive electrochemical detection with capillary-flow immunoassay, providing accuracy at the point of care. This novel electrochemical capillary-flow device has the potential to aid the diagnosis of infectious diseases at the point of care.

Keywords: SARS-CoV-2; capillary-flow device; electrochemistry; point-of-care (POC) diagnostics; serology.


Figures

Figure 1.
Figure 1.
Schematic overview of the electrochemical capillary-flow immunoassay. (A) Exploded view (i) and 3-dimensional view (ii) of the capillary-flow device incorporating a stencil printed carbon electrode (SPCE) facing a nitrocellulose membrane (NCM). Exploded view (i) shows the 4 layers of polyester film (grey, L1, L3, L5, L7) and the 3 layers of double-sided adhesive (turquoise, L2, L4, L6) assembled to create the 3-dimensional microfluidic network represented in (ii). Pink arrows indicate flow direction during delivery regime. In channels where flow direction is different between filling and delivery regimes, blue arrows indicate flow direction during filling regime. Where channels are superimposed, arrows indicate flow direction in both top and bottom channels. (B) Electrochemical immunoassay and detection mechanism. If present in the sample, anti-N antibodies are captured by N proteins striped on the NCM. Secondary HRP-labelled antibodies subsequently bind to anti-N antibodies and catalyze the oxidation of the substrate TMB, creating an electroactive compound (oxTMB) that is detected via chronoamperometry.
Figure 2.
Figure 2.
Sequential delivery of blood sample (A), washing buffer (B), HRP-antibodies (C) washing buffer (D) and TMB (E) to the detection area. HRP-antibody and TMB solutions are represented by yellow and blue dyes, respectively.
Figure 3.
Figure 3.
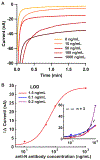
Static electrochemical detection of anti-N antibodies in PBS samples. (A) Chronoamperograms obtained from one SPCE consecutively connected to the NCM taken from five capillary-flow devices, each exposed to a 5 μL PBS-based sample of distinct anti-N antibody concentration. (B) Corresponding calibration curve showing blank-subtracted current at t=100 s (red). (Insert), amplification of B showing the measurements recorded with three independent SPCEs (red, blue and purple) and overall signal fit (black dashed line). Markers and error bars represent average and standard deviation (sd) over a 10 s interval centered in 100 s. Data fitted with a 4PL regression. LODs are calculated as the anti-N concentration corresponding to 3 sd of the blank signal.
Figure 4.
Figure 4.
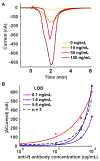
In-flow electrochemical detection of anti-N antibodies in PBS samples. (A) Excerpt of chronoamperograms recorded from one SPCE consecutively connected to four different capillary flow-devices, each supplied with a 5 μL PBS-based sample of distinct anti-N antibody concentration. Data was time-aligned with TMB delivery to the detection zone (t = 0). (B) Calibration curves obtained for three independent SPCEs (red from data shown in A, blue and purple) and overall fit for all three SPCEs (black dashed line). Markers and error bars represent average and sd over a 30 s interval centered in the current local minimum. Blank signal is subtracted from data. Data fitted with a 4PL regression. LODs are calculated as the anti-N concentration corresponding to 3 sd of the blank signal.
Figure 5.
Figure 5.
In-flow detection of anti-N antibodies in human whole blood samples. (A) Representative chronoamperograms recorded from one SPCE consecutively connected to four different capillary flow-devices supplied with 10 μL human whole blood samples spiked with different anti-N antibody concentrations. Data was time-aligned with TMB delivery to the detection zone (t = 0). (B) Calibration curves recorded with three independent SPCEs (red from data shown in A, blue and purple) and overall fit for all three SPCEs (black dashed line). Markers and error bars represent average and sd over a 30 s interval centered in the current local minimum. Blank signal is subtracted from data. Data fitted with a 4P regression. LODs are calculated as the anti-N concentration corresponding to 3 sd of the blank signal.
Figure 6.
Figure 6.
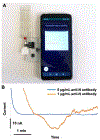
(A) Picture of the whole smartphone-based detection system, showing the electrochemical capillary-flow device connected to the NFC potentiostat, which is wirelessly operated from a smartphone. (B) In-flow chronoamperograms wirelessly recorded using the NFC potentiostat operated by a smartphone. Data is from two different capillary flow-devices supplied with 5 μL PBS-based samples of 0 and 1 μg/mL anti-N antibody concentrations.

References

    1. WHO Coronavirus (COVID-19) Dashboard | WHO Coronavirus Disease (COVID-19) Dashboard https://covid19.who.int/ (accessed Jul 10, 2021).
    1. Testing, Screening, and Outbreak Response for Institutions of Higher Education (IHEs) | CDC; https://www.cdc.gov/coronavirus/2019-ncov/community/colleges-universitie... (accessed Mar 12, 2021).
    1. Pollán M; Pérez-Gómez B; Pastor-Barriuso R; Oteo J; Hernán MA; Pérez-Olmeda M; Sanmartín JL; Fernández-García A; Cruz I; Fernández de Larrea N; et al. Prevalence of SARS-CoV-2 in Spain (ENE-COVID): A Nationwide, Population-Based Seroepidemiological Study. Lancet 2020, 396 (10250), 535–544. - PMC - PubMed
    1. Nuccetelli M; Pieri M; Grelli S; Ciotti M; Miano R; Andreoni M; Bernardini S SARS-CoV-2 Infection Serology: A Useful Tool to Overcome Lockdown? Cell Death Discov. 2020, 6 (1), 1–9. - PMC - PubMed
    1. Böger B; Fachi MM; Vilhena RO; Cobre AF; Tonin FS; Pontarolo R Systematic Review with Meta-Analysis of the Accuracy of Diagnostic Tests for COVID-19. Am. J. Infect. Control 2021, 49 (1), 21–29. - PMC - PubMed

Publication types