. 2021 Oct 26;144(17):1409-1428.
doi: 10.1161/CIRCULATIONAHA.121.056198. Epub 2021 Oct 25.

Sequential Defects in Cardiac Lineage Commitment and Maturation Cause Hypoplastic Left Heart Syndrome

Affiliations

Sequential Defects in Cardiac Lineage Commitment and Maturation Cause Hypoplastic Left Heart Syndrome

Markus Krane et al. Circulation. .

Abstract

Background: Complex molecular programs in specific cell lineages govern human heart development. Hypoplastic left heart syndrome (HLHS) is the most common and severe manifestation within the spectrum of left ventricular outflow tract obstruction defects occurring in association with ventricular hypoplasia. The pathogenesis of HLHS is unknown, but hemodynamic disturbances are assumed to play a prominent role.

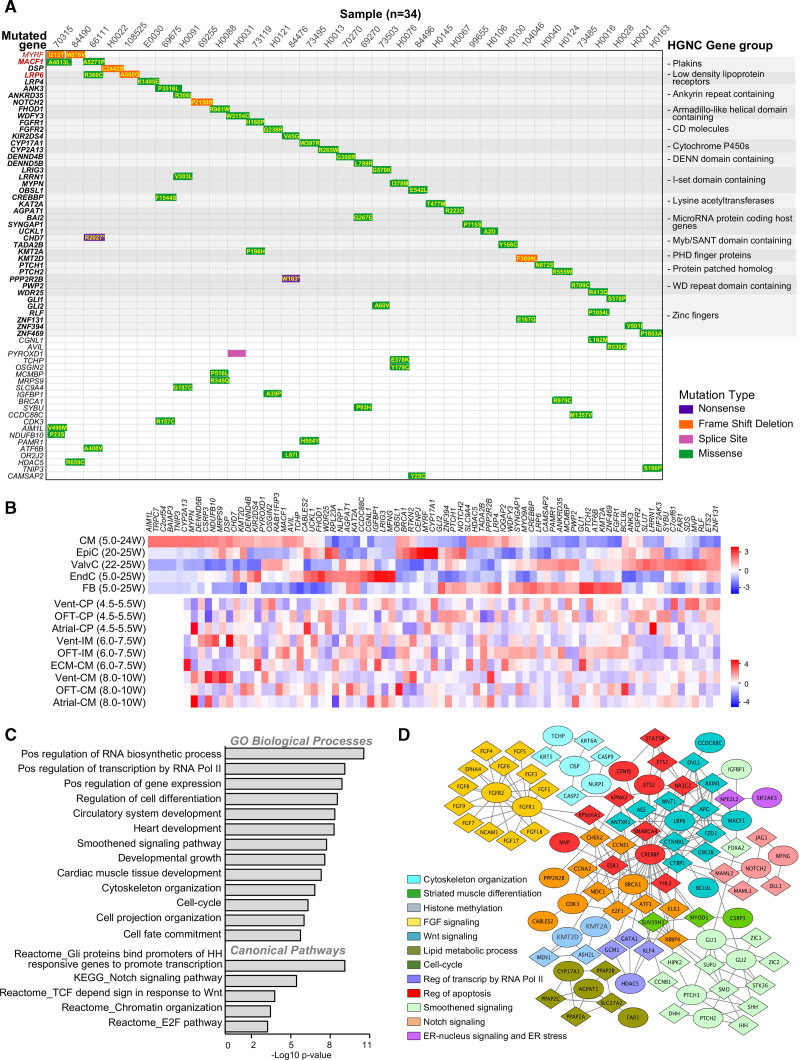
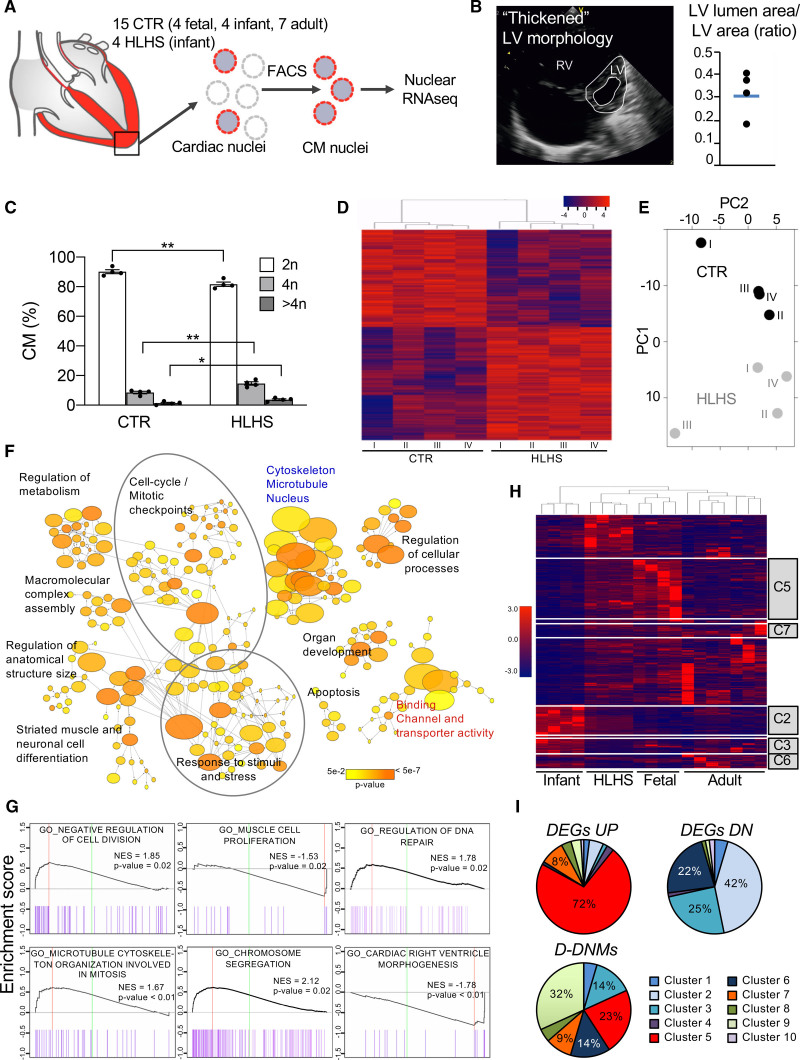
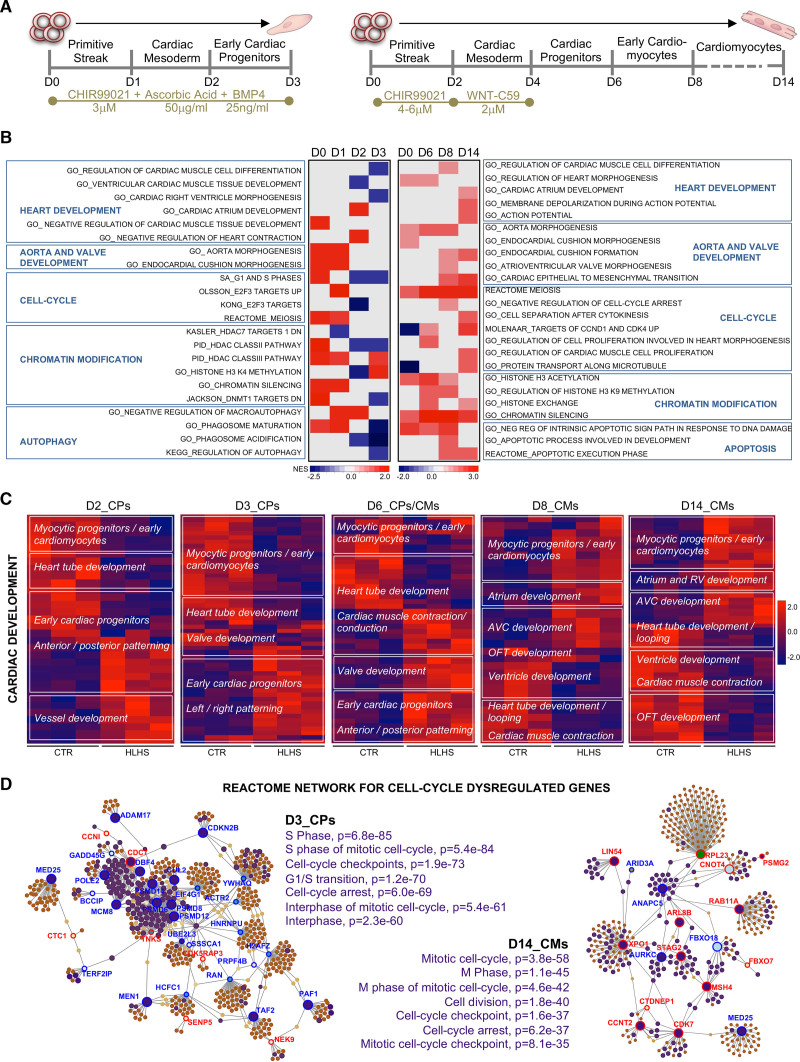
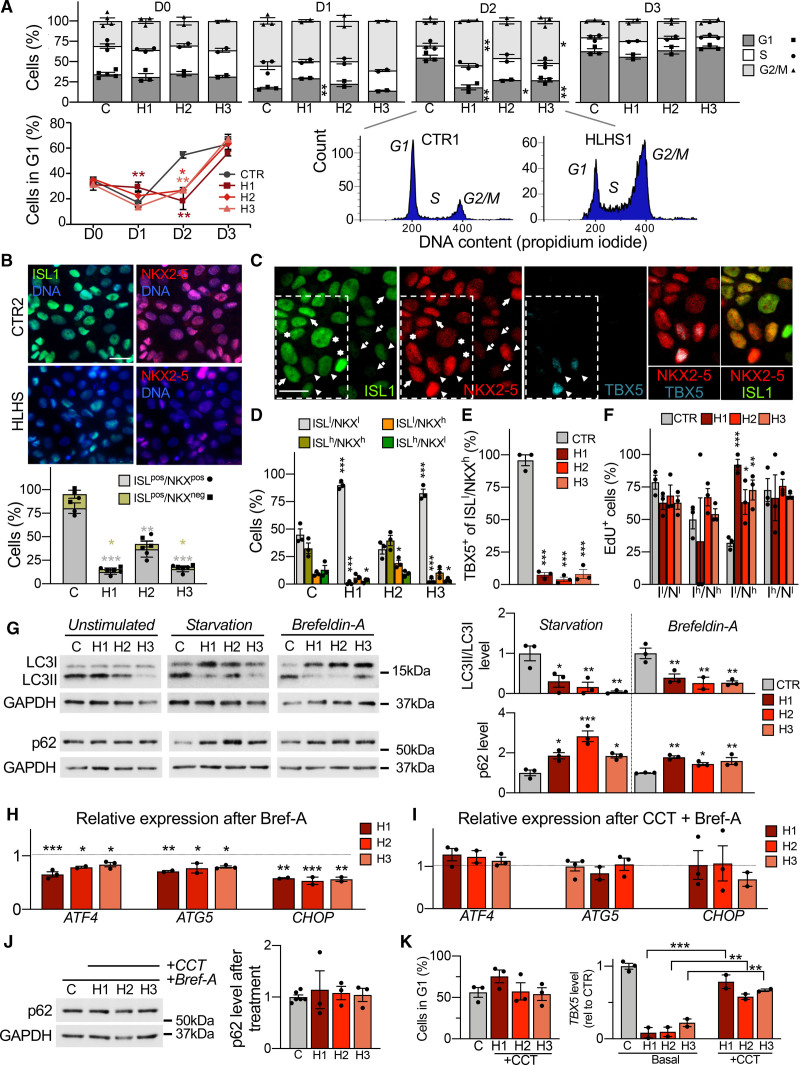
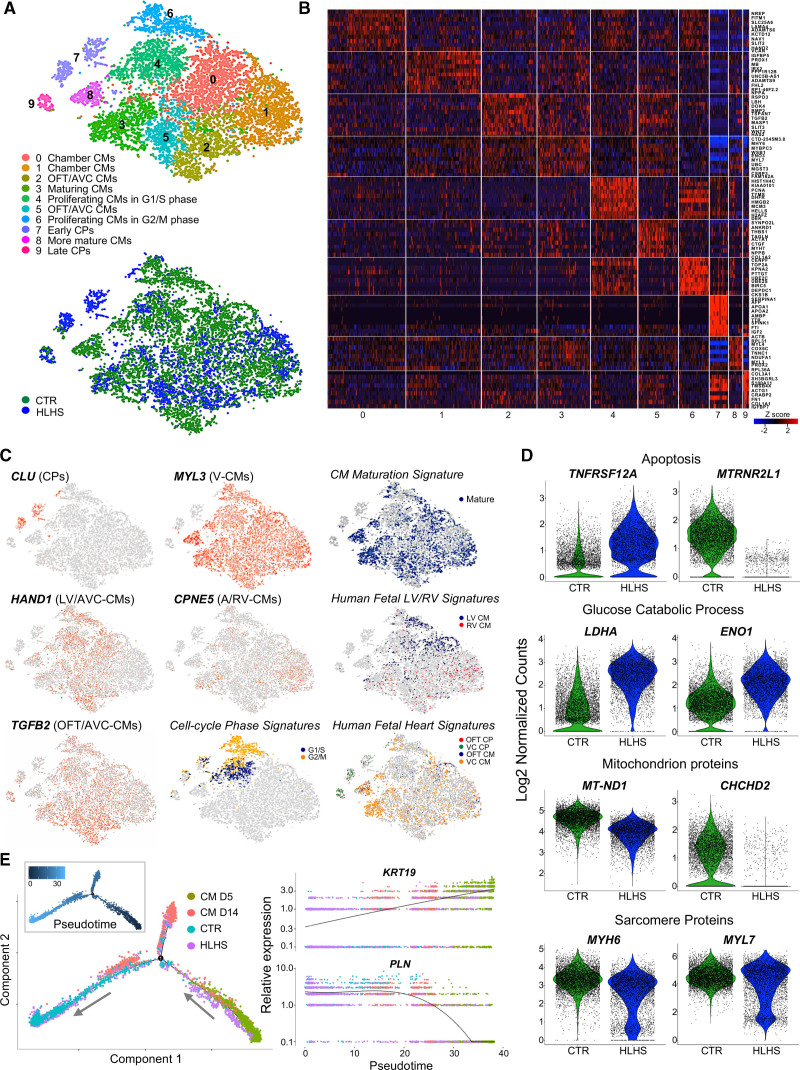
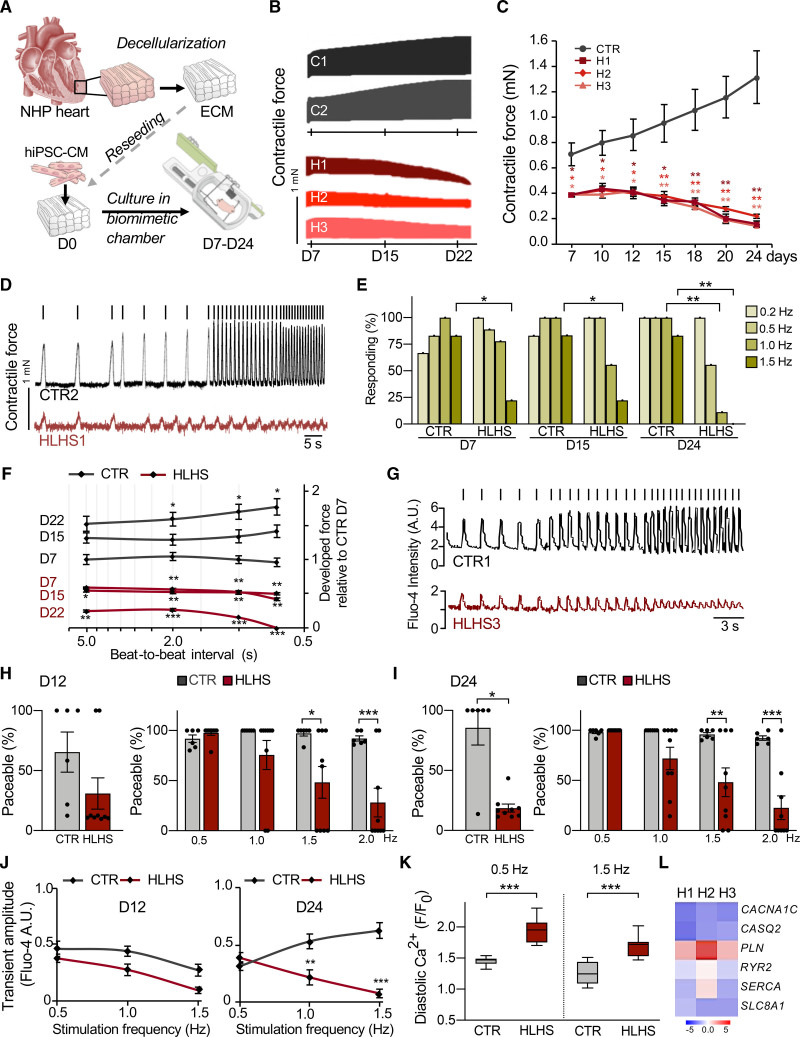
Methods: To identify perturbations in gene programs controlling ventricular muscle lineage development in HLHS, we performed whole-exome sequencing of 87 HLHS parent-offspring trios, nuclear transcriptomics of cardiomyocytes from ventricles of 4 patients with HLHS and 15 controls at different stages of heart development, single cell RNA sequencing, and 3D modeling in induced pluripotent stem cells from 3 patients with HLHS and 3 controls.

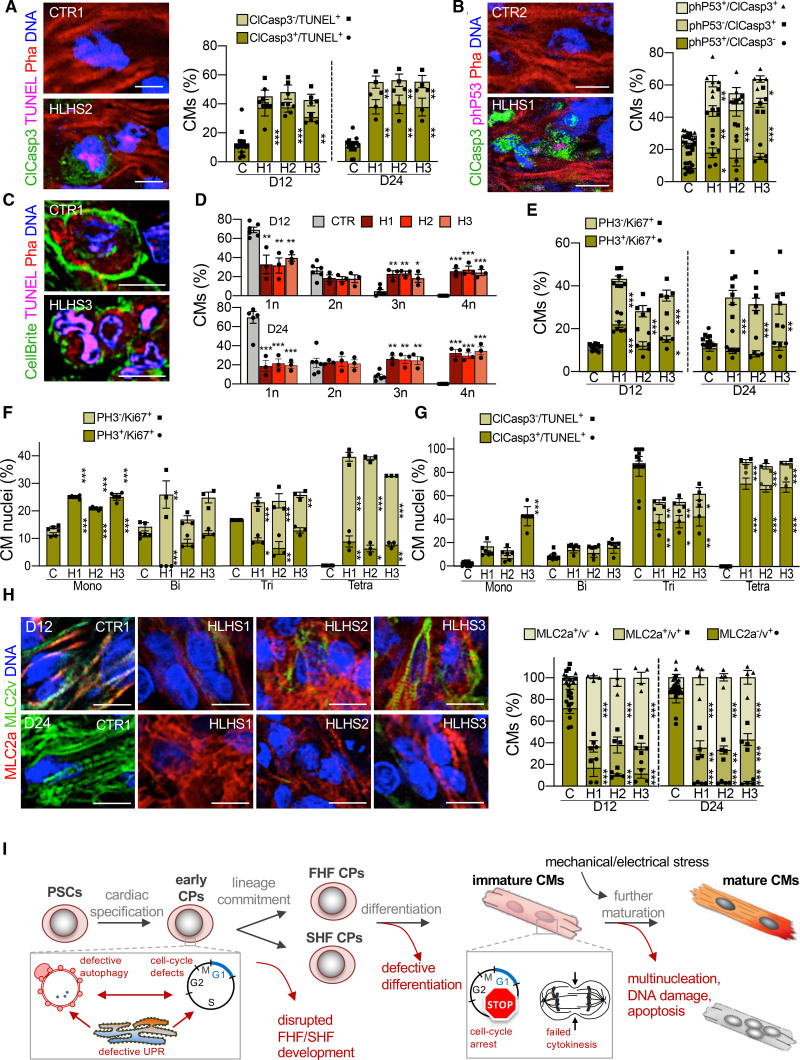
Results: Gene set enrichment and protein network analyses of damaging de novo mutations and dysregulated genes from ventricles of patients with HLHS suggested alterations in specific gene programs and cellular processes critical during fetal ventricular cardiogenesis, including cell cycle and cardiomyocyte maturation. Single-cell and 3D modeling with induced pluripotent stem cells demonstrated intrinsic defects in the cell cycle/unfolded protein response/autophagy hub resulting in disrupted differentiation of early cardiac progenitor lineages leading to defective cardiomyocyte subtype differentiation/maturation in HLHS. Premature cell cycle exit of ventricular cardiomyocytes from patients with HLHS prevented normal tissue responses to developmental signals for growth, leading to multinucleation/polyploidy, accumulation of DNA damage, and exacerbated apoptosis, all potential drivers of left ventricular hypoplasia in absence of hemodynamic cues.

Conclusions: Our results highlight that despite genetic heterogeneity in HLHS, many mutations converge on sequential cellular processes primarily driving cardiac myogenesis, suggesting novel therapeutic approaches.

Keywords: autophagy; cell cycle; heart defects, congenital; hypoplastic left heart syndrome; induced pluripotent stem cells; unfolded protein response; whole exome sequencing.


Figures

Figure 1.
Figure 1.
Characterization of damaging de novo mutations in patients with hypoplastic left heart syndrome. A, Waterfall plot of de novo multihit genes (red) or gene family (bold) identified in the hypoplastic left heart syndrome (HLHS) cohort. “Multihit” refers to the occurrence/presence of variants in the same gene or family of genes among different individuals. Additional de novo genes in each subject are in plain black. B, Cell type–specific expression of HLHS damaging de novo mutation (D-DNM) genes based on single-cell RNA sequencing from normal fetal hearts between 4.5 and 25 weeks (W) of gestation. Data from Ciu et al. and Sahara et al. were used to generate the upper and lower heatmap, respectively. C and D, Bar chart of Gene Ontology (GO) enrichment analysis (C) and protein–protein network analysis (D) of D-DNM genes. In D, each Netbox module is coded by a different color, with mutated genes illustrated as circles and linker genes as diamonds. CM indicates cardiomyocytes; CP, cardiac progenitor; ECM, extracellular matrix; EndC, endothelial cells; EpiC, epicardial cells; ER, endoplasmic reticulum; FB, fibroblasts; HGNC, HUGO Gene Nomenclature Committee; IM, intermediates; OFT, outflow tract; ValvC, valvular cells; and Vent, ventricular.
Figure 2.
Figure 2.
Gene expression analysis of cardiomyocyte nuclei from hypoplastic left heart syndrome and control hearts. A, Workflow of cardiomyocyte nuclei isolation for RNA sequencing (RNA-Seq). B, Representative echocardiogram of patients with hypoplastic left heart syndrome (HLHS) with a distinct left ventricular (LV) phenotype. Dot plot shows the ratio of LV lumen area/LV area for the 4 patients with HLHS and the average value (blue line). C, Ploidy level of cardiomyocyte nuclei in HLHS and control (CTR) hearts. Data are mean±SEM. *P<0.05, **P<0.01 (t test). D, Heatmap depicting normalized RNA-Seq expression values of differentially expressed genes (DEGs; 1.5-fold expression, P≤0.05). Gene regulations are reported as a color code and hierarchical clustering result as a dendrogram. E, Principal component analysis performed on rlog-normalized (DESeq2) counts for all nuclear RNA-Seq samples. F, Network visualization of the enriched Gene Ontology (GO) of HLHS DEGs using the Cytoscape plugins BinGO. Nodes represent enriched GO terms, node size corresponds to the gene number, and color intensity to the P value. Edges represent GO relation of biological process (black), molecular function (red), and cellular component (blue). G, Representative enrichment plots from gene set enrichment analysis. Normalized enrichment score (NES) and P value are specified. H, Heatmap illustrating the expression of HLHS DEGs during fetal, infant, and adult stages of normal cardiac development. The dendrogram shows clustering of the HLHS infant samples with control fetal samples. Genes belonging to developmentally regulated gene clusters from Figure IIIC in the Data Supplement are highlighted. I, Pie charts showing the percentage of HLHS upregulated (DEGs UP), downregulated (DEGs DN), and damaging de novo affected (D-DNM) genes belonging to the developmentally regulated gene clusters from Figure IIIC in the Data Supplement. CM indicates cardiomyocytes; FACS, fluorescence-activated cell sorting; and RV, right ventricle.
Figure 3.
Figure 3.
Gene expression analysis during induced pluripotent stem cell–based cardiogenesis reveals networks of dysregulated genes in hypoplastic left heart syndrome. A, Directed induced pluripotent stem cell cardiac differentiation protocols used in the study. B, Heatmap of normalized enrichment scores for selected gene set enrichment analysis terms. Red and blue denote terms with positive and negative normalized enrichment scores, respectively. C, Heatmaps showing gene expression of differentially expressed genes (1.5-fold expression, P≤0.05) involved in cardiac development at the indicated days of differentiation. Values are row-scaled to show their relative expression. Blue and red are low and high levels, respectively. D, Network analyst–generated protein–protein interactome of differentially expressed genes involved in cell cycle at day 3 and day 14. Upregulated (red) and downregulated (blue) genes are shown. In purple are highlighted the genes belonging to the enriched Gene Ontology categories specified on the side of the plots. Protein–protein interactions are indicated as solid gray lines between genes. AVC indicates atrioventricular canal; CM, cardiomyocytes; CP, cardiac progenitor; CTR, control; HLHS, hypoplastic left heart syndrome; OFT, outflow tract; and RV, right ventricle.
Figure 4.
Figure 4.
Defects in unfolded protein response and autophagy delay and disrupt cardiac progenitor lineage specification. To better discriminate possible phenotypic variations among diseased lines, functional results from each hypoplastic left heart syndrome (HLHS) line are shown separately. Data from control lines have been combined. A, Propidium iodide staining analysis of HLHS (H) and control cells (C) during cardiac progenitor (CP) differentiation. Data are mean±SEM; 2 to 4 differentiations per line, N≥20 000 cells per sample at each time point. *P<0.05, **P<0.01 compared with controls (CTR; 2-way analysis of variance [ANOVA]). B, Immunofluorescence analysis of ISL1 and NKX2-5 in HLHS and control CPs at day 2. Scale bar, 25 µm. Data are mean±SEM; 431 (CTR), 463 (HLHS1), 442 (HLHS2), and 396 (HLHS3) cells from 3 differentiations per line. *P<0.05, **P<0.01, ***P<0.001 compared with CTR (1-way ANOVA). C, Representative immunofluorescence of ISL1, NKX2-5, and TBX5 in control CPs (CTR3) at day 3. Four ISL1/NKX2-5 expression patterns are highlighted: ISL1low/NKX2-5low (dotted arrows), ISL1high/NKX2-5high (arrows), ISL1high/NKX2-5low (asterisks), and ISL1low/NKX2-5high (arrowheads). Scale bar, 20 µm. D, Distribution of cells with ISL1/NKX2-5 expression patterns from (C) in HLHS and control CPs at day 3. Data are mean±SEM; 369 (CTR), 347 (HLHS1), 322 (HLHS2), 357 (HLHS3) cells from 3 differentiations per line. *P<0.05, ***P<0.001 compared with CTR (1-way ANOVA). E, Percentage of ISL1low/NKX2-5high cells expressing TBX5 in HLHS and control CPs at day 3. Data are mean±SEM; 114 (CTR), 70 (HLHS1), 182 (HLHS2), and 123 (HLHS3) cells from 3 differentiations per line. ***P<0.001 compared with CTR (1-way ANOVA). F, Quantification of EdU+ cells in HLHS and control CP subpopulations at day 3. Data are mean±SEM; 369 (CTR), 347 (HLHS1), 322 (HLHS2), 357 (HLHS3) cells from 3 differentiations per line. *P<0.05, **P<0.005, ***P<0.001 compared with CTR (1-way ANOVA). G, Western blot of LC3 and p62 in HLHS and control CPs at day 3 with and without starvation or brefeldin-A. For detection of LC3, all 3 conditions were carried out in presence of chloroquine. Data are mean±SEM; 2 to 3 differentiations per line. *P<0.05, **P<0.01, ***P<0.001 compared with CTR (1-way ANOVA). H and I, Expression analysis of ATF4 and its downstream targets ATG5 and CHOP in HLHS and control CPs at day 3 after treatment with brefeldin-A alone (H) or in combination with the PERK activator CCT020312 (I). Shown are expression levels relative to controls. Data are mean±SEM; 2 to 4 differentiations per line. *P<0.05, **P<0.01, ***P<0.001 compared with CTR (1-way ANOVA). J, Western blot of p62 in HLHS and control CPs at day 3 after treatment with brefeldin-A and CCT020312. Data are mean±SEM; 3 to 6 differentiations per line. K, Propidium iodide staining–based quantification of cells in G1 phase in HLHS and control CPs at day 2 (left) and TBX5 expression by qRT-PCR at day 3 (right) after 6-hour treatment of HLHS cells with CCT020312 at day 1.5. Data are mean±SEM; 2 to 3 differentiations per line, N≥20 000 cells per sample in left panel. **P<0.01, ***P<0.001 compared with own basal (1-way ANOVA).
Figure 5.
Figure 5.
Single-cell RNA sequencing of induced pluripotent stem cell–derived cardiomyocytes reveals defects in cardiac lineage segregation and maturation in hypoplastic left heart syndrome. A, t-Distributed stochastic neighbor embedding plot of all hypoplastic left heart syndrome (HLHS) and control (CTR) cell populations captured at day 14 colored by cluster identity (top) and genotype (bottom). Data are from 2 control (CTR2 and CTR3) and 2 HLHS (HLHS2 and HLHS3) lines. B, Heatmap showing Z score scaled average expression levels of the top 10 differentially expressed genes for each cellular cluster. C, Expression of selected genes marking subpopulations on t-distributed stochastic neighbor embedding plot. Single gene panels: red and gray indicate high and low expression, respectively. Signature panels: color key indicates cells matching with the gene signatures tested (see Expanded Methods in the Data Supplement). D, Violin plots of selected differentially expressed genes between CTR and HLHS cells. All genes represented have P<0.05. E, Branching analysis of HLHS and CTR cardiomyocytes at day 14 together with cardiomyocytes at day 5 and day 14 colored by genotype and estimated pseudotime along the inferred cell trajectory (inset). Pseudotime dynamics of early (KRT19) and mature (PLN) cardiomyocyte genes in dependence on inferred cell identity. A, atria; VC, ventricular chamber. AVC indicates atrioventricular canal; CM, cardiomyocyte; CP, cardiac progenitor; LV, left ventricle; OFT, outflow tract; and RV, right ventricle.
Figure 6.
Figure 6.
Three-dimensional culture of induced pluripotent stem cell–derived cardiomyocytes under electromechanical stress reveals hypoplastic left heart syndrome–related functional abnormalities. A, Schematic of the experimental setup for 3D culture of human induced pluripotent stem cell–derived cardiomyocytes (hiPSC-CM) within decellularized heart patches kept in biomimetic chambers providing mechanical load and electric stimulation while allowing continuous monitoring of force development. All measurements were done in patches generated from 2 control and 3 hypoplastic left heart syndrome (HLHS) lines. Unless otherwise illustrated, results from different control and HLHS lines have been pooled. B and C, Representative plots (B) and statistical analysis (C) of contractile force in HLHS and control patches over 24 days of culture. In (C), data are mean±SEM of serial measurements at the indicated days; n=8 (CTR), n=3 (HLHS1 and HLHS2), n=6 (HLHS3) patches. *P<0.05, **P<0.01 compared with CTR (2-way repeated-measures analysis of variance). D, Representative traces of contraction force at increasing stimulation frequencies in 1 control and 1 HLHS line from an experiment aimed at assessing the force–frequency relationship (FFR) and the paceability at different stimulation frequencies. Stimulation pulses are indicated as vertical bars above the respective tracing. E, Percentage of patches responding to stimulation at indicated pacing frequencies; n=6 (CTR) and n=9 (HLHS). *P<0.05, **P<0.01 compared with CTR at the same day and frequency (Fisher’s exact test). F, FFR, depicted as the developed force (normalized to the mean force developed by CTR patches at day 7) as a function of the beat-to-beat interval (depicted on a logarithmic scale). Serial FFR values obtained from HLHS (n=11) and control (n=8) patches at indicated time points are shown. Data are mean±SEM. *P<0.05, **P<0.01, ***P<0.001 compared with CTR at day 7 at the same beat-to-beat interval (mixed effects model). G, Representative images of Fluo-4-based intracellular calcium transients from single control and HLHS cardiomyocytes within the patch at increasing pacing rates. Vertical bars over the tracings represent the stimulation pulses. H and I, The left graph shows the overall percentage of paceable cardiomyocytes within control and HLHS patches at day 12 (H) and day 24 (I) of 3D culture. The right graph shows, only considering cells that were paceable with at least 1 of the applied pacing rates, the percentage of cells responding at the indicated frequencies at day 12 (H) and day 24 (I). Data are mean±SEM; n=6 (CTR) and n=9 (HLHS) patches; left panels: n=183 and 156 (CTR), n=466 and 70 (HLHS) cells in (H) and (I), respectively; right panels: N≥67 and 90 (CTR), N≥21 and 17 (HLHS) cells for each frequency in (H) and (I), respectively. *P<0.05, **P<0.01, ***P<0.001 compared with CTR (Mann-Whitney test for left panels and 2-way analysis of variance for right panels). J, Amplitude of the systolic calcium transients plotted as a function of the stimulation frequency for cardiomyocytes within control (n=6) and HLHS (n=9) patches at day 12 and day 24 of 3D culture; N≥65 and 81 (CTR), N≥3 and 35 (HLHS) cells for each frequency at day 12 and day 24, respectively. Data are mean±SEM. **P<0.01, ***P<0.001 compared with CTR (2-way analysis of variance). K, Diastolic calcium level (expressed as ratio of the diastolic Fluo-4 intensity at the indicated pacing frequency [F] and the basal Fluo-4 intensity at the beginning of the experiment [F0]) of single cardiomyocytes in day 24 control (n=6) and HLHS (n=9) patches at 0.5 Hz and 1.5 Hz pacing rates; N=91 and 83 (CTR), N=70 and 44 (HLHS) cells at 0.5 Hz and 1.5 Hz, respectively. Data are mean±SEM. ***P<0.001 (Mann-Whitney test). L, Expression level of key genes for electromechanical coupling (black) and Ca2+ homeostasis (red) in cardiomyocytes isolated from HLHS and control 3D patches at day 12. Data are log2 mean fold changes relative to controls; n=3 patches per line. ECM indicates extracellular matrix; and NHP, nonhuman primate.
Figure 7.
Figure 7.
Aberrant apoptosis, multinucleation, and maturation of hypoplastic left heart syndrome cardiomyocytes in 3D biomimetic culture. All measurements were done in patches generated from 2 control and 3 hypoplastic left heart syndrome (HLHS) lines. Results from the 2 different controls have been pooled. A, Representative fluorescence images of day 24 control and HLHS patches after immunostaining for activated caspase 3 (ClCasp3) in conjunction with TUNEL labeling. Phalloidin (Pha) marks F-actin and distinguishes cardiomyocytes. Scale bar, 10 µm. Bar graph shows the statistical evaluation of day 12 and day 24. Data are mean±SEM; n=8 (control [CTR], N=226 cells) and n=4 (each HLHS line, N≥200 cells per line) patches at day 12; n=7 (CTR, N=534) and n=3 (each HLHS line, N≥434 cells per line) patches at day 24. **P<0.01, ***P<0.001 compared with CTR (1-way analysis of variance [ANOVA]). B, Representative immunostaining for activated caspase 3 (ClCasp3) and phosphorylated P53 (phP53) in day 24 control and HLHS patches. Scale bar, 10 µm. Bar graph illustrates the percentages of cardiomyocytes (identified by Pha) expressing one or both markers. Data are mean±SEM, n=10 (CTR, N=652 cells), n=6 (HLHS1, N=572 cells), n=5 (HLHS2, N=470 cells), and n=5 (HLHS3, N=314 cells) patches. *P<0.05, **P<0.01, ***P<0.001 compared with CTR (1-way ANOVA). C, Representative fluorescence images of cardiomyocytes (identified by Pha) after plasmamembrane (CellBrite), TUNEL, and DNA labeling within control and HLHS patches at day 24. Scale bar, 10 µm. D, Bar graphs showing the percentage of cardiomyocytes with 1 (1n), 2 (2n), 3 (3n), and 4 (4n) nuclei in the different cell lines at day 12 and day 24. Data are mean±SEM; n=6 (CTR, N=340 cells) and n=3 (each HLHS line, N≥182 cells per line) patches at day 12; n=6 (CTR, N=341) and n=3 (each HLHS line, N≥147 cells per line) patches at day 24. *P<0.05, **P<0.01, ***P<0.001 compared with CTR (1-way ANOVA). E, Bar graphs showing the percentage of cardiomyocytes positive for phosphorylated histone 3 (PH3) and Ki67 at day 12 and day 24. Data are mean±SEM; n=7 (CTR, N=528 cells), n=7 (HLHS1, N=698 cells), n=5 (HLHS2, N=463), and n=5 (HLHS3, N=668) patches at day 12; n=7 (CTR, N=673 cells), n=7 (HLHS1, N=682 cells), n=5 (HLHS2, N=486), and n=5 (HLHS3, N=485) patches at day 24. *P<0.05, **P<0.01, ***P<0.001 compared with CTR (1-way ANOVA). F, Bar graph showing the percentage of nuclei positive for PH3 and Ki67 in mono-, bi-, tri-, and tetranucleated cardiomyocytes at day 24. Data are mean±SEM; n=3 patches per line; N=331 (CTR), N=258 (HLHS1), N=228 (HLHS2), and N=240 (HLHS3) cells. *P<0.05, **P<0.01, ***P<0.001 compared with CTR (1-way ANOVA). G, Bar graph showing the percentage of nuclei positive for ClCasp3 and phP53 in mono-, bi-, tri-, and tetranucleated cardiomyocytes at day 24. Data are mean±SEM; n=7 (CTR) and n=3 (each HLHS line) patches; N=401 (CTR), N=194 (HLHS1), N=175 (HLHS2), and N=237 (HLHS3) cells. *P<0.05, **P<0.01, ***P<0.001 compared with CTR (1-way ANOVA). H, Left, representative immunostains for MLC2a and MLC2v in control and HLHS patches. Scale bar, 10 µm. Right, bar graph shows statistical evaluation. Data are mean±SEM, n=8 (CTR, N=951 cells) and n=4 (each HLHS line, N≥428 cells per line) patches at day 12; n=8 (CTR, N=949) and n=4 (each HLHS line, N≥442 cells per line) patches at day 24. **P<0.01, ***P<0.001 compared with CTR (1-way ANOVA). I, Scheme depicting the identified steps during cardiac development at which HLHS-related abnormalities interfere with normal development and contribute to the complex CHD phenotype. CM indicates cardiomyocyte; CP, cardiac progenitor; FHF, first heart field; PSC, pluripotent stem cell; SHF, second heart field; and UPR, unfolded protein response.

References

    1. Lev M. Pathologic anatomy and interrelationship of hypoplasia of the aortic tract complexes. Lab Invest. 1952;1:61–70 - PubMed
    1. Noonan JA, Nadas AS. The hypoplastic left heart syndrome: an analysis of 101 cases. Pediatr Clin North Am. 1958;5:1029–1056. doi: 10.1016/s0031-3955(16)30727-1 - PubMed
    1. Anderson RH, Spicer DE, Crucean A. Clarification of the definition of hypoplastic left heart syndrome. Nat Rev Cardiol. 2021;18:147–148. doi: 10.1038/s41569-020-00500-5 - PubMed
    1. Hinton RB, Jr, Martin LJ, Tabangin ME, Mazwi ML, Cripe LH, Benson DW. Hypoplastic left heart syndrome is heritable. J Am Coll Cardiol. 2007;50:1590–1595. doi: 10.1016/j.jacc.2007.07.021 - PubMed
    1. Øyen N, Poulsen G, Boyd HA, Wohlfahrt J, Jensen PK, Melbye M. Recurrence of congenital heart defects in families. Circulation. 2009;120:295–301. doi: 10.1161/CIRCULATIONAHA.109.857987 - PubMed

Publication types

MeSH terms