An official website of the United States government
The .gov means it’s official.
Federal government websites often end in .gov or .mil. Before
sharing sensitive information, make sure you’re on a federal
government site.
The site is secure.
The https:// ensures that you are connecting to the
official website and that any information you provide is encrypted
and transmitted securely.
2 Department of Hematology, Hemostaseology, Oncology and Stem Cell Transplantation, and.
3 Institute of Experimental Hematology, Hannover Medical School, Hannover, Germany.
4 Max-Planck-Institute of Biochemistry, Munich, Germany.
5 Leibniz Institute on Aging, Fritz-Lipmann Institute (FLI), Jena, Germany.
6 Department of Internal Medicine III, University Hospital Ulm, Ulm, Germany.
7 Department of Pediatric Oncology, Dana Farber Cancer Institute, Harvard University, Boston, MA.
8 Department of Oncology, Hematology, Immunology, and Rheumatology, University Hospital Tübingen, Tübingen, Germany.
9 Hematology, Oncology and Tumor Immunology, Charité University Medicine, Berlin, Germany.
10 Institute for Cancer and Genomic Sciences, University of Birmingham, Birmingham, United Kingdom.
11 State Key Laboratory of Medical Genomics, Shanghai Institute of Hematology, National Research Center for Translational Medicine, Ruijin Hospital, affiliated with Shanghai Jiao Tong University School of Medicine, Shanghai, China.
12 Murdoch Children's Research Institute, The Royal Children's Hospital, Parkville, VIC, Australia.
13 Department of Paediatrics, Faculty of Medicine, Dentistry and Health Sciences, University of Melbourne Parkville, VIC, Australia.
14 Josep Carreras Leukemia Research Institute, Badalona, Spain.
15 Institute of Biochemistry and Biophysics, Center for Molecular Biomedicine, Friedrich-Schiller University, Jena, Germany.
16 University Hospital Jena, Orthopaedic Department at Campus Eisenberg, Eisenberg, Germany.
17 Institute for Cell Biology and Biochemistry, Otto-von-Guericke University, Magdeburg, Germany.
18 Innere Medizin 2, Hämatologie und Onkologie, Universitätsklinikum Jena, Germany.
19 Department of Systems Biology, Beckman Research Institute of City of Hope, Duarte, CA.
20 Northern Institute for Cancer Research, University of Newcastle, Newcastle upon Tyne, United Kingdom.
21 Princess Maxima Center for Pediatric Oncology, Utrecht, The Netherlands; and.
22 QIMR Berghofer Medical Research Institute, Brisbane, QLD, Australia.
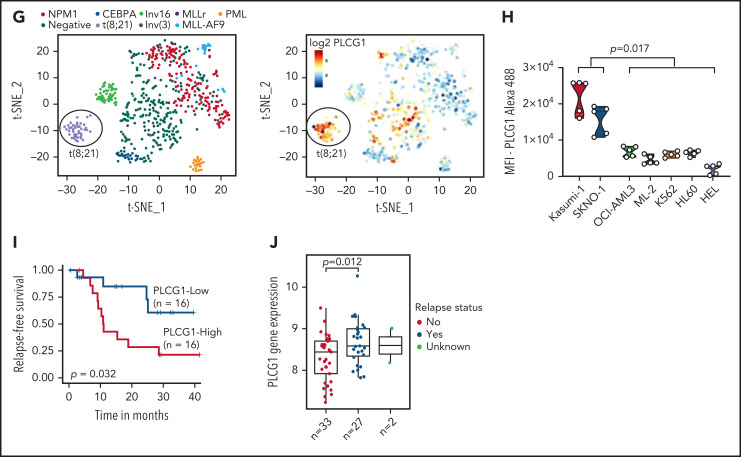
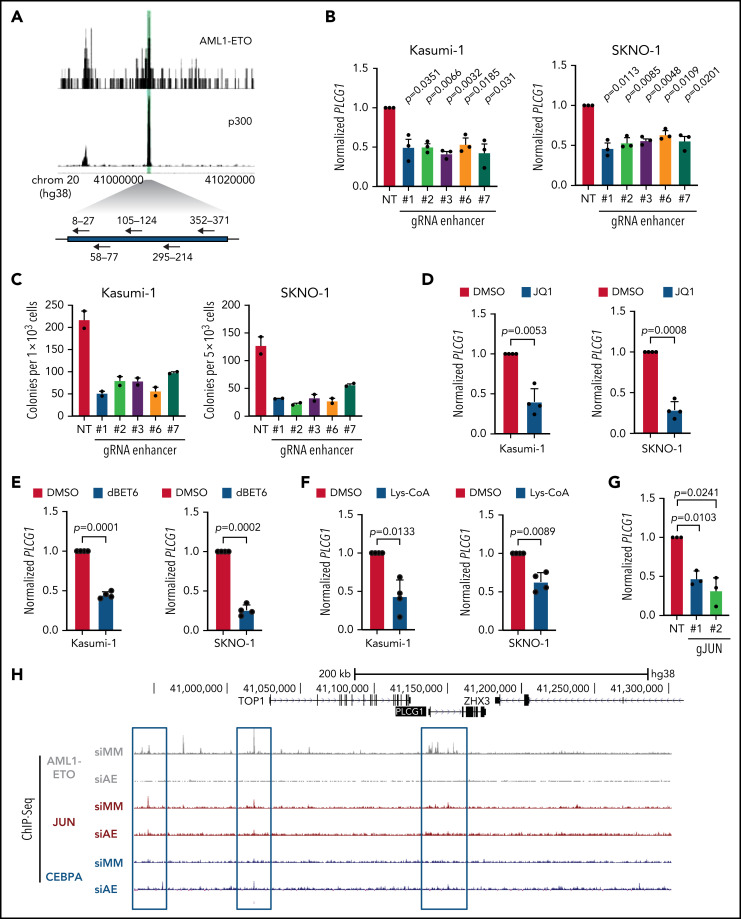
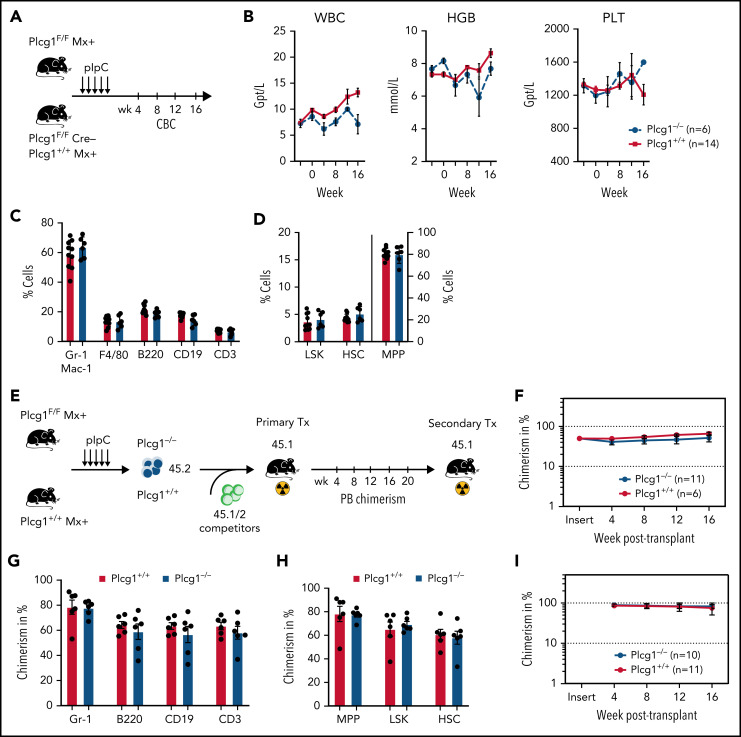
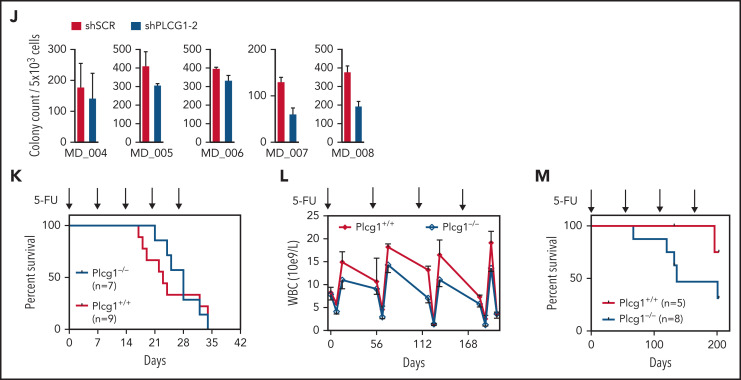
In an effort to identify novel drugs targeting fusion-oncogene-induced acute myeloid leukemia (AML), we performed high-resolution proteomic analysis. In AML1-ETO (AE)-driven AML, we uncovered a deregulation of phospholipase C (PLC) signaling. We identified PLCgamma 1 (PLCG1) as a specific target of the AE fusion protein that is induced after AE binding to intergenic regulatory DNA elements. Genetic inactivation of PLCG1 in murine and human AML inhibited AML1-ETO dependent self-renewal programs, leukemic proliferation, and leukemia maintenance in vivo. In contrast, PLCG1 was dispensable for normal hematopoietic stem and progenitor cell function. These findings are extended to and confirmed by pharmacologic perturbation of Ca++-signaling in AML1-ETO AML cells, indicating that the PLCG1 pathway poses an important therapeutic target for AML1-ETO+ leukemic stem cells.
Phospholipase C and Ca ++ signaling is enriched in AML1-ETO transformed LSCs. (A)…
Figure 1.
Phospholipase C and Ca++ signaling is enriched in AML1-ETO transformed LSCs. (A) Outline of the proteomic workflow. (B) Gene set enrichment analysis (GSEA) on murine MLL-AF9 (MLL9) and AML1-ETO (AE) LSCs (n = 4 per genotype). (C) Ingenuity pathway analysis (IPA) on murine AML1-ETO transformed LSC compared with MLL-AF9 positive controls. (D) Schematic of proteome analysis of primary human AML1-ETO/t(8;21) AML (n = 4 per genotype). (E) Molecular analysis of AML patient samples applied for proteomic analysis. (F) GSEA on human t(8;21) AML compared with non-t(8;21) controls. (G) t-SNE plot displaying the gene expression landscape of 641 AML patients of the HOVON cohort with an overlay of different AML subtypes (left) with absolute PLCG1 expression values (right). (H) PLCG1 protein expression in AML1-ETO positive (Kasumi-1, SKNO-1) vs AML1-ETO− human AML cell lines analyzed by intracellular flow cytometry (n = 5 per cell line; 1-way analysis of variance [ANOVA]). (I) Relapse-free survival (RFS, B) in patients with t(8;21) AML according to the expression level of PLCG1. Survival curves were estimated with the Kaplan-Meier method and compared using a log-rank test. (J) Scatterplot depicting PLCG1 expression levels in t(8;21) patients according to their relapse status (no relapse, n = 33; relapse, n = 27; unknown, n = 2).
Figure 1.
Phospholipase C and Ca ++ …
Figure 1.
Phospholipase C and Ca ++ signaling is enriched in AML1-ETO transformed LSCs. (A)…
Figure 1.
Phospholipase C and Ca++ signaling is enriched in AML1-ETO transformed LSCs. (A) Outline of the proteomic workflow. (B) Gene set enrichment analysis (GSEA) on murine MLL-AF9 (MLL9) and AML1-ETO (AE) LSCs (n = 4 per genotype). (C) Ingenuity pathway analysis (IPA) on murine AML1-ETO transformed LSC compared with MLL-AF9 positive controls. (D) Schematic of proteome analysis of primary human AML1-ETO/t(8;21) AML (n = 4 per genotype). (E) Molecular analysis of AML patient samples applied for proteomic analysis. (F) GSEA on human t(8;21) AML compared with non-t(8;21) controls. (G) t-SNE plot displaying the gene expression landscape of 641 AML patients of the HOVON cohort with an overlay of different AML subtypes (left) with absolute PLCG1 expression values (right). (H) PLCG1 protein expression in AML1-ETO positive (Kasumi-1, SKNO-1) vs AML1-ETO− human AML cell lines analyzed by intracellular flow cytometry (n = 5 per cell line; 1-way analysis of variance [ANOVA]). (I) Relapse-free survival (RFS, B) in patients with t(8;21) AML according to the expression level of PLCG1. Survival curves were estimated with the Kaplan-Meier method and compared using a log-rank test. (J) Scatterplot depicting PLCG1 expression levels in t(8;21) patients according to their relapse status (no relapse, n = 33; relapse, n = 27; unknown, n = 2).
Figure 2.
PLCG1 is a target of…
Figure 2.
PLCG1 is a target of AML1-ETO. (A) AML1 ChIP-sequencing analysis on normal CD34 …
Figure 2.
PLCG1 is a target of AML1-ETO. (A) AML1 ChIP-sequencing analysis on normal CD34+ cells, (BCR-ABL+) K562, and (AML1-ETO+) SKNO-1 cells (https://genome.ucsc.edu). (B) Screenshot displaying changes in PLCG1 transcript levels based on RNA-sequencing (RNA-Seq, blue). Binding patterns of AML1-ETO (AE), AML1, JunD, CEBPa, LDB1, LMO2, PU.1, RNA-polymerase II (POLII), H3K27ac, and DHS at the PLCG1 locus in Kasumi-1 or patient-derived cells based on ChIP-sequencing and DNaseI-sequencing as well as conservation at the PLCG1 locus as aligned reads. Upper lines show promoter-Capture Hi-C (CHi-C) data generated in Kasumi-1 or patient-derived cells identifying DHSs interacting with the PLCG1 promoter. All data following inactivation of AML1-ETO (siAE; shAE) compared with nontargeting control (siMM; CTRL). (C) Western blot analysis (left) and mRNA expression (right) in SKNO-1_Cas9-Blast cells (top) following CRISPR/Cas9 knockout using ETO-specific gRNA or a nontargeting control (sgLuc) and in Kasumi-1 cells (bottom) transduced with shRNA targeting AML1-ETO (AE) or empty vector control (shEV). n = 3 independent experiments; representative blot images are shown. (D) mRNA expression of PLCG1 (top) and AML1-ETO (bottom) in human embryonic stem (ES) cell-derived definitive hematopoietic progenitors expressing a Dox-inducible AML1-ETO fusion (data from 3 independent ES cell clones are shown). (E) Human ES-cell derived definitive hematopoietic progenitors expressing a Dox-inducible AML1-ETO fusion. ChIP-seq analysis displaying AML1-ETO binding at the PLCG1 locus (blue) without Dox (0 Dox) and after Dox treatment (5 ng/mL; 5 Dox) for 24 hours. Chromatin accessibility at the PLCG1 locus (green) after Dox treatment as indicated by ATAC-seq.
Figure 2.
PLCG1 is a target of…
Figure 2.
PLCG1 is a target of AML1-ETO. (A) AML1 ChIP-sequencing analysis on normal CD34 …
Figure 2.
PLCG1 is a target of AML1-ETO. (A) AML1 ChIP-sequencing analysis on normal CD34+ cells, (BCR-ABL+) K562, and (AML1-ETO+) SKNO-1 cells (https://genome.ucsc.edu). (B) Screenshot displaying changes in PLCG1 transcript levels based on RNA-sequencing (RNA-Seq, blue). Binding patterns of AML1-ETO (AE), AML1, JunD, CEBPa, LDB1, LMO2, PU.1, RNA-polymerase II (POLII), H3K27ac, and DHS at the PLCG1 locus in Kasumi-1 or patient-derived cells based on ChIP-sequencing and DNaseI-sequencing as well as conservation at the PLCG1 locus as aligned reads. Upper lines show promoter-Capture Hi-C (CHi-C) data generated in Kasumi-1 or patient-derived cells identifying DHSs interacting with the PLCG1 promoter. All data following inactivation of AML1-ETO (siAE; shAE) compared with nontargeting control (siMM; CTRL). (C) Western blot analysis (left) and mRNA expression (right) in SKNO-1_Cas9-Blast cells (top) following CRISPR/Cas9 knockout using ETO-specific gRNA or a nontargeting control (sgLuc) and in Kasumi-1 cells (bottom) transduced with shRNA targeting AML1-ETO (AE) or empty vector control (shEV). n = 3 independent experiments; representative blot images are shown. (D) mRNA expression of PLCG1 (top) and AML1-ETO (bottom) in human embryonic stem (ES) cell-derived definitive hematopoietic progenitors expressing a Dox-inducible AML1-ETO fusion (data from 3 independent ES cell clones are shown). (E) Human ES-cell derived definitive hematopoietic progenitors expressing a Dox-inducible AML1-ETO fusion. ChIP-seq analysis displaying AML1-ETO binding at the PLCG1 locus (blue) without Dox (0 Dox) and after Dox treatment (5 ng/mL; 5 Dox) for 24 hours. Chromatin accessibility at the PLCG1 locus (green) after Dox treatment as indicated by ATAC-seq.
Figure 3.
An intergenic AML1-ETO binding non-coding…
Figure 3.
An intergenic AML1-ETO binding non-coding element is essential for PLCG1 expression. (A) Schematic…
Figure 3.
An intergenic AML1-ETO binding non-coding element is essential for PLCG1 expression. (A) Schematic model of the 500-bp intergenic element characterized by p300 and AML1-ETO binding sites (green) in Kasumi-1 cells. sgRNAs targeting this region are shown with arrows. (B) PLCG1 mRNA expression in Kasumi_Cas9-EGFP cells (left) and SKNO-1_Cas9-Blast cells (right) following CRISPR/Cas9-induced knockout of the 500-bp intergenic region using specific gRNAs or a nontargeting control (NT). n = 3 independent experiments, in duplicate; paired Student t test. (C) Colony-forming assay of Kasumi-1_Cas9_EGFP cells (left) and SKNO-1_Cas9-Blast cells (right) (day 14) following genetic inactivation of the 500-bp enhancer region using specific sgRNAs compared with nontargeting control (NT); n = 2 independent experiments. (D-F) mRNA expression of PLCG1 (normalized to Beta2-microglobulin) in Kasumi-1 and SKNO-1 cells after treatment with (D) JQ1 (1 μM, 24 hours), (E) dBET6 (1 μM, 24 hours), and (F) Lys-CoA (1 μM, 24 hours) compared with diluent control (DMSO). n = 4 independent experiments, in duplicate; paired t test. (G) mRNA expression of PLCG1 in Kasumi-1 cells after knockout of JUN using CRISPR/Cas9 (gJUN #1 and #2) or a nontargeting control (NT). n = 3 independent experiments, in triplicate; paired t test. (H) Screenshot displaying binding patterns of AML1-ETO, JUN, and CEBPa at the PLCG1 locus in Kasumi-1 cells based on ChIP-seq. All data following inactivation of AML1-ETO (siAE) compared with nontargeting control (siMM). Relevant peaks are highlighted with boxes.
Figure 4.
AML1-ETO–induced cellular functions depend on…
Figure 4.
AML1-ETO–induced cellular functions depend on PLCG1. Proliferation assayed by cell counting after trypan…
Figure 4.
AML1-ETO–induced cellular functions depend on PLCG1. Proliferation assayed by cell counting after trypan blue exclusion for (A) SKNO-1_Cas9-Blast cells transduced with gRNAs targeting PLCG1, RPA3, or a nontargeting control (gLuc) and (B) Kasumi-1 cells transduced with shRNAs targeting PLCG1or a nontargeting control (shSCR). n = 4-5 independent experiments, 1-way ANOVA. Representative western blot images confirming PLCG1 depletion are shown (day 5 or 7 postinfection). Colony-forming unit analysis in (C) SKNO-1_Cas9-Blast and (D) Kasumi-1 cells on day 14. n = 4-6 independent experiments; paired Student t test. (E) Kaplan-Meier survival curves of humanized NSGS recipient mice, n = 14 mice for shPLCG1-1 or shPLCG1-2 vs n = 10 mice for nontargeting control (shSCR); shown are 3 independent cohorts, Mantel-Cox test. (F-G) Quantitative analysis (left) and representative histograms (right) after flow-cytometric evaluation of CD14 and CD13 expression on (F) Kasumi-1 cells transduced with shRNAs targeting PLCG1or a nontargeting control (shSCR) and (G) SKNO-1_Cas9-Blast cells transduced with gRNAs targeting PLCG1 or a nontargeting control (gLuc). n = 4 independent experiments; paired t test. (H) GSEA of expression changes in 160 hematopoiesis and leukemia-associated gene sets in Kasumi-1 cells transduced with a PLCG1 shRNA (sh1-1) against a nontargeting control (n = 4 for each group). Plotted are normalized enrichment scores (NES) against the log10 false discovery rate (FDR). FDR <0.1 is indicated by the vertical line. (I-J) GSEA showing upregulation of genes bound and repressed by the AML1-ETO fusion protein in Kasumi-1 cells transduced with a PLCG1 shRNA against a nontargeting control. (K) GSEA of expression changes in 160 hematopoiesis and leukemia-associated gene sets in SKNO-1_Cas9-Blast cells transduced with a PLCG1 sgRNA against a nontargeting control (n = 4 for each group). Plotted are normalized enrichment scores (NES) against the log10 FDR. FDR <0.1 is indicated by the vertical line.
Figure 4.
AML1-ETO–induced cellular functions depend on…
Figure 4.
AML1-ETO–induced cellular functions depend on PLCG1. Proliferation assayed by cell counting after trypan…
Figure 4.
AML1-ETO–induced cellular functions depend on PLCG1. Proliferation assayed by cell counting after trypan blue exclusion for (A) SKNO-1_Cas9-Blast cells transduced with gRNAs targeting PLCG1, RPA3, or a nontargeting control (gLuc) and (B) Kasumi-1 cells transduced with shRNAs targeting PLCG1or a nontargeting control (shSCR). n = 4-5 independent experiments, 1-way ANOVA. Representative western blot images confirming PLCG1 depletion are shown (day 5 or 7 postinfection). Colony-forming unit analysis in (C) SKNO-1_Cas9-Blast and (D) Kasumi-1 cells on day 14. n = 4-6 independent experiments; paired Student t test. (E) Kaplan-Meier survival curves of humanized NSGS recipient mice, n = 14 mice for shPLCG1-1 or shPLCG1-2 vs n = 10 mice for nontargeting control (shSCR); shown are 3 independent cohorts, Mantel-Cox test. (F-G) Quantitative analysis (left) and representative histograms (right) after flow-cytometric evaluation of CD14 and CD13 expression on (F) Kasumi-1 cells transduced with shRNAs targeting PLCG1or a nontargeting control (shSCR) and (G) SKNO-1_Cas9-Blast cells transduced with gRNAs targeting PLCG1 or a nontargeting control (gLuc). n = 4 independent experiments; paired t test. (H) GSEA of expression changes in 160 hematopoiesis and leukemia-associated gene sets in Kasumi-1 cells transduced with a PLCG1 shRNA (sh1-1) against a nontargeting control (n = 4 for each group). Plotted are normalized enrichment scores (NES) against the log10 false discovery rate (FDR). FDR <0.1 is indicated by the vertical line. (I-J) GSEA showing upregulation of genes bound and repressed by the AML1-ETO fusion protein in Kasumi-1 cells transduced with a PLCG1 shRNA against a nontargeting control. (K) GSEA of expression changes in 160 hematopoiesis and leukemia-associated gene sets in SKNO-1_Cas9-Blast cells transduced with a PLCG1 sgRNA against a nontargeting control (n = 4 for each group). Plotted are normalized enrichment scores (NES) against the log10 FDR. FDR <0.1 is indicated by the vertical line.
Figure 5.
AML1-ETO transformed hematopoietic stem cells…
Figure 5.
AML1-ETO transformed hematopoietic stem cells depend on PLCG1. (A) Targeting strategy for the…
Figure 5.
AML1-ETO transformed hematopoietic stem cells depend on PLCG1. (A) Targeting strategy for the conditional Plcg1 knockout mouse model. Exons 3 to 5 are flanked with LoxP sites (red triangles) to facilitate tissue-specific deletion. FRT sites, green triangles. (B-F) GFP+Kit+ BM cells of Plcg1+/+ and Plcg1F/F AML1-ETO/KRAS (AE/K) or MLL-AF9 (MA9) primary recipients were sorted and retrovirally infected with a Cre-recombinase (MSCV-Cre-puro), followed by 24 hours of puromycin selection. (C) Serial replating in methylcellulose. Colony counts per plating over 6 weeks are depicted for AML1-ETO/KRAS. Representative pictures of colonies (second plating). n = 3 independent experiments, in duplicate; paired t test. (D) Kaplan-Meier survival curves of recipient animals of AE/K transformed Plcg1+/+ (n = 16 mice) vs Plcg1−/− (n = 7 mice) LSCs, Mantel-Cox test. (E) Histologic analysis of liver, lung, and spleen morphology in Plcg1+/+ or Plcg1−/− AML1-ETO9a/KRAS (AE/K) transformed secondary recipients. Representative images are shown. Scale bars, 100 μm. (F) Serial replating in methylcellulose. Colony counts per plating over 6 weeks are depicted for MLL-AF9. Representative pictures of colonies (second plating). n = 3 independent experiments, in duplicate; paired t test. (G) Heatmap of differentially expressed genes in AE/KRAS transformed Plcg1+/+ (n = 2) vs Plcg1−/− (n = 3) LSCs 48 hours after genetic deletion of Plcg1. Red zones represent higher gene expression (upregulation); blue zones represent lower gene expression (downregulation). (H) GSEA indicating loss of AML1-ETO (RUNX1-RUNX1T1) target genes (top) and negative enrichment of PLCG1 target genes (bottom) in the AML1-ETO knockdown signature of Kasumi-1 cells. AE, AML1-ETO; k/d, knockdown; MM, mismatch control; NES, normalized enrichment score; NT, nontargeting control. (I) Schematic representation of the experimental setup to study the effects of Plcg1 inactivation on AML1-ETO/KRAS (AE/K)-transformed LSCs in vivo. (J) Analysis of sublethally (7 Gy) irradiated 6- to 8-week-old primary recipients of AE/K-transformed Plcg1+/+ and Plcg1F/F LSK cells. pIpC injections were administered intraperitoneally as indicated by arrows. Immunophenotyping of (GFP+) leukemia cells in peripheral blood of primary recipient mice. Plcg1+/+ (n = 9 mice) vs Plcg1−/− (n = 9 mice). (K) Survival of primary recipient mice. Plcg1+/+ (n = 12 mice) vs Plcg1−/− (n = 12 mice). Mantel-Cox test. (L) Immunophenotyping of GFP+ bone marrow (BM) LSKs (Plcg1+/+ n = 8 mice, Plcg1−/− n = 9 mice; Mann-Whitney U test. (M) Cytospins (May-Grünwald/Giemsa staining) of GFP+ LSK cells following short-term (24-hour) culture ex vivo. (N) Cell-cycle analysis (Ki67/Hoechst staining) of GFP+ LSK cells from primary recipient mice following genetic inactivation of Plcg1 in vivo (Plcg1+/+, n = 6 mice vs Plcg1−/−, n = 6 mice; Mann-Whitney U test). (O) Kaplan-Meier survival curves of secondary recipients of 2 × 10⁶ BM cells from primary Plcg1+/+ (n = 11) and Plcg1−/− (n = 10) recipient mice, Mantel-Cox test. (P) Colony formation of leukemic bone marrow cells derived from patients at primary diagnosis of t(8;21) positive AML (n = 6 individual patients). Colony number following PLCG1 depletion by RNAi (shPLCG1-1 and 1-2) compared with nontargeting control (shSCR).
Figure 5.
AML1-ETO transformed hematopoietic stem cells…
Figure 5.
AML1-ETO transformed hematopoietic stem cells depend on PLCG1. (A) Targeting strategy for the…
Figure 5.
AML1-ETO transformed hematopoietic stem cells depend on PLCG1. (A) Targeting strategy for the conditional Plcg1 knockout mouse model. Exons 3 to 5 are flanked with LoxP sites (red triangles) to facilitate tissue-specific deletion. FRT sites, green triangles. (B-F) GFP+Kit+ BM cells of Plcg1+/+ and Plcg1F/F AML1-ETO/KRAS (AE/K) or MLL-AF9 (MA9) primary recipients were sorted and retrovirally infected with a Cre-recombinase (MSCV-Cre-puro), followed by 24 hours of puromycin selection. (C) Serial replating in methylcellulose. Colony counts per plating over 6 weeks are depicted for AML1-ETO/KRAS. Representative pictures of colonies (second plating). n = 3 independent experiments, in duplicate; paired t test. (D) Kaplan-Meier survival curves of recipient animals of AE/K transformed Plcg1+/+ (n = 16 mice) vs Plcg1−/− (n = 7 mice) LSCs, Mantel-Cox test. (E) Histologic analysis of liver, lung, and spleen morphology in Plcg1+/+ or Plcg1−/− AML1-ETO9a/KRAS (AE/K) transformed secondary recipients. Representative images are shown. Scale bars, 100 μm. (F) Serial replating in methylcellulose. Colony counts per plating over 6 weeks are depicted for MLL-AF9. Representative pictures of colonies (second plating). n = 3 independent experiments, in duplicate; paired t test. (G) Heatmap of differentially expressed genes in AE/KRAS transformed Plcg1+/+ (n = 2) vs Plcg1−/− (n = 3) LSCs 48 hours after genetic deletion of Plcg1. Red zones represent higher gene expression (upregulation); blue zones represent lower gene expression (downregulation). (H) GSEA indicating loss of AML1-ETO (RUNX1-RUNX1T1) target genes (top) and negative enrichment of PLCG1 target genes (bottom) in the AML1-ETO knockdown signature of Kasumi-1 cells. AE, AML1-ETO; k/d, knockdown; MM, mismatch control; NES, normalized enrichment score; NT, nontargeting control. (I) Schematic representation of the experimental setup to study the effects of Plcg1 inactivation on AML1-ETO/KRAS (AE/K)-transformed LSCs in vivo. (J) Analysis of sublethally (7 Gy) irradiated 6- to 8-week-old primary recipients of AE/K-transformed Plcg1+/+ and Plcg1F/F LSK cells. pIpC injections were administered intraperitoneally as indicated by arrows. Immunophenotyping of (GFP+) leukemia cells in peripheral blood of primary recipient mice. Plcg1+/+ (n = 9 mice) vs Plcg1−/− (n = 9 mice). (K) Survival of primary recipient mice. Plcg1+/+ (n = 12 mice) vs Plcg1−/− (n = 12 mice). Mantel-Cox test. (L) Immunophenotyping of GFP+ bone marrow (BM) LSKs (Plcg1+/+ n = 8 mice, Plcg1−/− n = 9 mice; Mann-Whitney U test. (M) Cytospins (May-Grünwald/Giemsa staining) of GFP+ LSK cells following short-term (24-hour) culture ex vivo. (N) Cell-cycle analysis (Ki67/Hoechst staining) of GFP+ LSK cells from primary recipient mice following genetic inactivation of Plcg1 in vivo (Plcg1+/+, n = 6 mice vs Plcg1−/−, n = 6 mice; Mann-Whitney U test). (O) Kaplan-Meier survival curves of secondary recipients of 2 × 10⁶ BM cells from primary Plcg1+/+ (n = 11) and Plcg1−/− (n = 10) recipient mice, Mantel-Cox test. (P) Colony formation of leukemic bone marrow cells derived from patients at primary diagnosis of t(8;21) positive AML (n = 6 individual patients). Colony number following PLCG1 depletion by RNAi (shPLCG1-1 and 1-2) compared with nontargeting control (shSCR).
Figure 6.
PLCG1 is dispensable for normal…
Figure 6.
PLCG1 is dispensable for normal HSC function. (A) Experimental protocol for investigation of…
Figure 6.
PLCG1 is dispensable for normal HSC function. (A) Experimental protocol for investigation of steady-state hematopoiesis. (B) White blood count (WBC), hemoglobin (HGB), and platelets (PLT) following genetic inactivation of Plcg1 (Plcg1−/−, n = 6) for 16 weeks of steady-state hematopoiesis, compared with Plcg1+/+ controls (n = 14). (C) Immunophenotypic quantification of mature myeloid (Gr-1 Mac-1; F4/80), B-lymphoid (B220; CD19), and T-lymphoid (CD3) bone marrow cells (Plcg1+/+, n = 10; Plcg1−/−, n = 6). (D) Immunophenotypic quantification of stem and progenitor cell abundance, specifically of hematopoietic stem cells (HSC: CD150+ CD48− L−S+K+) and multipotent progenitors (MPP: CD150 low, CD48+ L−S+K+) (Plcg1+/+, n = 10; Plcg1−/−, n = 6). (E) Protocol for assessing impact of Plcg1 loss on LT-HSC function by serial transplantation. (F) Peripheral blood chimerism of primary recipient mice (Plcg1+/+, n = 6; Plcg1−/−, n = 11); shown are 2 independent cohorts. (G) Immunophenotypic quantification of mature myeloid (Gr-1), B-lymphoid (B220; CD19), and T-lymphoid (CD3) bone marrow cells (Plcg1+/+, n = 6; Plcg1−/−, n = 6) from primary recipients. (H) Immunophenotypic quantification of stem and progenitor cell abundance, specifically of hematopoietic stem cells (HSC: CD150+ CD48− L−S+K+) and multipotent progenitors (MPP: CD150 low, CD48+ L−S+K+) (Plcg1+/+, n = 6; Plcg1−/−, n = 6). (I) Peripheral blood chimerism of secondary recipient mice (Plcg1+/+, n = 10; Plcg1−/−, n = 11); shown are 2 independent cohorts. (J) Colony count of BM cells derived from healthy donors. Genetic inactivation of PLCG1 by shRNA compared with nontargeting control (shSCR). n = 5, in duplicate. (K) Short-term stress analysis after serial 5-fluorouracil (5-FU) injections; Kaplan-Meier survival curve of Plcg1+/+ (n = 9) and Plcg1−/− (n = 7) mice injected intravenously (i.v.) with 150 mg/kg 5-FU (arrows) every 7 days. (L) Long-term stress analysis by serial 5-FU injections (2 monthly injections IV). Kinetics of hematopoietic recovery as measured by peripheral white blood count of Plcg1−/− (n = 8) and Plcg1+/+ (n = 5) mice during the 2 monthly 5-FU injection schedule. (M) Survival rates of Plcg1−/− (n = 8) and Plcg1+/+ (n = 5) mice during long-term 5-FU treatment.
Figure 6.
PLCG1 is dispensable for normal…
Figure 6.
PLCG1 is dispensable for normal HSC function. (A) Experimental protocol for investigation of…
Figure 6.
PLCG1 is dispensable for normal HSC function. (A) Experimental protocol for investigation of steady-state hematopoiesis. (B) White blood count (WBC), hemoglobin (HGB), and platelets (PLT) following genetic inactivation of Plcg1 (Plcg1−/−, n = 6) for 16 weeks of steady-state hematopoiesis, compared with Plcg1+/+ controls (n = 14). (C) Immunophenotypic quantification of mature myeloid (Gr-1 Mac-1; F4/80), B-lymphoid (B220; CD19), and T-lymphoid (CD3) bone marrow cells (Plcg1+/+, n = 10; Plcg1−/−, n = 6). (D) Immunophenotypic quantification of stem and progenitor cell abundance, specifically of hematopoietic stem cells (HSC: CD150+ CD48− L−S+K+) and multipotent progenitors (MPP: CD150 low, CD48+ L−S+K+) (Plcg1+/+, n = 10; Plcg1−/−, n = 6). (E) Protocol for assessing impact of Plcg1 loss on LT-HSC function by serial transplantation. (F) Peripheral blood chimerism of primary recipient mice (Plcg1+/+, n = 6; Plcg1−/−, n = 11); shown are 2 independent cohorts. (G) Immunophenotypic quantification of mature myeloid (Gr-1), B-lymphoid (B220; CD19), and T-lymphoid (CD3) bone marrow cells (Plcg1+/+, n = 6; Plcg1−/−, n = 6) from primary recipients. (H) Immunophenotypic quantification of stem and progenitor cell abundance, specifically of hematopoietic stem cells (HSC: CD150+ CD48− L−S+K+) and multipotent progenitors (MPP: CD150 low, CD48+ L−S+K+) (Plcg1+/+, n = 6; Plcg1−/−, n = 6). (I) Peripheral blood chimerism of secondary recipient mice (Plcg1+/+, n = 10; Plcg1−/−, n = 11); shown are 2 independent cohorts. (J) Colony count of BM cells derived from healthy donors. Genetic inactivation of PLCG1 by shRNA compared with nontargeting control (shSCR). n = 5, in duplicate. (K) Short-term stress analysis after serial 5-fluorouracil (5-FU) injections; Kaplan-Meier survival curve of Plcg1+/+ (n = 9) and Plcg1−/− (n = 7) mice injected intravenously (i.v.) with 150 mg/kg 5-FU (arrows) every 7 days. (L) Long-term stress analysis by serial 5-FU injections (2 monthly injections IV). Kinetics of hematopoietic recovery as measured by peripheral white blood count of Plcg1−/− (n = 8) and Plcg1+/+ (n = 5) mice during the 2 monthly 5-FU injection schedule. (M) Survival rates of Plcg1−/− (n = 8) and Plcg1+/+ (n = 5) mice during long-term 5-FU treatment.
Figure 7.
Pharmacologic suppression of Ca ++ …
Figure 7.
Pharmacologic suppression of Ca ++ -signaling inhibits AML1-ETO LSC function in vitro and…
Figure 7.
Pharmacologic suppression of Ca++-signaling inhibits AML1-ETO LSC function in vitro and in vivo. (A) Unsupervised hierarchical clustering of significantly downregulated proteins following genetic inactivation of PLCG1 by a specific gRNA in SKNO-1_Cas9-Blast cells. (B) Network map displaying the significantly enriched signaling pathways upon genetic inactivation of PLCG1, annotation from Reactome. The node size and color represent number of proteins participating in each node. (C) Proliferation assayed by cell counting after trypan blue exclusion for Kasumi-1, SKNO-1, HL-60, and OCI-AML3 cells following treatment with the calcineurin inhibitor cyclosporin A (CsA, 5 μM) or diluent control (NaCl 0.9%). n = 4 independent experiments, 1-way ANOVA. (D) Analysis scheme of primary recipient mice following ciclosporin A (CsA) treatment vs diluent control (NaCl 0.9%). (E) Spleen weight of AE/K primary recipient mice; Mann-Whitney U test. (F) Histologic analysis of liver, lung, and spleen morphology after onset of AML in AE/K primary recipient mice treated with CsA or diluent control (NaCl 0.9%). Scale bars, 100 μm. (G) Immunophenotypic analysis of AE/K GFP+ BM LSK cells; Mann-Whitney U test. (H) Kaplan-Meier survival curves of AE/K secondary recipient mice. Irradiated (13 Gy, single dose) 6- to 8-week-old recipients of 2 × 10⁶ bone marrow cells from AE/K CsA (n = 7) or NaCl 0.9% (n = 8) treated primary recipients; Mantel-Cox test. (I) Spleen weight of MA9 primary recipient mice treated with CsA or diluent control (NaCl 0.9%), n.s., not significant. (J) Histologic analysis of liver, lung, and spleen morphology after onset of AML in MA9 primary recipient mice after treatment with CsA or diluent control. Scale bars, 100 μm. (K) Immunophenotypic analysis of GFP+LSK cells in the bone marrow of MA9 primary recipient mice. (L) Survival of MA9-transformed secondary recipient mice. Irradiated (13 Gy, single dose) 6- to 8-week-old recipients of 2 × 10⁶ bone marrow cells from MA9 CsA or NaCl 0.9% treated primary recipient mice (n = 8 CsA; n = 8 NaCl 0.9%), Mantel-Cox test. (M-N) Number of engrafted mice per dilution in the NaCl- vs CsA-treated cohort. LSC frequency was 1/5801 for NaCl-treated recipients (95% confidence interval, 1/2182-15,427) and 1/12,1901 for CsA-treated recipients (95% confidence interval, 1/39,911-372,329), P = .000026 using Poisson analysis; n = 5 mice per dilution and treatment, analysis was performed using ELDA (Extreme Limiting Dilution Assay) software. (O) Colony formation of primary human AE/t(8;21) AML cells (n = 6 individual patients). Colony number per sample following pharmacologic inhibition with CsA (5, 10 μM) compared with diluent control (NaCl 0.9%). (P) Representative pictures of colonies from t(8;21) AML bone marrow cells after pharmacological inhibition with cyclosporin A compared with diluent control (NaCl). Scale bars, 200 μm. (Q) Colony count of BM cells derived from 3 independent healthy donors. Colony number per sample following pharmacologic inhibition with CsA (5 μM) compared with diluent control (NaCl 0.9%). (R) Number of hCD4+ hCD13+ cells per 1 × 10⁶ bone marrow (BM) cells after treatment with CsA (n = 4 mice) compared with diluent control (NaCl 0.9%; n = 4 mice). (S) Pie charts depicting engraftment of t(8;21) AML cells (%) after treatment with CsA or diluent control.
Figure 7.
Pharmacologic suppression of Ca ++ …
Figure 7.
Pharmacologic suppression of Ca ++ -signaling inhibits AML1-ETO LSC function in vitro and…
Figure 7.
Pharmacologic suppression of Ca++-signaling inhibits AML1-ETO LSC function in vitro and in vivo. (A) Unsupervised hierarchical clustering of significantly downregulated proteins following genetic inactivation of PLCG1 by a specific gRNA in SKNO-1_Cas9-Blast cells. (B) Network map displaying the significantly enriched signaling pathways upon genetic inactivation of PLCG1, annotation from Reactome. The node size and color represent number of proteins participating in each node. (C) Proliferation assayed by cell counting after trypan blue exclusion for Kasumi-1, SKNO-1, HL-60, and OCI-AML3 cells following treatment with the calcineurin inhibitor cyclosporin A (CsA, 5 μM) or diluent control (NaCl 0.9%). n = 4 independent experiments, 1-way ANOVA. (D) Analysis scheme of primary recipient mice following ciclosporin A (CsA) treatment vs diluent control (NaCl 0.9%). (E) Spleen weight of AE/K primary recipient mice; Mann-Whitney U test. (F) Histologic analysis of liver, lung, and spleen morphology after onset of AML in AE/K primary recipient mice treated with CsA or diluent control (NaCl 0.9%). Scale bars, 100 μm. (G) Immunophenotypic analysis of AE/K GFP+ BM LSK cells; Mann-Whitney U test. (H) Kaplan-Meier survival curves of AE/K secondary recipient mice. Irradiated (13 Gy, single dose) 6- to 8-week-old recipients of 2 × 10⁶ bone marrow cells from AE/K CsA (n = 7) or NaCl 0.9% (n = 8) treated primary recipients; Mantel-Cox test. (I) Spleen weight of MA9 primary recipient mice treated with CsA or diluent control (NaCl 0.9%), n.s., not significant. (J) Histologic analysis of liver, lung, and spleen morphology after onset of AML in MA9 primary recipient mice after treatment with CsA or diluent control. Scale bars, 100 μm. (K) Immunophenotypic analysis of GFP+LSK cells in the bone marrow of MA9 primary recipient mice. (L) Survival of MA9-transformed secondary recipient mice. Irradiated (13 Gy, single dose) 6- to 8-week-old recipients of 2 × 10⁶ bone marrow cells from MA9 CsA or NaCl 0.9% treated primary recipient mice (n = 8 CsA; n = 8 NaCl 0.9%), Mantel-Cox test. (M-N) Number of engrafted mice per dilution in the NaCl- vs CsA-treated cohort. LSC frequency was 1/5801 for NaCl-treated recipients (95% confidence interval, 1/2182-15,427) and 1/12,1901 for CsA-treated recipients (95% confidence interval, 1/39,911-372,329), P = .000026 using Poisson analysis; n = 5 mice per dilution and treatment, analysis was performed using ELDA (Extreme Limiting Dilution Assay) software. (O) Colony formation of primary human AE/t(8;21) AML cells (n = 6 individual patients). Colony number per sample following pharmacologic inhibition with CsA (5, 10 μM) compared with diluent control (NaCl 0.9%). (P) Representative pictures of colonies from t(8;21) AML bone marrow cells after pharmacological inhibition with cyclosporin A compared with diluent control (NaCl). Scale bars, 200 μm. (Q) Colony count of BM cells derived from 3 independent healthy donors. Colony number per sample following pharmacologic inhibition with CsA (5 μM) compared with diluent control (NaCl 0.9%). (R) Number of hCD4+ hCD13+ cells per 1 × 10⁶ bone marrow (BM) cells after treatment with CsA (n = 4 mice) compared with diluent control (NaCl 0.9%; n = 4 mice). (S) Pie charts depicting engraftment of t(8;21) AML cells (%) after treatment with CsA or diluent control.
Papaemmanuil E, Gerstung M, Bullinger L, et al. . Genomic classification and prognosis in acute myeloid leukemia. N Engl J Med. 2016;374(23):2209-2221.
-
PMC
-
PubMed
Lane SW, Gilliland DG. Leukemia stem cells. Semin Cancer Biol. 2010;20(2):71-76.
-
PubMed
Saliakoura M, Rossi Sebastiano M, Pozzato C, et al. . PLCγ1 suppression promotes the adaptation of KRAS-mutant lung adenocarcinomas to hypoxia. Nat Cell Biol. 2020; 22(11):1382-1395.
-
PMC
-
PubMed
Heidel FH, Bullinger L, Feng Z, et al. . Genetic and pharmacologic inhibition of β-catenin targets imatinib-resistant leukemia stem cells in CML. Cell Stem Cell. 2012;10(4):412-424.
-
PMC
-
PubMed
Mohr J, Dash BP, Schnoeder TM, et al. . The cell fate determinant Scribble is required for maintenance of hematopoietic stem cell function. Leukemia. 2018;32(5):1211-1221.
-
PubMed