. 2022 Feb 17;139(7):967-982.
doi: 10.1182/blood.2021013568.

Whole-genome landscape of adult T-cell leukemia/lymphoma

Affiliations

Whole-genome landscape of adult T-cell leukemia/lymphoma

Yasunori Kogure et al. Blood. .

Abstract

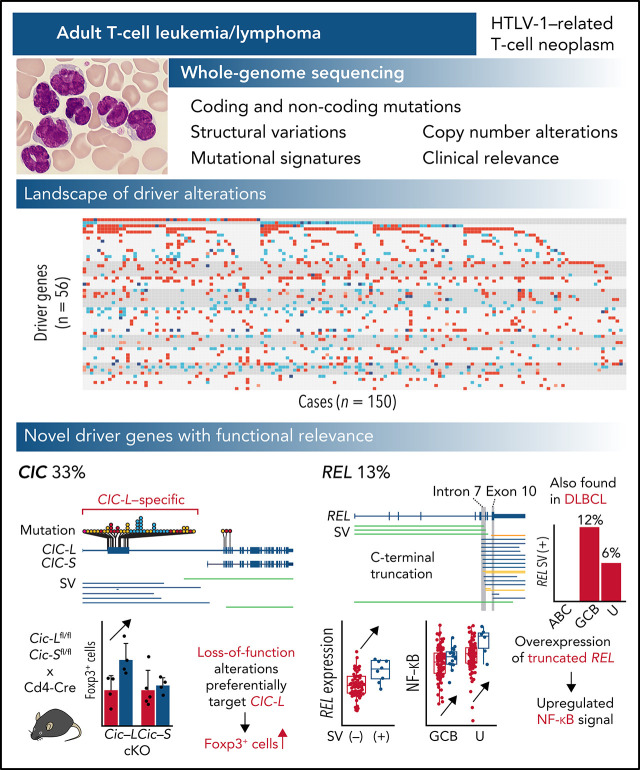
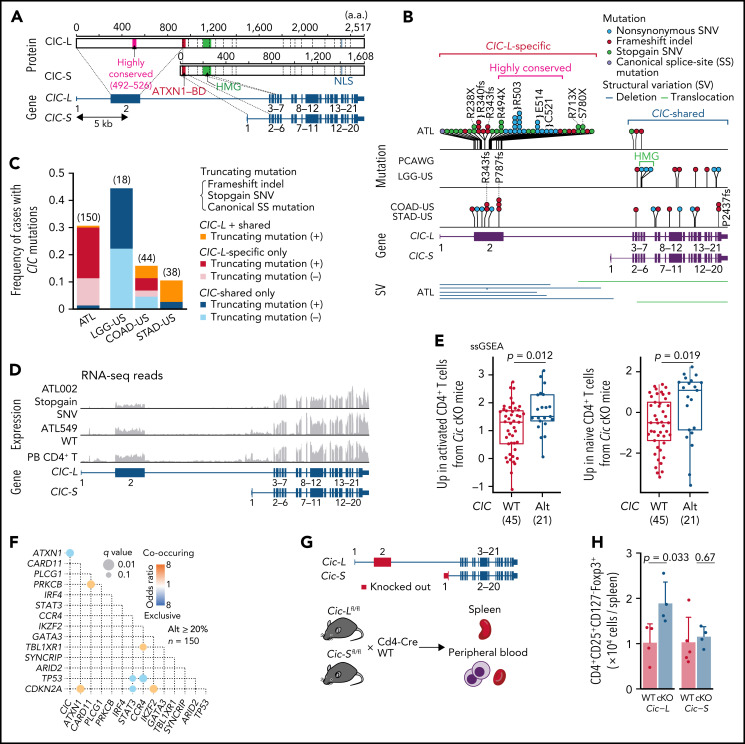
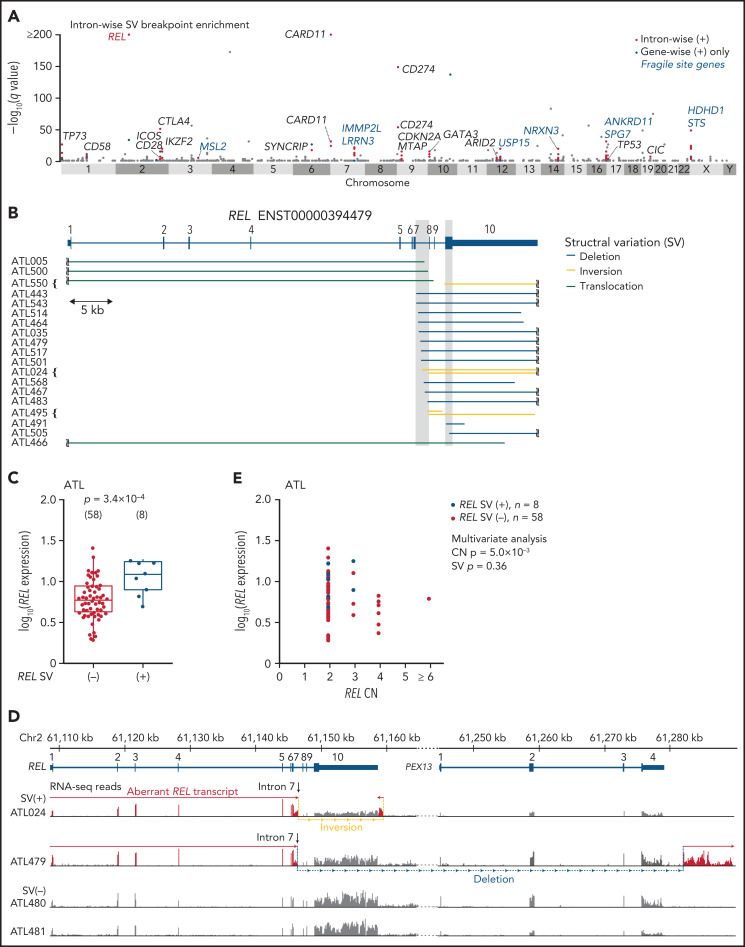
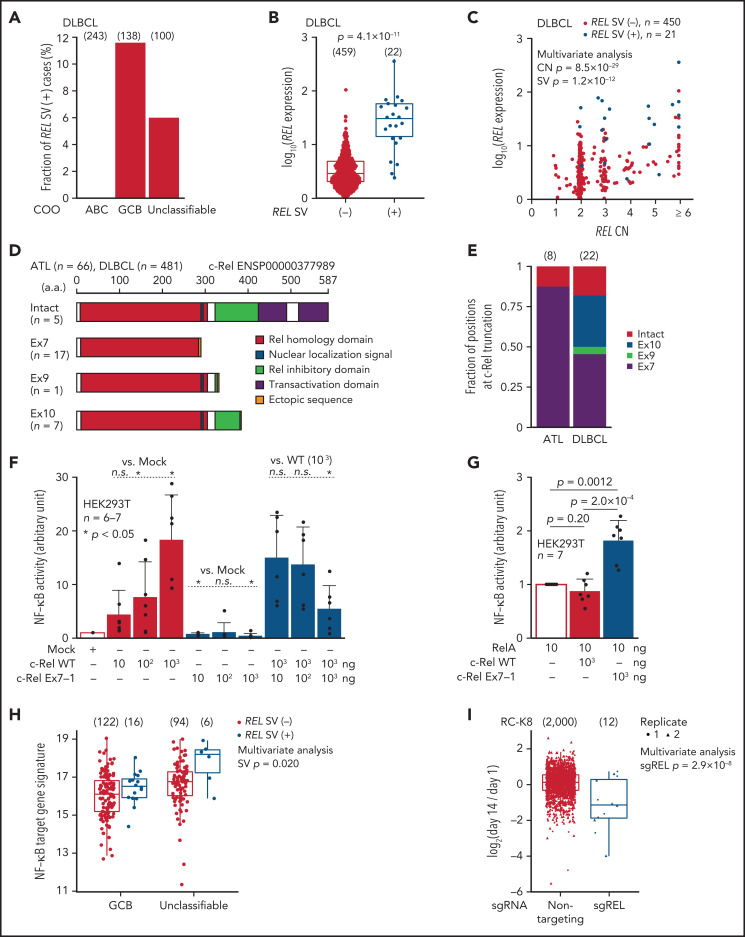
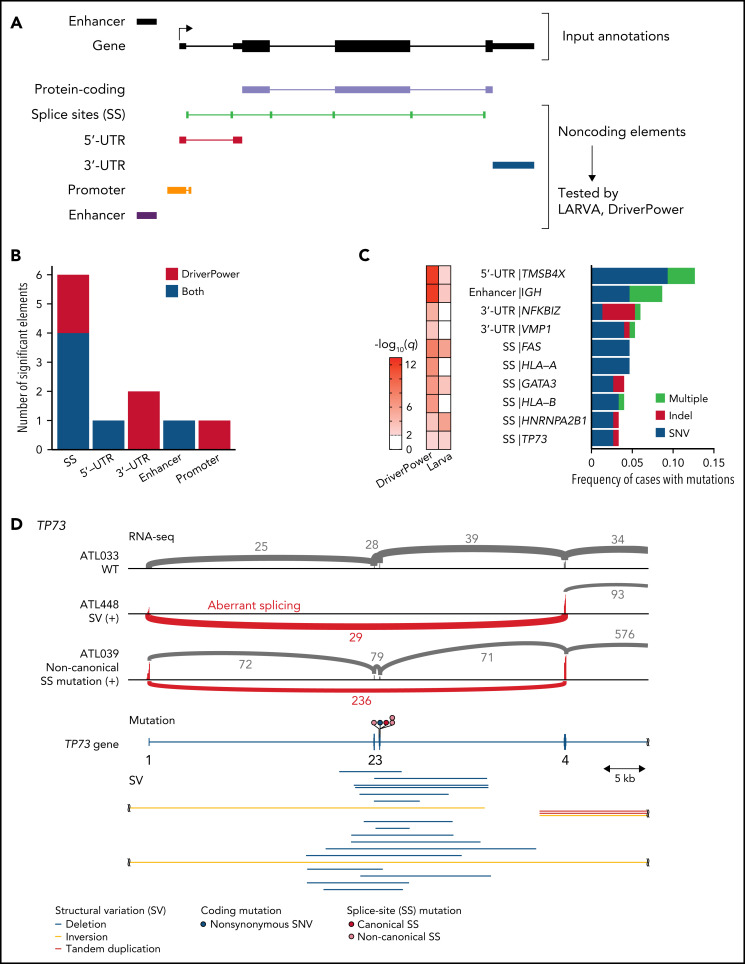
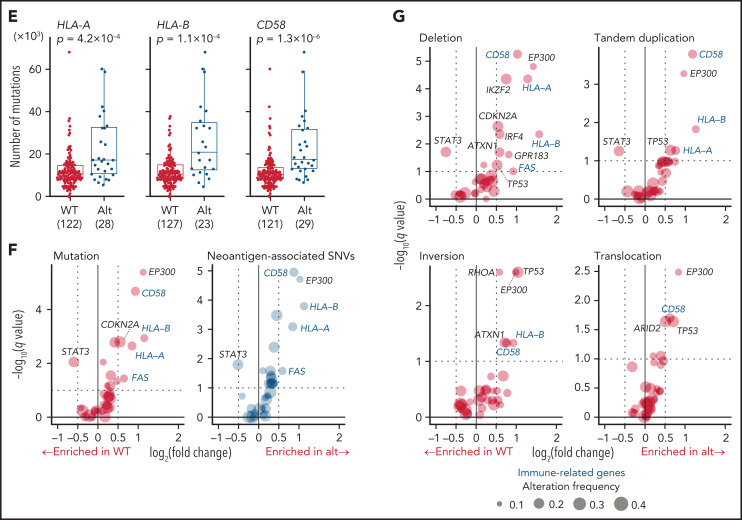
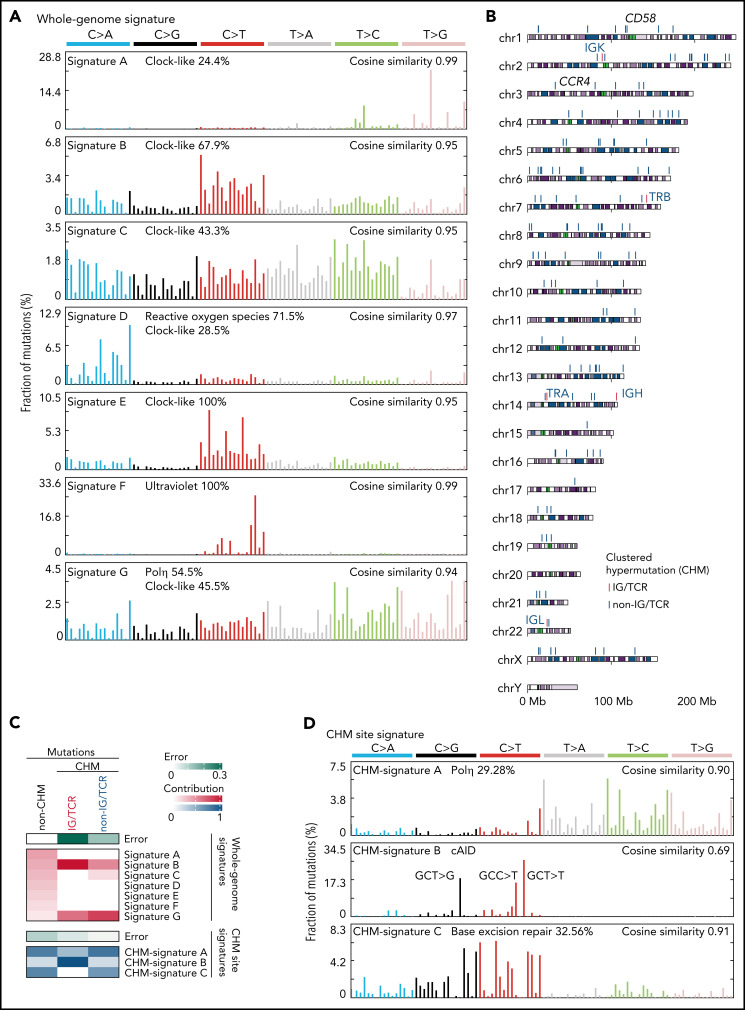
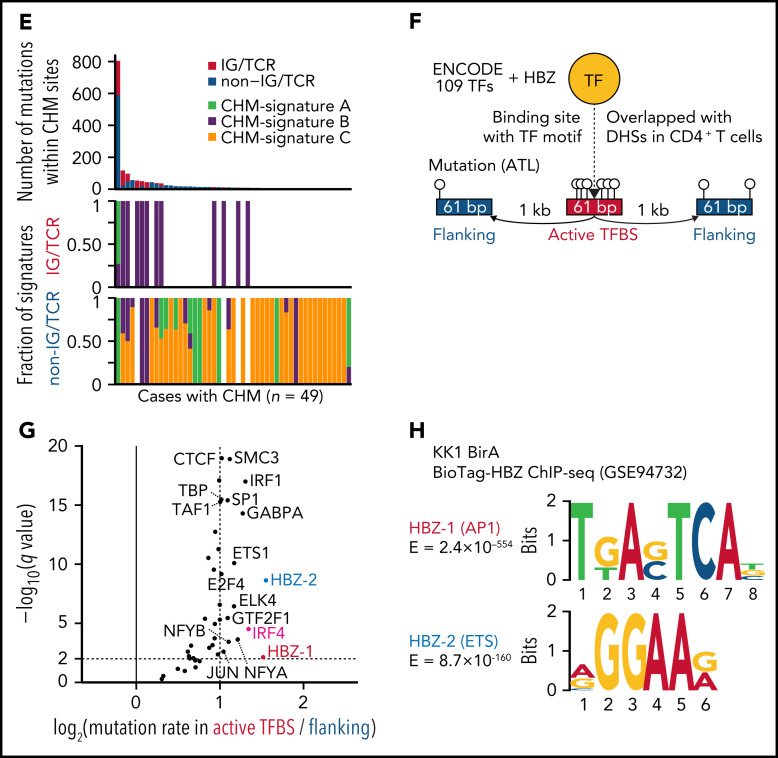
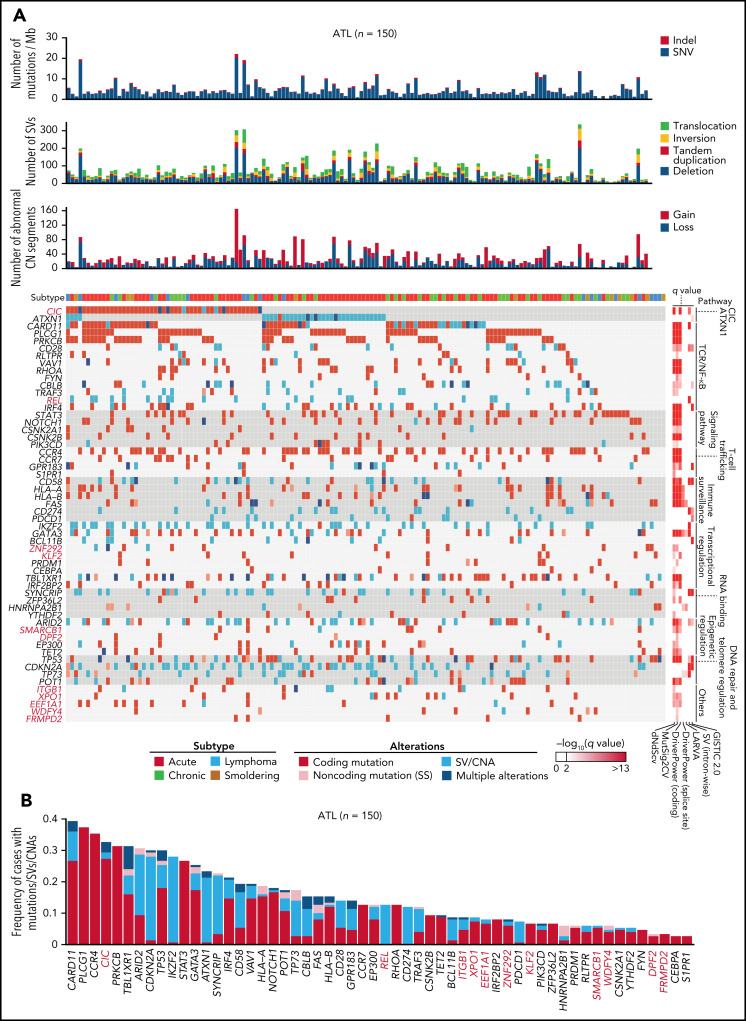
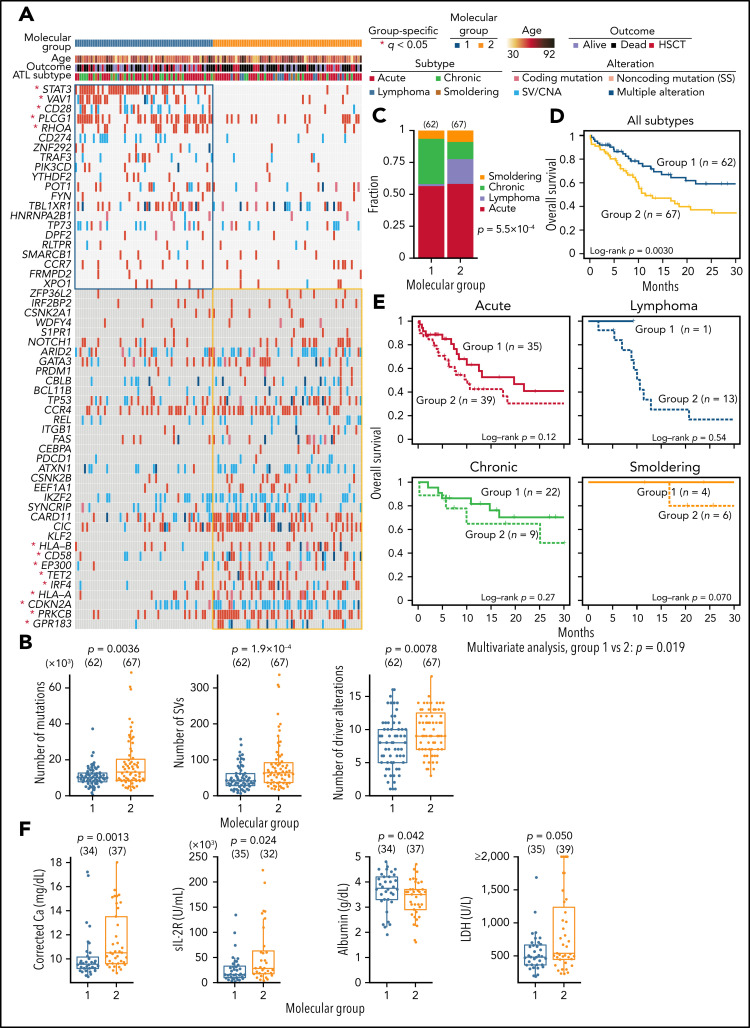
Adult T-cell leukemia/lymphoma (ATL) is an aggressive neoplasm immunophenotypically resembling regulatory T cells, associated with human T-cell leukemia virus type-1. Here, we performed whole-genome sequencing (WGS) of 150 ATL cases to reveal the overarching landscape of genetic alterations in ATL. We discovered frequent (33%) loss-of-function alterations preferentially targeting the CIC long isoform, which were overlooked by previous exome-centric studies of various cancer types. Long but not short isoform-specific inactivation of Cic selectively increased CD4+CD25+Foxp3+ T cells in vivo. We also found recurrent (13%) 3'-truncations of REL, which induce transcriptional upregulation and generate gain-of-function proteins. More importantly, REL truncations are also common in diffuse large B-cell lymphoma, especially in germinal center B-cell-like subtype (12%). In the non-coding genome, we identified recurrent mutations in regulatory elements, particularly splice sites, of several driver genes. In addition, we characterized the different mutational processes operative in clustered hypermutation sites within and outside immunoglobulin/T-cell receptor genes and identified the mutational enrichment at the binding sites of host and viral transcription factors, suggesting their activities in ATL. By combining the analyses for coding and noncoding mutations, structural variations, and copy number alterations, we discovered 56 recurrently altered driver genes, including 11 novel ones. Finally, ATL cases were classified into 2 molecular groups with distinct clinical and genetic characteristics based on the driver alteration profile. Our findings not only help to improve diagnostic and therapeutic strategies in ATL, but also provide insights into T-cell biology and have implications for genome-wide cancer driver discovery.


Figures

None
Graphical abstract
Figure 1.
Figure 1.
Long isoform–specific disruption of CIC. (A) Isoform-specific protein and gene structures of CIC. mRNA and protein reference sequences are shown in supplemental Table 23. (B) Type and position of SVs and mutations within CIC region detected by WGS for 150 ATL cases, together with CIC mutations in other cancer types in the PCAWG project. (C) Frequency of CIC mutations in ATL and other cancer types from the PCAWG project (with CIC mutation frequency ≥10%) according to mutation type (with or without truncating mutations) and location (CIC-L–specific vs –shared). Number of cases in each cohort is shown in parenthesis. Truncating mutations include stopgain single nucleotide variants (SNVs), frameshift indels, and canonical splice-site (SS) mutations. (D) RNA-seq read coverages of CIC region from CIC wild-type (WT) and -altered ATL cases and healthy CD4+ T cells. (E) Single-sample gene set enrichment analysis (ssGSEA) scores in CIC WT (n = 45) and -altered (n = 21) ATL cases, using gene signatures upregulated in activated (left) or naive (right) CD4+ T cells from Cic KO mice. Box plots show medians (lines), interquartile ranges (IQRs; boxes), and ± 1.5 × IQR (whiskers). Numbers of cases are shown in parentheses. Two-sided Brunner-Munzel test. (F) Pairwise associations among 15 driver alterations found in ≥20% of cases. Significant correlations (q < 0.1) colored according to their odds ratios are shown. Two-sided Fisher's exact test with Benjamini-Hochberg correction. (G) Schematic representation of Cic-L and Cic-S cKO mouse experiments. (H) Number of CD4+CD25+CD127-Foxp3+ cells per spleen from CD4+ T-cell–specific homozygous Cic-L and Cic-S cKO mice (n = 4-5). Data represent means + standard deviation. Two-sided Welch's t test. BD, binding domain; COAD-US, colon adenocarcinoma from the US; HMG, high mobility group box; LGG-US, brain lower grade glioma from the United States (US); NLS, nuclear localization signal; STAD-US, gastric adenocarcinoma from the US.
Figure 2.
Figure 2.
REL-truncating SVs in ATL. (A) Introns with significantly enriched SV breakpoints. Introns with q < 0.01, whose breakpoints are found in ≥3 cases, and of gene-wise significant gene, are considered intron-wise significant. Introns with breakpoints in ≥2 cases (n = 888) are shown. (B) REL-truncating SVs in 150 ATL cases. Breakpoint clustered regions (intron 7 and coding sequence in exon 10) are shaded. (C) Expression of REL exon 1-7 in 66 ATL cases analyzed by RNA-seq, according to REL SV status. Numbers of cases are shown in parentheses. Two-sided Brunner-Munzel test. Box plots show the medians (lines), IQRs (boxes), and ± 1.5 × IQR (whiskers). (D) Genomic structure of the rearranged REL locus and transcription in representative ATL cases. In these SV (+) cases, REL open reading frame is terminated within intron 7 and merged into intergenic sequences. Aberrant REL transcripts are shown in red. (E) Effect of REL CN and SV on REL exon 1-7 expression for ATL. Multivariate analysis using linear model. (B,D) mRNA reference sequences are shown in supplemental Table 23.
Figure 3.
Figure 3.
REL-truncating SVs in DLBCL and its oncogenic function. (A) Frequency of aberrant REL transcripts in DLBCL according to cell-of-origin (COO). Numbers of cases are shown in parentheses. (B) Expression of REL exon 1-7 in 481 DLBCL cases from the National Cancer Institute Center for Cancer Research cohort analyzed by RNA-seq according to REL SV status. Numbers of cases are shown in parentheses. Two-sided Brunner-Munzel test. (C) Effect of REL CN and SV on REL exon 1-7 expression for DLBCL with available CN data (n = 471). Multivariate analysis using linear model. (D) Predicted structures of intact and representative truncated c-Rel proteins according to the truncation position. (E) Comparison of the truncation position of c-Rel proteins between ATL and DLBCL cases. Numbers of cases are shown in parentheses. (F-G) Luciferase assays of NF-κB transcriptional activity in HEK293T cells transduced to express WT and/or Ex7-1 c-Rel (F) and together with RelA (G) at indicated amount. (H) ssGSEA scores in GCB and unclassifiable DLBCL stratified by REL SV using a gene signature of NF-κB activation. Numbers of cases are shown in parentheses. Multivariate analysis using linear model. (I) Growth change of a REL SV-harboring DLBCL cell line (RC-K8) by clustered regularly interspaced short palindromic repeat (CRISPR)-mediated REL KO. Dot represents ratio of normalized abundance of each sgRNA in genome-scale CRISPR knockout library. Numbers of sgRNAs are shown in parentheses. Multivariate analysis using linear model. (B,H,I) Box plots show the medians (lines), IQRs (boxes), and ± 1.5 × IQR (whiskers). (F-G) Data represent means + standard deviation. Two-sided Welch's t test. Ex, exon; n.s., not significant.
Figure 4.
Figure 4.
Characteristics of noncoding alterations in ATL. (A) Schematic representation for the definition of noncoding elements according to the functional annotations of the PCAWG project. (B) Number of significant noncoding elements detected in DriverPower and LARVA. (C) Frequency and type of cases with mutations within significant noncoding elements and their q values. (D) Sashimi plot for TP73 transcripts within exons 1-4 of WT, SV (+), and noncanonical SS mutation (+) cases, visualized by Integrative Genomics Viewer (top). Distribution and type of coding and SS mutations and SVs in TP73 (bottom). Arcs represent splicing reads split across exons with their numbers. Only arcs with ≥10 split-reads are shown. mRNA reference sequence is shown in supplemental Table 23. (E) Number of mutations according to the alteration status of HLA-A, HLA-B, and CD58. Numbers of cases are shown in parentheses. Two-sided Brunner-Munzel test. (F) Association of driver alterations and number of mutations (left) and neoantigen-associated SNVs (right). (G) Association of driver alterations and number of SVs. (F-G) Thirty-two genes altered in ≥10% of cases are considered. Fold changes of mean alteration numbers between cases with and without the indicated alterations and their significance are shown. Circle size represents their alteration frequency. Immune-related genes are colored in blue. Two-sided Brunner-Munzel test with Benjamini-Hochberg correction.
Figure 4.
Figure 4.
Characteristics of noncoding alterations in ATL. (A) Schematic representation for the definition of noncoding elements according to the functional annotations of the PCAWG project. (B) Number of significant noncoding elements detected in DriverPower and LARVA. (C) Frequency and type of cases with mutations within significant noncoding elements and their q values. (D) Sashimi plot for TP73 transcripts within exons 1-4 of WT, SV (+), and noncanonical SS mutation (+) cases, visualized by Integrative Genomics Viewer (top). Distribution and type of coding and SS mutations and SVs in TP73 (bottom). Arcs represent splicing reads split across exons with their numbers. Only arcs with ≥10 split-reads are shown. mRNA reference sequence is shown in supplemental Table 23. (E) Number of mutations according to the alteration status of HLA-A, HLA-B, and CD58. Numbers of cases are shown in parentheses. Two-sided Brunner-Munzel test. (F) Association of driver alterations and number of mutations (left) and neoantigen-associated SNVs (right). (G) Association of driver alterations and number of SVs. (F-G) Thirty-two genes altered in ≥10% of cases are considered. Fold changes of mean alteration numbers between cases with and without the indicated alterations and their significance are shown. Circle size represents their alteration frequency. Immune-related genes are colored in blue. Two-sided Brunner-Munzel test with Benjamini-Hochberg correction.
Figure 5.
Figure 5.
Mutational processes operative in ATL. (A) Seven de novo mutational signatures extracted from the whole-genome mutations. Known related etiologies are noted. Cosine similarities between de novo signatures and reconstructed signatures using the COSMIC databaseare shown. (B) Distribution of CHM sites detected by SeqKat. Driver, IG, and TCR genes are noted. (C) Heatmap showing the relative contribution of whole-genome (Signature A-G), and CHM-specific signatures (CHM-signature A-C) across the CHMs within and outside the IG/TCR regions (CHM IG/TCR and CHM non-IG/TCR, respectively) and the remaining mutations (non-CHM). (D) Three de novo mutational signatures extracted from the CHM sites found in 49 ATL cases. (E) Number of mutations (top) and fraction of CHM signatures (bottom), stratified with the membership of the IG/TCR regions within CHM sites for each case. (F) Schematic representation for the analysis of mutation enrichment within active TF binding. (G) Volcano plot displaying differential mutation rate between active binding sites and its flanking regions for 40 TFs from ENCODE database and HBZ (with 2 motifs) in 150 ATL cases. Two-sided Fisher test with Benjamini-Hochberg correction. (H) Two HBZ motifs (AP1 and ETS) identified using MEME-ChIP (E < 1 × 10−150). DHSs, DNase I hypersensitive sites.
Figure 5.
Figure 5.
Mutational processes operative in ATL. (A) Seven de novo mutational signatures extracted from the whole-genome mutations. Known related etiologies are noted. Cosine similarities between de novo signatures and reconstructed signatures using the COSMIC databaseare shown. (B) Distribution of CHM sites detected by SeqKat. Driver, IG, and TCR genes are noted. (C) Heatmap showing the relative contribution of whole-genome (Signature A-G), and CHM-specific signatures (CHM-signature A-C) across the CHMs within and outside the IG/TCR regions (CHM IG/TCR and CHM non-IG/TCR, respectively) and the remaining mutations (non-CHM). (D) Three de novo mutational signatures extracted from the CHM sites found in 49 ATL cases. (E) Number of mutations (top) and fraction of CHM signatures (bottom), stratified with the membership of the IG/TCR regions within CHM sites for each case. (F) Schematic representation for the analysis of mutation enrichment within active TF binding. (G) Volcano plot displaying differential mutation rate between active binding sites and its flanking regions for 40 TFs from ENCODE database and HBZ (with 2 motifs) in 150 ATL cases. Two-sided Fisher test with Benjamini-Hochberg correction. (H) Two HBZ motifs (AP1 and ETS) identified using MEME-ChIP (E < 1 × 10−150). DHSs, DNase I hypersensitive sites.
Figure 6.
Figure 6.
Whole-genome landscape of driver alterations in ATL. (A) Significant somatic mutations, SVs, and focal CNAs in 56 commonly affected genes across ATL cases (n = 150). Number of somatic mutations, SVs, CNA segments, clinical subtypes (top), and q values from driver-calling algorithms and related functional pathways (right) are also shown. (B) Frequency and type of somatic mutations, SVs, and focal CNAs in 56 driver genes for 150 ATL cases. (A-B) Newly detected driver genes in ATL are highlighted in red (n = 11).
Figure 7.
Figure 7.
Association between somatic alterations and clinical features in ATL. (A) Nonnegative matrix factorization–based consensus clustering of ATL samples using 56 driver alterations. Group 1 (n = 62) and group 2 (n = 67) cases with a silhouette score ≥0.5 are shown. *Significant group-specific genes (2-sided Fisher's exact test with Benjamini-Hochberg correction q < 0.05). (B) Comparison of number of mutations, SVs, and driver alterations between molecular groups. (C) Fraction of clinical subtypes within each molecular group. Number of cases in each group is shown in parenthesis. Two-sided Fisher's exact test. (D) Overall survival according to the molecular groups. Kaplan-Meier method with log-rank test. (E) Overall survival in each clinical subtype according to the molecular groups using Kaplan-Meier method. Log-rank test and Cox proportional hazards model (using clinical subtype as a covariate) for univariate and multivariate analysis, respectively. (F) Comparison of laboratory data in ATL cases between molecular groups 1 and 2. Two-sided Brunner-Munzel test. Calcium concentration was corrected using Payne’s formula. (A-F) Samples with silhouette score ≥0.5 were analyzed. (B,F) Two-sided Brunner-Munzel test. Box plots show medians (lines), IQRs (boxes), and ± 1.5 × IQR (whiskers). Ca, calcium; HSCT, hematopoietic stem cell transplantation; LDH, lactate dehydrogenase; sIL-2R, soluble interleukin-2 receptor.

Comment in

References

    1. ICGC/TCGA Pan-Cancer Analysis of Whole Genomes Consortium . Pan-cancer analysis of whole genomes. Nature. 2020;578(7793):82-93. - PMC - PubMed
    1. Weinstein JN, Collisson EA, Mills GB, et al. ; Cancer Genome Atlas Research Network . The Cancer Genome Atlas Pan-Cancer analysis project. Nat Genet. 2013;45(10):1113-1120. - PMC - PubMed
    1. Matsuoka M, Jeang KT. Human T-cell leukaemia virus type 1 (HTLV-1) infectivity and cellular transformation. Nat Rev Cancer. 2007;7(4):270-280. - PubMed
    1. Cook LB, Fuji S, Hermine O, et al. . Revised Adult T-Cell Leukemia-Lymphoma International Consensus Meeting Report. J Clin Oncol. 2019;37(8):677-687. - PMC - PubMed
    1. Ishitsuka K, Tamura K. Human T-cell leukaemia virus type I and adult T-cell leukaemia-lymphoma. Lancet Oncol. 2014;15(11): e517-e526. - PubMed

Publication types

LinkOut - more resources