. 2022 Feb;162(2):604-620.e20.
doi: 10.1053/j.gastro.2021.10.027. Epub 2021 Oct 23.

Single-Cell Transcriptomics Reveals a Conserved Metaplasia Program in Pancreatic Injury

Affiliations

Single-Cell Transcriptomics Reveals a Conserved Metaplasia Program in Pancreatic Injury

Zhibo Ma et al. Gastroenterology. 2022 Feb.

Abstract

Background & aims: Acinar to ductal metaplasia (ADM) occurs in the pancreas in response to tissue injury and is a potential precursor for adenocarcinoma. The goal of these studies was to define the populations arising from ADM, the associated transcriptional changes, and markers of disease progression.

Methods: Acinar cells were lineage-traced with enhanced yellow fluorescent protein (EYFP) to follow their fate post-injury. Transcripts of more than 13,000 EYFP+ cells were determined using single-cell RNA sequencing (scRNA-seq). Developmental trajectories were generated. Data were compared with gastric metaplasia, KrasG12D-induced neoplasia, and human pancreatitis. Results were confirmed by immunostaining and electron microscopy. KrasG12D was expressed in injury-induced ADM using several inducible Cre drivers. Surgical specimens of chronic pancreatitis from 15 patients were evaluated by immunostaining.

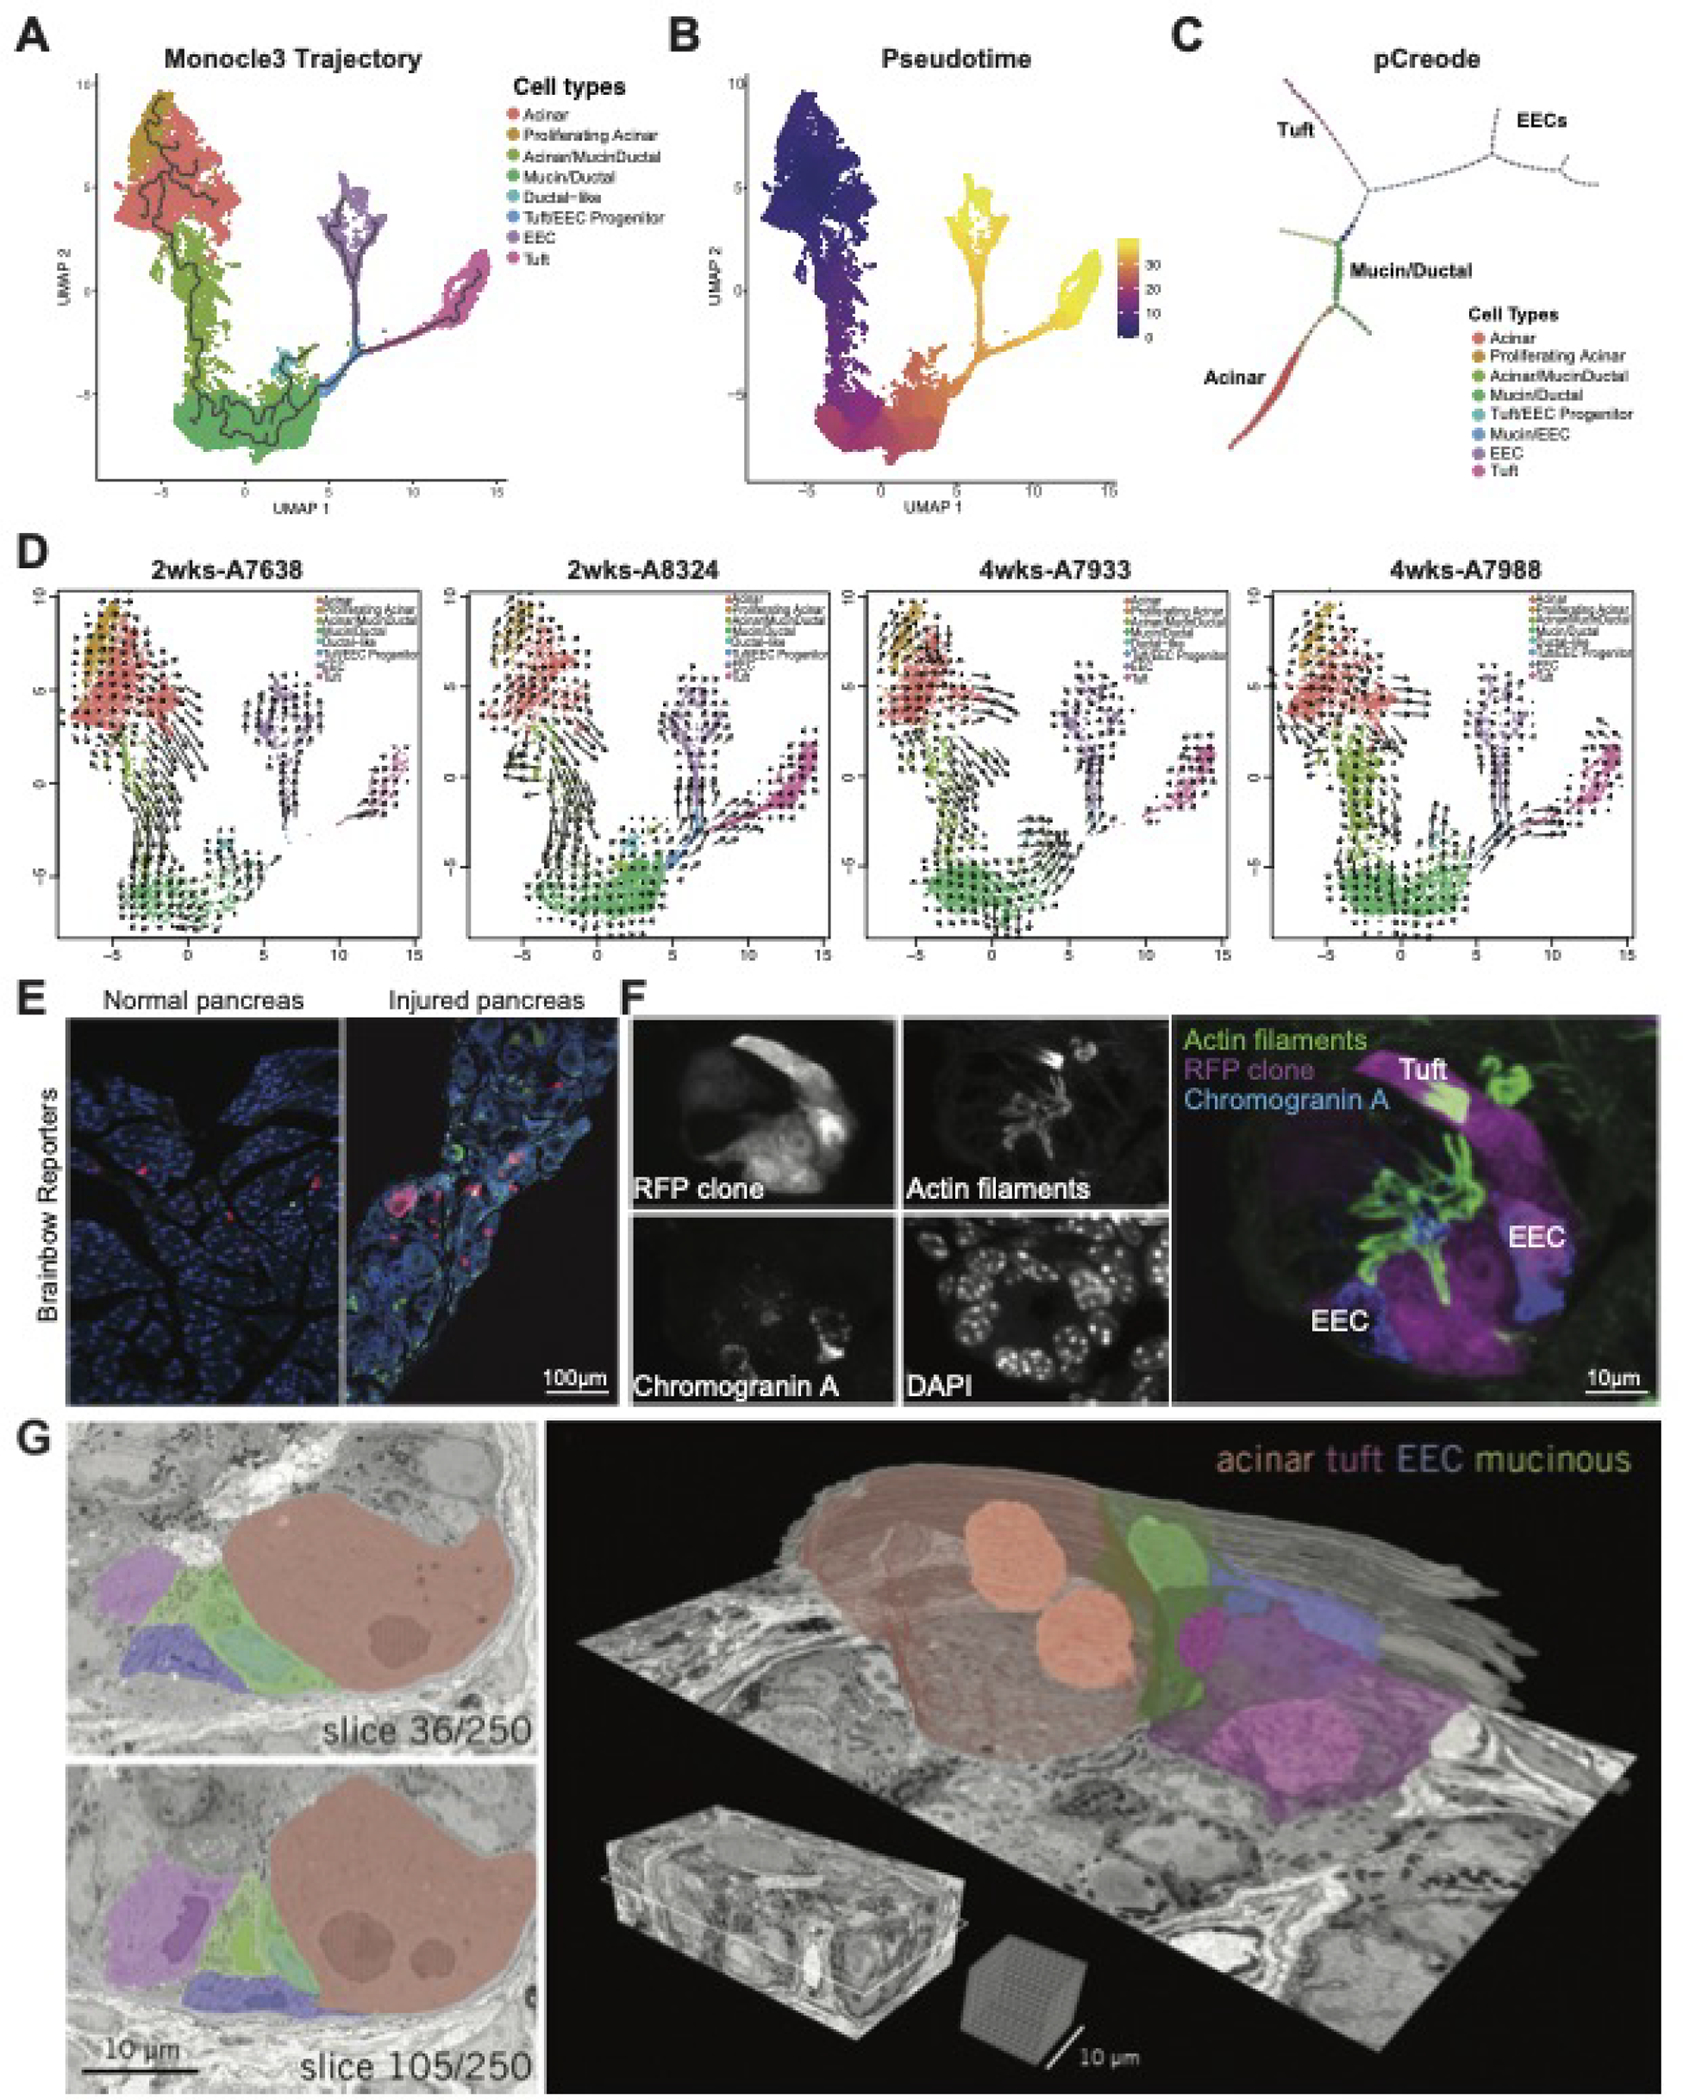
Results: scRNA-seq of ADM revealed emergence of a mucin/ductal population resembling gastric pyloric metaplasia. Lineage trajectories suggest that some pyloric metaplasia cells can generate tuft and enteroendocrine cells (EECs). Comparison with KrasG12D-induced ADM identifies populations associated with disease progression. Activation of KrasG12D expression in HNF1B+ or POU2F3+ ADM populations leads to neoplastic transformation and formation of MUC5AC+ gastric-pit-like cells. Human pancreatitis samples also harbor pyloric metaplasia with a similar transcriptional phenotype.

Conclusions: Under conditions of chronic injury, acinar cells undergo a pyloric-type metaplasia to mucinous progenitor-like populations, which seed disparate tuft cell and EEC lineages. ADM-derived EEC subtypes are diverse. KrasG12D expression is sufficient to drive neoplasia when targeted to injury-induced ADM populations and offers an alternative origin for tumorigenesis. This program is conserved in human pancreatitis, providing insight into early events in pancreas diseases.

Keywords: ADM; Enteroendocrine Cells; Paligenosis; Plasticity; Tuft Cells.


Conflict of interest statement

The authors declare no potential conflicts of interest.

Figures

Figure 1.
Figure 1.. Identification of ADM lineages using scRNA-seq and unbiased clustering.
(A) Schematic of lineage tracing and scRNA-seq strategy to identify ADM populations. (B) UMAP showing annotated clusters in the EYFP+ population. (C) Immunostaining for EYFP (yellow), acinar marker amylase (cyan), endocrine marker chromogranin A (CHGA, magenta), and DAPI, blue, in normal and injured CERTY pancreata. White arrowheads, YFP+ EECs. I, islets. Scale bars, 100μm. (D) Scanning electron microscopy (SEM) of the injured pancreas highlighting an acinar cell, (E) a tuft cell, (F) a mucinous cell, and (G-H) two EECs. Scale bars, 500nm; tuft cell inset, 166.7nm.
Figure 2.
Figure 2.. Lineage trajectory analysis of ADM populations.
(A) Monocle3 trajectory analysis overlaid on the UMAP of EYFP+ cells from injured CERTY pancreata. (B) Pseudotime projection analysis and (C) pCreode approximation of lineage progression of EYFP+ cells. (D) RNA velocity analysis of all four datasets. Arrow direction and length indicate the probable lineage trajectory and velocity, respectively. (E) Brainbow reporter expression in normal and injured pancreata from Ptf1aCreERTM/+;RosaBrainbow.2/+ mice. DAPI, blue. Scale bar, 100μm. (F) iSIM analysis of a whole RFP+ clone containing a tuft cell (phalloidin) and EECs (chromogranin A) within the same lesion. Scale bar, 10μm. (G) 3-D EM reconstruction of ADM showing a heterogeneous consortium of cell types encapsulated by basement membrane with closely apposed vasculature. From left to right, two partially annotated cross-sections from the 3-D EM volume (volume: 58×29×17.5μm; voxel size: 8–8-70nm, x-y-z). Volumetric reconstructions of cell plasma membranes and nuclei, as well as a portion of the basement membrane rendered in gray, demonstrating the morphological variability between cell types. Scale bars, 10μm.
Figure 3.
Figure 3.. ADM as a pyloric-type metaplasia.
(A) Expression of SPEM marker genes Tff2, Cd44, and Aqp5, chief cell marker gene Gif, and TF Gata5 overlaid on the UMAP of EYFP+ cells. (B) Co-IF for SPEM markers TFF2 (yellow), CD44v9 (cyan), and AQP5 or GIF (magenta) and DAPI (blue). Scale bars, 25μm. (C) EM of mature mucus neck cells (black arrowheads) in the normal stomach, SPEM in an acute model of gastric injury (white arrowheads), and mucin/ductal cells from pancreatic ADM. Analogous granules in ADM are marked by arrowheads. Scale bars, 2μm. (D) UMAP of scRNA-seq data collected from normal murine stomach and a SPEM model of acute gastric injury, from Bockerstett et al. (E) Expression of chief cell and acute SPEM signatures overlaid on the UMAP of EYFP+ cells. Gene signatures generated from (D). EC, enterochromaffin; Prolif, proliferating.
Figure 4.
Figure 4.. ADM results in substantial enteroendocrine cell heterogeneity.
(A) UMAP of cell clusters identified in the combined tuft and EEC dataset identified in Figure 1B and labeled by cell type. (B) Monocle3 trajectory analysis overlaid on the UMAP in (A). (C) Expression of TFs Sox4 and (D) Neurog3 overlaid on the UMAP from (A). (E) Expression of epsilon cell marker Ghrl, enterochromaffin cell marker Ddc, delta cell marker, Sst, and PP/gamma cell marker Ppy overlaid on the UMAP from (A). (F) RNA velocity analysis of all four datasets. Arrow direction and length indicate probable lineage trajectory and velocity, respectively. (G) IHC for ghrelin (Ghrl), serotonin (generated by Ddc), somatostatin (Sst), and pancreatic polypeptide (Ppy) in normal and injured pancreata. Black arrows, positive cells. I, islets. Scale bar, 25μm. (H) TEM of an enterochromaffin cell or a delta cell in the injured pancreas. Scale bars, 5 and 2μm respectively.
Figure 5.
Figure 5.. Transcriptomic changes associated with tuft cell formation.
(A) Heatmap of scaled DEGs for the 4 clusters of the tuft cell lineage (from Figure 4A). A selection of known marker genes is labeled on the left. Cells were ordered by increasing pseudotime within each cluster group. (B) Smoothed regulon activity score trend of the tuft cell lineage in Monocle3 pseudotime. (C-D) Regulon activity scores of Pou2f3, Spib, and Ascl1 overlaid on the Tuft+EEC UMAP. (E) Heatmap of scaled RNA expression of tuft-related TFs. Cells are ordered by increasing pseudotime within each cluster group. (F) The aggregated fate probability towards terminal tuft lineage formation. (G-K) Expression of select genes overlaid on the Tuft+EEC UMAP, labeled by Seurat cluster.
Figure 6.
Figure 6.. KrasG12D expression drives PanIN-specific changes in ADM.
(A) UMAP of FastMNN integrated datasets from the injury-induced ADM scRNA-seq dataset and an oncogene-induced ADM dataset from a six-month-old KCT mouse derived from Schlesigner et al. (B) Expression of pit cell markers Gkn1 and Muc5ac and (C) pre-tumor marker Msln. (D) IHC for MUC5AC or MSLN in the normal stomach or pancreas as well as in injury or oncogene (KrasG12D;Ptf1aCre/+)-induced ADM and neoplasia. (E-F) H&E, PAS/AB (mucins) or MUC5AC expression in KHERT or KPERT mice treated with tamoxifen, HERT or PERT mice treated with caerulein or caerulein followed by tamoxifen, and KHERT and KPERT mice first treated with caerulein followed by tamoxifen. Scale bars, 50μm.
Figure 7.
Figure 7.. Human chronic pancreatitis as a pyloric-type transition.
(A) UMAPs showing annotated clusters from sNuc-seq data collected from normal human pancreata (~113k nuclei) or the injured pancreata of two patients with chronic pancreatitis (2,726 nuclei) derived from Tosti et al. (B). Expression of the humanized acute SPEM signature (Figure 3D) overlaid on the UMAPs from (A). (C) Co-IF for SPEM markers (TFF2, magenta; AQP5, yellow; CD44v9, cyan), (D) epsilon and delta cell markers (Ghrl, magenta; SST, yellow; γActin, cyan), and (E) gamma and enterochromaffin cell markers (PPY, magenta; 5-HT, yellow; γActin, cyan). DAPI, blue. Scale bars, 25μm.

References

    1. Giroux V, Rustgi AK. Metaplasia: tissue injury adaptation and a precursor to the dysplasia-cancer sequence. Nat Rev Cancer 2017;17:594–604. - PMC - PubMed
    1. Storz P Acinar cell plasticity and development of pancreatic ductal adenocarcinoma. Nat Rev Gastroenterol Hepatol 2017;14:296–304. - PMC - PubMed
    1. Willet SG, Lewis MA, Miao ZF, et al. Regenerative proliferation of differentiated cells by mTORC1-dependent paligenosis. EMBO J 2018;37. - PMC - PubMed
    1. Murtaugh LC, Keefe MD. Regeneration and repair of the exocrine pancreas. Annu Rev Physiol 2015;77:229–49. - PMC - PubMed
    1. DelGiorno KE, Naeem RF, Fang L, et al. Tuft Cell Formation Reflects Epithelial Plasticity in Pancreatic Injury: Implications for Modeling Human Pancreatitis. Front Physiol 2020;11:88. - PMC - PubMed

Publication types

MeSH terms