

Biochemical and rheological analysis of human colonic culture mucus reveals similarity to gut mucus
- PMID: 34695384
- PMCID: PMC8715165
- DOI: 10.1016/j.bpj.2021.10.024
Biochemical and rheological analysis of human colonic culture mucus reveals similarity to gut mucus
Abstract
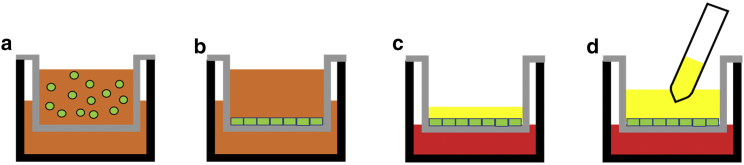
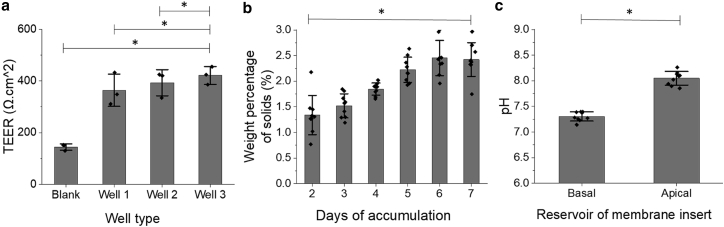
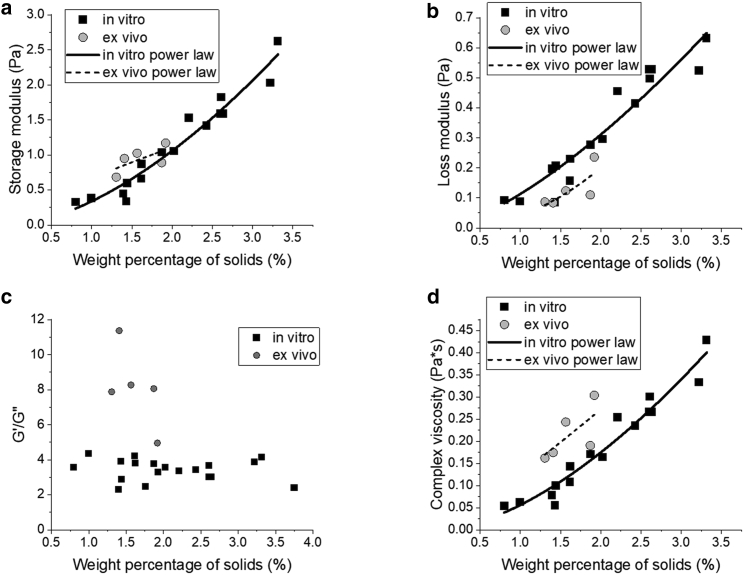
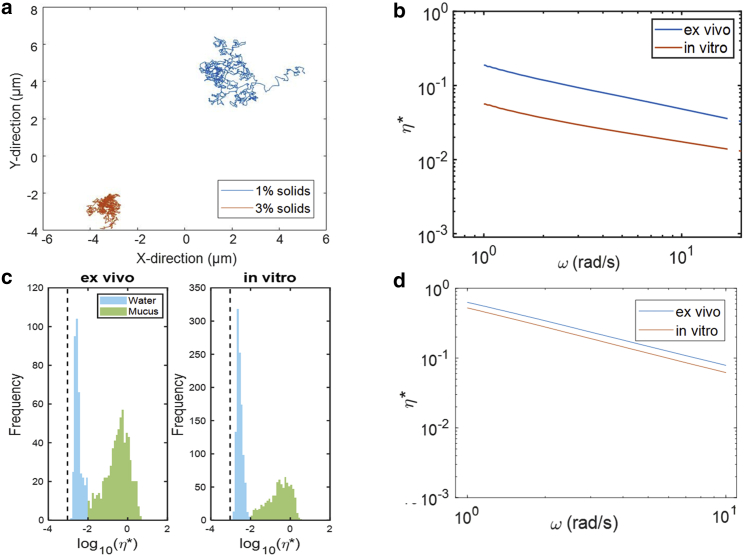
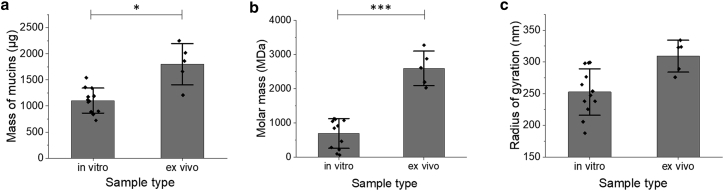
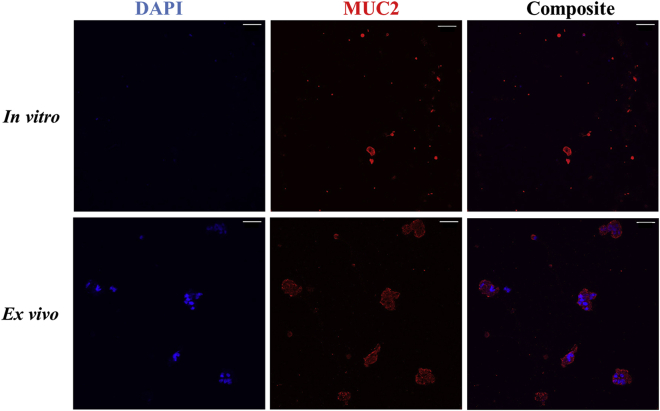
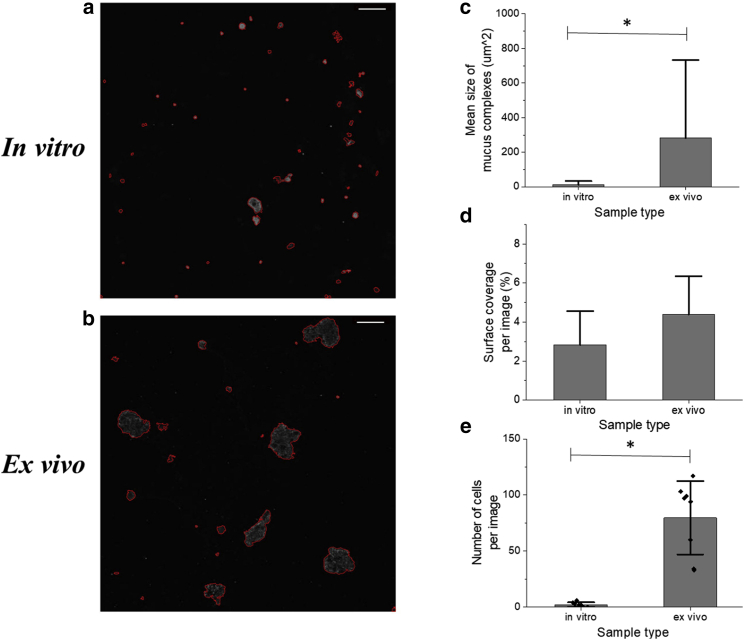
The goal of this project was to validate the functional relevance and utility of mucus produced by an in vitro intestinal cell culture model. This is facilitated by the need to physiologically replicate both healthy and abnormal mucus conditions from native intestinal tissue, where mucus properties have been connected to intestinal disease models. Mucus harvested from colonic cell cultures derived from healthy donors was compared to mucus collected from surgically resected, noninflamed transverse colon tissue. The rheological and biochemical properties of these mucus samples were compared using oscillational rheometry, particle-tracking microrheology, multiangle laser light scattering, refractometry, and immunohistochemical imaging. An air-liquid interface culture of primary human colonic epithelial cells generated a continuous monolayer with an attached mucus layer that displayed increasing weight percent (wt%) of solids over 1 week (1.3 ± 0.5% at 2 days vs. 2.4 ± 0.3% at 7 days). The full range of mucus concentrations (0.9-3.3%) observed during culture was comparable to that displayed by ex vivo mucus (1.3-1.9%). Bulk rheological measurements displayed similar wt%-based complex viscosities between in vitro and ex vivo mucus, with the complex viscosity of both systems increasing with wt% of solids. Particle-tracking microrheology showed higher complex viscosities for ex vivo mucus samples than in vitro mucus which was explained by a greater fraction of water present in in vitro mucus than ex vivo, i.e., in vitro mucus is more heterogeneous than ex vivo. Refractometry, multiangle laser light scattering, and immunostaining showed increased mucus complex size in ex vivo mucus compared with in vitro mucus, which may have been due to the admixture of mucus and cellular debris during ex vivo mucus collection. The air-liquid interface culture system produced intestinal mucus with similar composition and rheology to native human gut mucus, providing a platform to analyze pathological differences in intestinal mucus.
Copyright © 2021 The Authors. Published by Elsevier Inc. All rights reserved.
Figures
Similar articles
-
Macro- and Microrheological Properties of Mucus Surrogates in Comparison to Native Intestinal and Pulmonary Mucus.Biomacromolecules. 2019 Sep 9;20(9):3504-3512. doi: 10.1021/acs.biomac.9b00780. Epub 2019 Aug 28. Biomacromolecules. 2019. PMID: 31419118
-
Air-liquid intestinal cell culture allows in situ rheological characterization of intestinal mucus.APL Bioeng. 2024 May 7;8(2):026112. doi: 10.1063/5.0187974. eCollection 2024 Jun. APL Bioeng. 2024. PMID: 38721267 Free PMC article.
-
Different macro- and micro-rheological properties of native porcine respiratory and intestinal mucus.Int J Pharm. 2016 Aug 20;510(1):164-7. doi: 10.1016/j.ijpharm.2016.06.035. Epub 2016 Jun 14. Int J Pharm. 2016. PMID: 27311353
-
Development, validation and implementation of an in vitro model for the study of metabolic and immune function in normal and inflamed human colonic epithelium.Dan Med J. 2015 Jan;62(1):B4973. Dan Med J. 2015. PMID: 25557335 Review.
-
Mucosa-Mimetic Materials for the Study of Intestinal Homeostasis and Disease.Adv Healthc Mater. 2023 Oct;12(25):e2300301. doi: 10.1002/adhm.202300301. Epub 2023 Jun 25. Adv Healthc Mater. 2023. PMID: 37329337 Review.
Cited by
-
Synthetic Colonic Mucus Enables the Development of Modular Microbiome Organoids.Adv Funct Mater. 2024 Sep 18;34(38):2402514. doi: 10.1002/adfm.202402514. Epub 2024 Mar 13. Adv Funct Mater. 2024. PMID: 39309137
-
Mucus-coated, magnetically-propelled fecal surrogate to mimic fecal shear forces on colonic epithelium.Biomaterials. 2024 Sep;309:122577. doi: 10.1016/j.biomaterials.2024.122577. Epub 2024 Apr 23. Biomaterials. 2024. PMID: 38677221
-
A Microphysiological System with an Anaerobic Air-Liquid Interface and Functional Mucus Layer for Coculture of Intestinal Bacteria and Primary Human Colonic Epithelium.Adv Mater Interfaces. 2024 Sep 3;11(25):2400093. doi: 10.1002/admi.202400093. Epub 2024 Jun 19. Adv Mater Interfaces. 2024. PMID: 39386255
-
Development of a Caco-2-based intestinal mucosal model to study intestinal barrier properties and bacteria-mucus interactions.Gut Microbes. 2025 Dec;17(1):2434685. doi: 10.1080/19490976.2024.2434685. Epub 2024 Dec 23. Gut Microbes. 2025. PMID: 39714032 Free PMC article.
-
Native gastrointestinal mucus: Critical features and techniques for studying interactions with drugs, drug carriers, and bacteria.Adv Drug Deliv Rev. 2023 Sep;200:114966. doi: 10.1016/j.addr.2023.114966. Epub 2023 Jun 15. Adv Drug Deliv Rev. 2023. PMID: 37329985 Free PMC article. Review.
References
-
- Singh P.K., Parsek M.R., et al. Welsh M.J. A component of innate immunity prevents bacterial biofilm development. Nature. 2002;417:552–555. - PubMed
-
- Hodges R.R., Dartt D.A. Encyclopedia of the Eye. Academic Press; 2010. Conjunctival goblet cells; pp. 369–376.
-
- Hattrup C.L., Gendler S.J. Structure and function of the cell surface (tethered) mucins. Annu. Rev. Physiol. 2008;70:431–457. - PubMed
Publication types
MeSH terms
Grants and funding
LinkOut - more resources
Full Text Sources
