. 2021 Oct;19(5):727-740.
doi: 10.1016/j.gpb.2021.08.007. Epub 2021 Oct 23.

Genomic Epidemiology of SARS-CoV-2 in Pakistan

Affiliations

Genomic Epidemiology of SARS-CoV-2 in Pakistan

Shuhui Song et al. Genomics Proteomics Bioinformatics. 2021 Oct.

Abstract

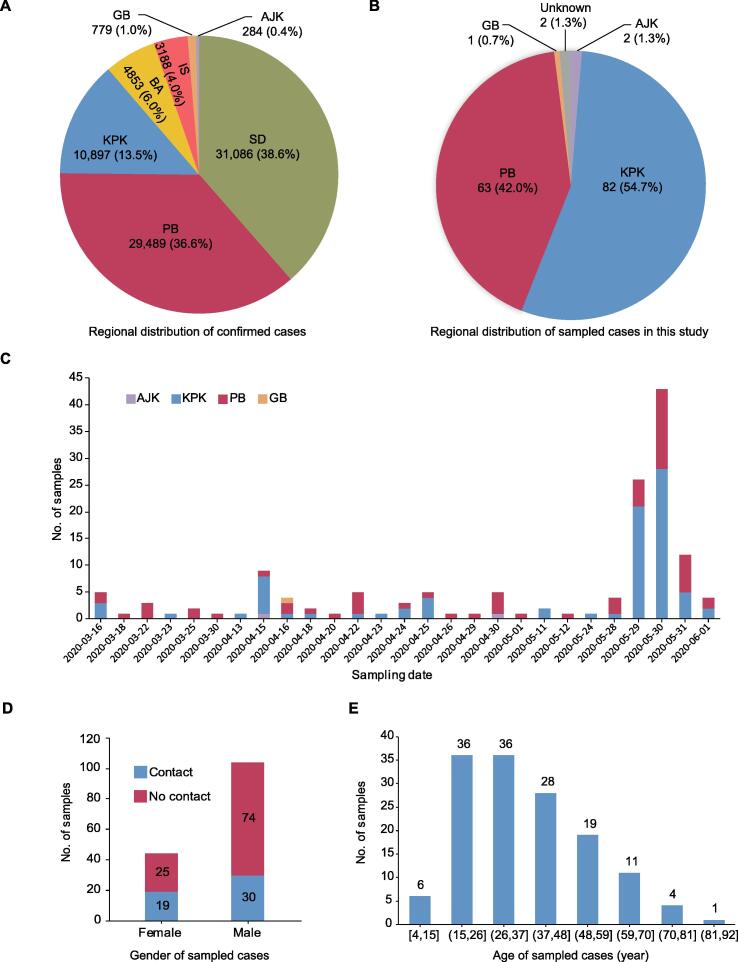
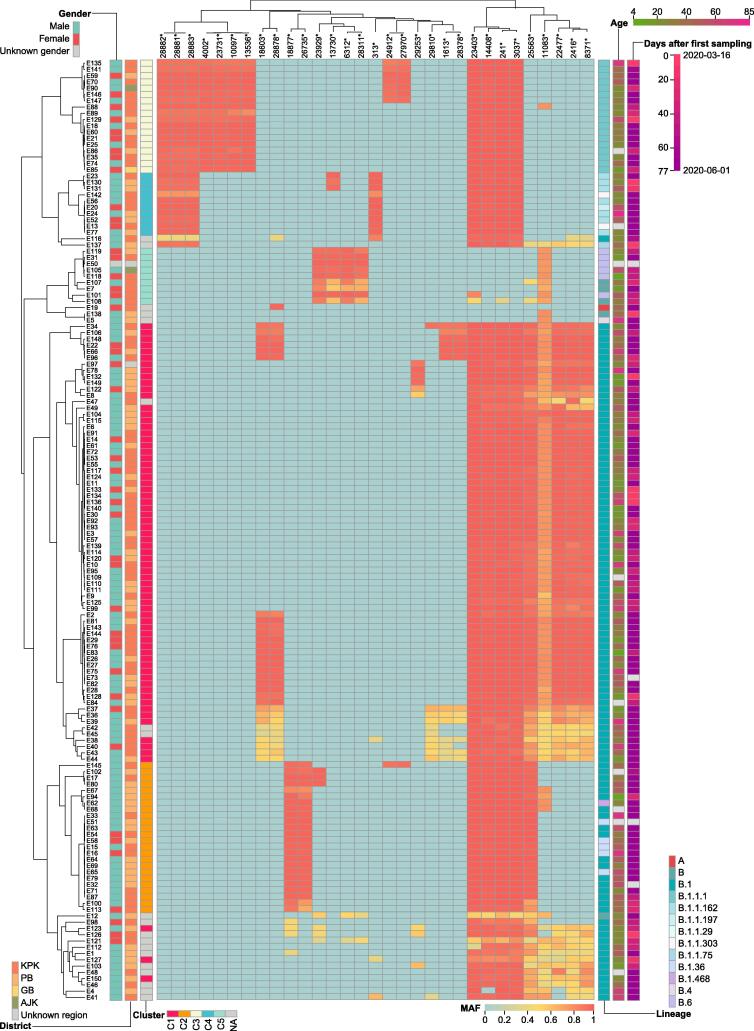
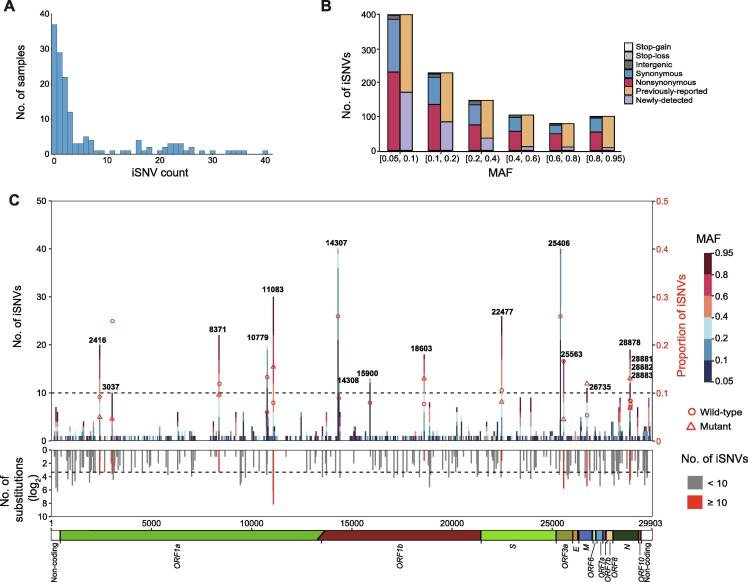
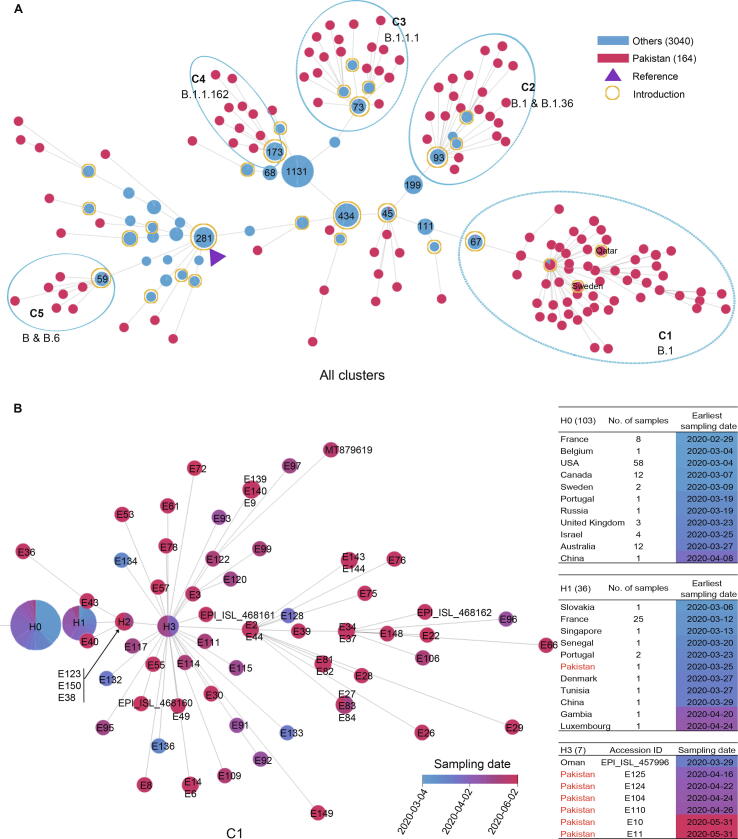
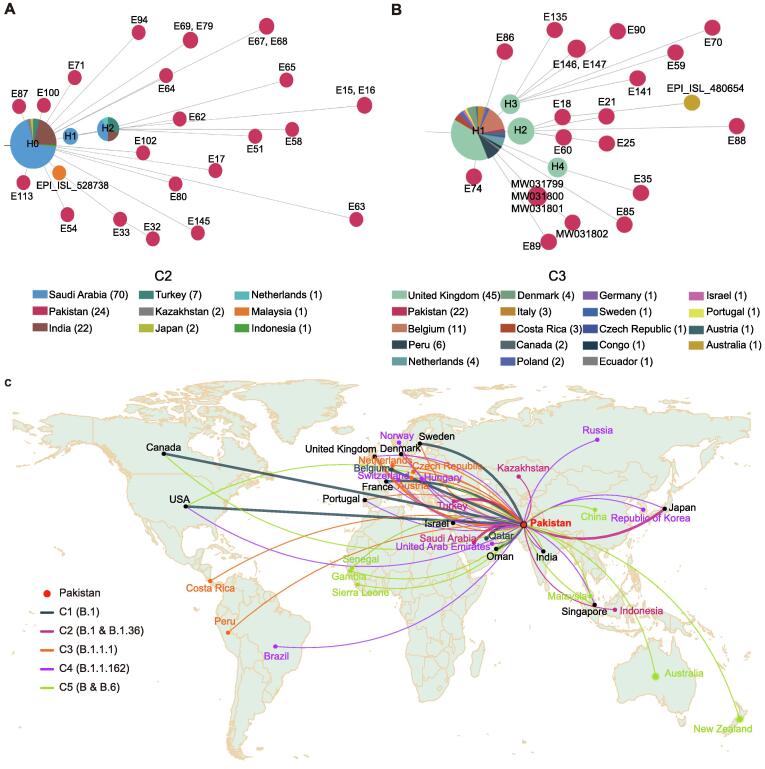
COVID-19 has swept globally and Pakistan is no exception. To investigate the initial introductions and transmissions of the SARS-CoV-2 in Pakistan, we performed the largest genomic epidemiology study of COVID-19 in Pakistan and generated 150 complete SARS-CoV-2 genome sequences from samples collected from March 16 to June 1, 2020. We identified a total of 347 mutated positions, 31 of which were over-represented in Pakistan. Meanwhile, we found over 1000 intra-host single-nucleotide variants (iSNVs). Several of them occurred concurrently, indicating possible interactions among them or coevolution. Some of the high-frequency iSNVs in Pakistan were not observed in the global population, suggesting strong purifying selections. The genomic epidemiology revealed five distinctive spreading clusters. The largest cluster consisted of 74 viruses which were derived from different geographic locations of Pakistan and formed a deep hierarchical structure, indicating an extensive and persistent nation-wide transmission of the virus that was probably attributed to a signature mutation (G8371T in ORF1ab) of this cluster. Furthermore, 28 putative international introductions were identified, several of which are consistent with the epidemiological investigations. In all, this study has inferred the possible pathways of introductions and transmissions of SARS-CoV-2 in Pakistan, which could aid ongoing and future viral surveillance and COVID-19 control.

Keywords: Haplotype network; Molecular evolution; Pakistan; SARS-CoV-2; Virus.


Figures

Figure 1
Figure 1
Epidemic in Pakistan and demographic details of the confirmed COVID-19 cases sampled for sequencing in this study A. Number of confirmed COVID-19 cases for Pakistan districts as of June 2, 2020. B. Regional distribution of 150 confirmed COVID-19 cases in Pakistan sampled for sequencing in this study. C. Number of samples on each sampling date from the districts indicated for the confirmed cases examined in this study. D. Sample distribution according to gender and contact history of cases in this population. Gender and contact information is missing for two different cases. E. Sample distribution according to age of the confirmed cases examined in this study. SD, Sindh; PB, Punjab; KPK, Khyber Pakhtunkhwa; BA, Balochistan; GB, Gilgit Baltistan; IS, Islamabad; AJK, Azad Jammu Kashmir.
Figure 2
Figure 2
Heatmap of MAF for variants with PMF > 0.05 in each sample Accession ID of COVID-19 sampled cases is represented by a number prefixed with E (E is short for experiment). The gender, age, sampling date, and district information for each sampled case is shown with different color schemes. The Pangolin lineage and cluster information for each sample are also integrated. Variants that have significantly different (P < 0.05, Fisher’s exact test) PMF in Pakistani sequences compared to publicly-released sequences (as of October 9, 2020) are marked with asterisks. MAF, mutant allele frequency; PMF, population mutation frequency.
Figure 3
Figure 3
Profile of iSNVs A. Distribution of the iSNV count per sample. One sample with iSNV count of 109 is not shown in the bar chart. B. MAF distribution and mutation types of all iSNVs. Bars in orange and purple represent mutations that are observed and not observed in the polymorphism data (as of September 11, 2020), respectively. C. The number and genomic distribution of all iSNVs. In the top plot, the number of iSNVs at each position is plotted as a bar graph against the left Y axis, with MAF of each iSNV color-coded. The dash lines represent iSNV count of 10. Proportion of iSNVs for positions with iSNV count ≥ 10 is plotted against the right Y axis (major allele frequency ≥ 0.7, sequencing depth ≥ 100). Open circle and open triangle indicate wild-type and mutant nucleotides, respectively. In the middle plot, the grey histogram shows the substitution rate estimated from the polymorphism data. Positions with iSNV count ≥ 10 are indicated in red. In the bottom plot, the diagram shows the genomic structure of SARS-CoV-2. Coding regions are color coded with the respective gene names indicated below, and non-coding regions on both ends are shown in blank. iSNV, intra-host single-nucleotide variant.
Figure 4
Figure 4
Spread and transmission of SARS-CoV-2 sequences in Pakistan A. Haplotype network of all SARS-CoV-2 sequences in Pakistan (Pakistan; red node) and closely-related publicly-released sequences from other countries (Others; blue node) as of October 9, 2020. Each node represents a distinctive haplotype, and the length of edge between any two nodes is proportional to sequence distance. Pakistani sequence clusters are labeled with C1–C5. Node of the reference sequence is marked by a solid triangle in purple, and nodes of putative introductions are labelled with open circles in yellow. Number of samples for public sequences are marked in each node when available. B. The haplotype network of C1. The color of the nodes, from blue to red, represents the sampling date for SARS-CoV-2 sequences in Pakistan as shown for (A) from March 4, 2020 to June 2, 2020. Sample accession ID is marked in each node. Nodes marked by H0, H1, and H2 represent the parent, the first, and the second generations of Pakistani sequences, respectively. Node of H3 indicates the super spreader sequences. Number of samples from different countries for H0 and H1, as well as sample details for H3 are listed in the table on the right.
Figure 5
Figure 5
Two representative introduction-related clusters and schematic diagram of inferred international importing routes A. Haplotype network of C2. B. Haplotype network of C3. C. Schematic diagram of inferred global introductions. Thicker lines represent putative importing countries and thin lines represent other likely importing countries.

References

    1. Umer M.F., Zofeen S., Majeed A., Hu W., Qi X., Zhuang G. Effects of socio-environmental factors on malaria infection in Pakistan: a Bayesian spatial analysis. Int J Environ Res Public Health. 2019;16:1365. - PMC - PubMed
    1. Qi X., Hu W., Mengersen K., Tong S. Socio-environmental drivers and suicide in Australia: Bayesian spatial analysis. BMC Public Health. 2014;14:681. - PMC - PubMed
    1. Abid K., Bari Y.A., Younas M., Tahir Javaid S., Imran A. Progress of COVID-19 epidemic in Pakistan. Asia Pac J Public Health. 2020;32:154–156. - PMC - PubMed
    1. Ghanchi NK, Masood KI, Nasir A, Khan W, Abidi SH, Shahid S, et al. SARS-CoV-2 genome analysis of strains in Pakistan reveals GH, S and L clade strains at the start of the pandemic. bioRxiv 2020;234153.
    1. Sayers EW, Beck J, Brister JR, Bolton EE, Canese K, Comeau DC, et al. Database resources of the National Center for Biotechnology Information. Nucleic Acids Res 2021;49:D10–7. - PMC - PubMed

Publication types