. 2021 Dec;600(7887):127-132.
doi: 10.1038/s41586-021-04130-w. Epub 2021 Oct 25.

Cryptic transmission of SARS-CoV-2 and the first COVID-19 wave

Affiliations

Cryptic transmission of SARS-CoV-2 and the first COVID-19 wave

Jessica T Davis et al. Nature. 2021 Dec.

Abstract

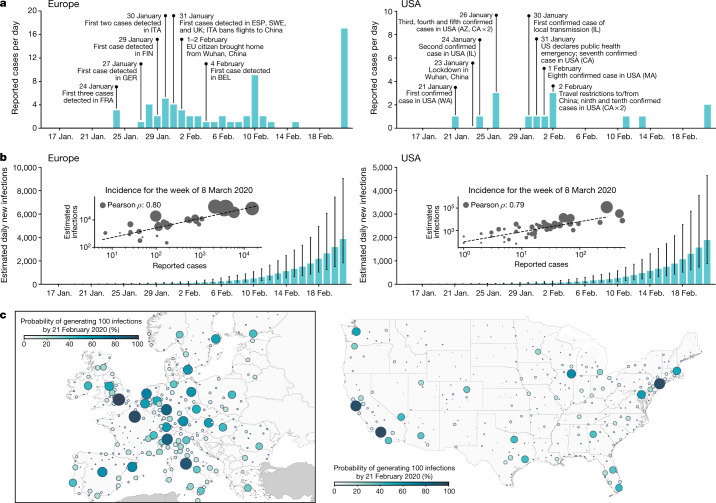
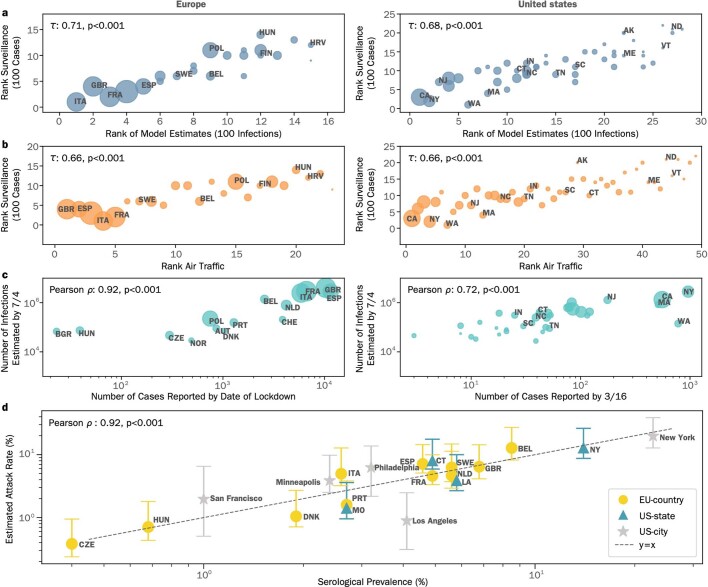
Considerable uncertainty surrounds the timeline of introductions and onsets of local transmission of severe acute respiratory syndrome coronavirus 2 (SARS-CoV-2) globally1-7. Although a limited number of SARS-CoV-2 introductions were reported in January and February 2020 (refs.8,9), the narrowness of the initial testing criteria, combined with a slow growth in testing capacity and porous travel screening10, left many countries vulnerable to unmitigated, cryptic transmission. Here we use a global metapopulation epidemic model to provide a mechanistic understanding of the early dispersal of infections and the temporal windows of the introduction of SARS-CoV-2 and onset of local transmission in Europe and the USA. We find that community transmission of SARS-CoV-2 was likely to have been present in several areas of Europe and the USA by January 2020, and estimate that by early March, only 1 to 4 in 100 SARS-CoV-2 infections were detected by surveillance systems. The modelling results highlight international travel as the key driver of the introduction of SARS-CoV-2, with possible introductions and transmission events as early as December 2019 to January 2020. We find a heterogeneous geographic distribution of cumulative infection attack rates by 4 July 2020, ranging from 0.78% to 15.2% across US states and 0.19% to 13.2% in European countries. Our approach complements phylogenetic analyses and other surveillance approaches and provides insights that can be used to design innovative, model-driven surveillance systems that guide enhanced testing and response strategies.


Conflict of interest statement

M.A. reports research funding from Seqirus, not related to COVID-19. A.V., M.C. and A.P.P. report grants from Metabiota Inc., outside the submitted work. The authors declare no other relationships or activities that could appear to have influenced the submitted work.

Figures

Fig. 1
Fig. 1. Early picture of the COVID-19 outbreak in Europe and the USA.
a, Timelines of the daily reported and confirmed cases of COVID-19 in Europe (left) and the USA (right). BEL, Belgium; ESP, Spain; EU, European Union; FIN, Finland; FRA, France; GER, Germany; ITA, Italy; SWE; Sweden. b, Model-based estimates for the daily number of new infections in Europe (left) and the USA (right). The model estimates reported are the median values with the IQR obtained with an ABC calibration method using n = 200,000 independent model realizations. The inset plots compare the weekly incidence of reported cases with the median, weekly incidence of infections estimated by the model for the week of 8–14 March 2020 for the contiguous US states and European countries that reported at least one case (Europe, n = 30; USA, n = 48). Circle size corresponds to the population size of each state and country. The correlations were calculated using the Pearson correlation coefficient with a two-sided P value (Europe: ρ = 0.80, P < 0.001; USA: ρ = 0.79, P < 0.001). c, The probability that a city in Europe (left) and the USA (right) had generated at least 100 cumulative infections by 21 February 2020. Colour and circle size are proportional to the probability. Source data
Fig. 2
Fig. 2. Timing of the onset of local transmission.
a, b, Posterior distributions of the week in which each US state (a) or European country (b) first reached 10 locally generated SARS-CoV-2 transmission events per day. Countries and states are ordered by the median date of their posterior distribution. The week of this date corresponds to the dates reported on the vertical axis. Source data
Fig. 3
Fig. 3. Importation sources from the beginning of the outbreak until the end of April 2020.
a, b, Each US state (a) and European country (b) is displayed in a clockwise order with respect to the start of the local outbreak (as seen in Fig. 2). Importation flows are directed and weighted. We normalize links considering the total in-flow for each state so that the sum of importation flows, for each state, is 1. In the Supplementary Information, we report the complete list of countries contributing as importation sources in each geographical region. Source data
Fig. 4
Fig. 4. The burden of the first wave in Europe and the USA.
ad, Model fit of the estimated weekly deaths for selected countries in Europe (France, a; Italy, b; Sweden, c; UK, d). e, Posterior distributions of the infection attack rates and IFRs by 4 July 2020, for European countries where there were at least 100 reported deaths. fi, Model fit of the estimated weekly deaths for selected states in the USA (CA, f; IL, g; MA, h; NY, i). j, Posterior distributions of the estimated infection attack rates and IFRs by 4 July 2020 for the top 20 US states (ranked according to their infection attack rates). The curves in ad and fi show the median values and 90% CIs. For e and j, the outer, lighter boxes represent the 90% CI, the darker, inner boxes represent the IQR, and the vertical lines represent the median value. Posterior distributions in e and j are the result of the ABC analysis of 200,000 independent model realizations. Source data
Extended Data Fig. 1
Extended Data Fig. 1. Correlation Analysis for European countries and US states.
(a) The correlation between the ordering of each country/state to reach 100 infections in the model-estimates and to reach 100 reported cases in the surveillance data (Europe: n = 23, US: n = 49). (b) The correlation between the ordering of each country/state considering the time needed to reach 100 reported cases in the surveillance data and the ranking of the combined international and domestic air traffic (Europe n = 23, US n = 49). Correlations in (a, b) are computed considering the Kendall rank correlation coefficient reported with a two-sided p-value, we consider European countries that reached at least 100 reported deaths by July 4, 2020 and countries in Scandinavia (c) Left: the correlation between the number of cases reported by the date of lockdown for European countries (from Table 4 in Ref. ) and the estimated total number of infections by July 4, 2020 (median values, n = 15). Right: the correlation between the number of cases reported by March 16, 2020 (the date the “15 days to slow the spread” guidelines were released in the US Ref. ) for each US state and the estimated total infections by July 4, 2020 (median values, n = 36). We consider states that reached at least 100 reported deaths by July 4, 2020. The circle sizes in (ac) correspond to the population sizes of each country/state. (d) The correlation between the model-estimated infection attack rate and the serological prevalence collected from studies, n = 20. Estimated attack rates are the posterior distributions that are the result of the ABC analysis of 200,000 independent model realizations. Data points refer to different dates and the locations for which serological surveys were available (see table S8 in SI for study descriptions). The model-estimated attack rates use the median value, and the error bars represent the 90%CI. The correlations are calculated using the Pearson correlation coefficient in (c, d) reported with a two-sided p-value.

Update of

Comment in

References

    1. CDC First Travel-related Case of 2019 Novel Coronavirus Detected in United States. https://www.cdc.gov/media/releases/2020/p0121-novel-coronavirus-travel-c... (21 January 2020).
    1. Spiteri G, et al. First cases of coronavirus disease 2019 (COVID-19) in the WHO European Region, 24 January to 21 February 2020. Euro Surveill. 2020;25:2000178. - PMC - PubMed
    1. Althoff, K. N. et al. Antibodies to SARS-CoV-2 in All of Us Research Program Participants, January 2-March 18, 2020. Clin. Infect. Dis. 10.1093/cid/ciab519 (2021). - PMC - PubMed
    1. La Rosa G, et al. SARS-CoV-2 has been circulating in northern Italy since December 2019: evidence from environmental monitoring. Sci. Total Environ. 2021;750:141711. - PMC - PubMed
    1. Deslandes A, et al. SARS-CoV-2 was already spreading in France in late December 2019. Int. J. Antimicrob. Agents. 2020;55:106006. - PMC - PubMed

Publication types