

Healthy Kidney Segmentation in the Dce-Mr Images Using a Convolutional Neural Network and Temporal Signal Characteristics
- PMID: 34695931
- PMCID: PMC8538657
- DOI: 10.3390/s21206714
Healthy Kidney Segmentation in the Dce-Mr Images Using a Convolutional Neural Network and Temporal Signal Characteristics
Abstract
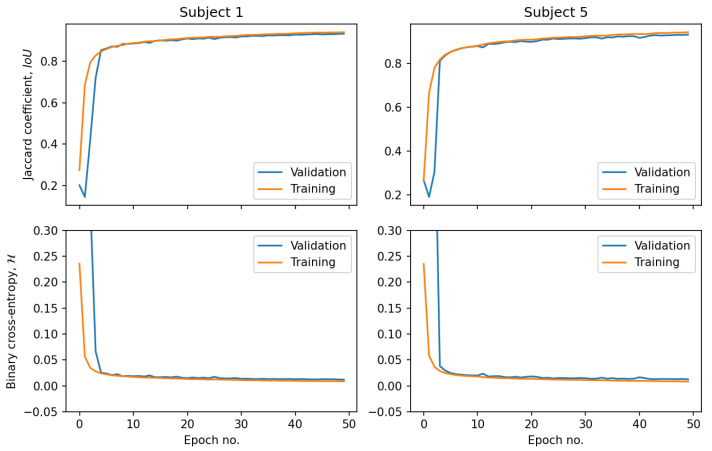
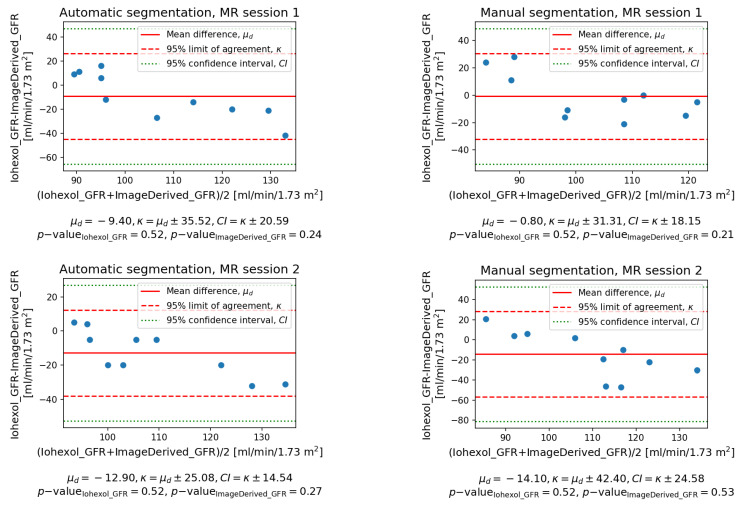
Quantification of renal perfusion based on dynamic contrast-enhanced magnetic resonance imaging (DCE-MRI) requires determination of signal intensity time courses in the region of renal parenchyma. Thus, selection of voxels representing the kidney must be accomplished with special care and constitutes one of the major technical limitations which hampers wider usage of this technique as a standard clinical routine. Manual segmentation of renal compartments-even if performed by experts-is a common source of decreased repeatability and reproducibility. In this paper, we present a processing framework for the automatic kidney segmentation in DCE-MR images. The framework consists of two stages. Firstly, kidney masks are generated using a convolutional neural network. Then, mask voxels are classified to one of three regions-cortex, medulla, and pelvis-based on DCE-MRI signal intensity time courses. The proposed approach was evaluated on a cohort of 10 healthy volunteers who underwent the DCE-MRI examination. MRI scanning was repeated on two time events within a 10-day interval. For semantic segmentation task we employed a classic U-Net architecture, whereas experiments on voxel classification were performed using three alternative algorithms-support vector machines, logistic regression and extreme gradient boosting trees, among which SVM produced the most accurate results. Both segmentation and classification steps were accomplished by a series of models, each trained separately for a given subject using the data from other participants only. The mean achieved accuracy of the whole kidney segmentation was 94% in terms of IoU coefficient. Cortex, medulla and pelvis were segmented with IoU ranging from 90 to 93% depending on the tissue and body side. The results were also validated by comparing image-derived perfusion parameters with ground truth measurements of glomerular filtration rate (GFR). The repeatability of GFR calculation, as assessed by the coefficient of variation was determined at the level of 14.5 and 17.5% for the left and right kidney, respectively and it improved relative to manual segmentation. Reproduciblity, in turn, was evaluated by measuring agreement between image-derived and iohexol-based GFR values. The estimated absolute mean differences were equal to 9.4 and 12.9 mL/min/1.73 m2 for scanning sessions 1 and 2 and the proposed automated segmentation method. The result for session 2 was comparable with manual segmentation, whereas for session 1 reproducibility in the automatic pipeline was weaker.
Keywords: convolutional neural networks; dynamic contrast-enhanced MRI; glomerular filtration rate; kidney segmentation; perfusion quantification; pharmocokinetic modeling.
Conflict of interest statement
The authors declare no conflict of interest.
Figures


Similar articles
-
Improving Automatic Renal Segmentation in Clinically Normal and Abnormal Paediatric DCE-MRI via Contrast Maximisation and Convolutional Networks for Computing Markers of Kidney Function.Sensors (Basel). 2021 Nov 28;21(23):7942. doi: 10.3390/s21237942. Sensors (Basel). 2021. PMID: 34883946 Free PMC article.
-
Dynamic contrast-enhanced MRI measurement of renal function in healthy participants.Acta Radiol. 2017 Jun;58(6):748-757. doi: 10.1177/0284185116666417. Epub 2016 Sep 30. Acta Radiol. 2017. PMID: 27694276
-
A self-supervised strategy for fully automatic segmentation of renal dynamic contrast-enhanced magnetic resonance images.Med Phys. 2019 Oct;46(10):4417-4430. doi: 10.1002/mp.13715. Epub 2019 Aug 16. Med Phys. 2019. PMID: 31306492
-
Current status in spatiotemporal analysis of contrast-based perfusion MRI.Magn Reson Med. 2024 Mar;91(3):1136-1148. doi: 10.1002/mrm.29906. Epub 2023 Nov 6. Magn Reson Med. 2024. PMID: 37929645 Free PMC article. Review.
-
Early-stage fertilised egg viability detection based on machine vision.Br Poult Sci. 2025 Mar 19:1-12. doi: 10.1080/00071668.2025.2470275. Online ahead of print. Br Poult Sci. 2025. PMID: 40105303 Review.
Cited by
-
Transfer learning-based approach for automated kidney segmentation on multiparametric MRI sequences.J Med Imaging (Bellingham). 2022 May;9(3):036001. doi: 10.1117/1.JMI.9.3.036001. Epub 2022 Jun 16. J Med Imaging (Bellingham). 2022. PMID: 35721309 Free PMC article.
-
Magnetic Resonance Imaging in Clinical Trials of Diabetic Kidney Disease.J Clin Med. 2023 Jul 11;12(14):4625. doi: 10.3390/jcm12144625. J Clin Med. 2023. PMID: 37510740 Free PMC article. Review.
-
CNN-Based Kidney Segmentation Using a Modified CLAHE Algorithm.Sensors (Basel). 2024 Dec 2;24(23):7703. doi: 10.3390/s24237703. Sensors (Basel). 2024. PMID: 39686240 Free PMC article.
References
-
- Delanaye P., Ebert N., Melsom T., Gaspari F., Mariat C., Cavalier E., Björk J., Christensson A., Nyman U., Porrini E., et al. Iohexol plasma clearance for measuring glomerular filtration rate in clinical practice and research: A review. Part 1: How to measure glomerular filtration rate with iohexol? Clin. Kidney J. 2016;9:682–699. doi: 10.1093/ckj/sfw070. - DOI - PMC - PubMed
-
- Tofts P., Cutajar M., Mendichovszky I., Peters A., Gordon I. Precise measurement of renal filtration and vascular parameters using a two-compartment model for dynamic contrast-enhanced MRI of the kidney gives realistic normal values. Eur. Radiol. 2012;22:1320–1330. doi: 10.1007/s00330-012-2382-9. - DOI - PubMed
MeSH terms
Substances
LinkOut - more resources
Full Text Sources
Medical
