. 2021 Oct 13;21(20):6789.
doi: 10.3390/s21206789.

Dry Wearable Textile Electrodes for Portable Electrical Impedance Tomography

Affiliations

Dry Wearable Textile Electrodes for Portable Electrical Impedance Tomography

Chang-Lin Hu et al. Sensors (Basel). .

Abstract

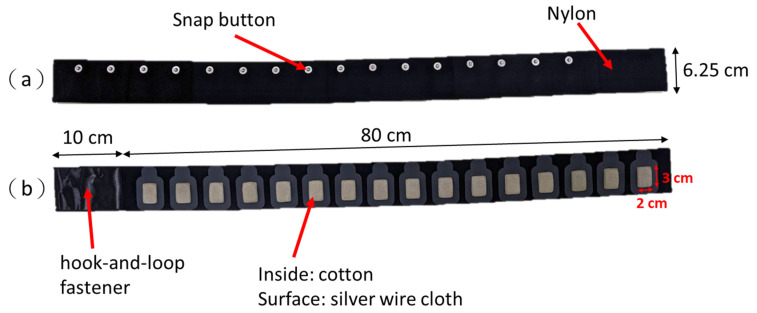
Electrical impedance tomography (EIT), a noninvasive and radiation-free medical imaging technique, has been used for continuous real-time regional lung aeration. However, adhesive electrodes could cause discomfort and increase the risk of skin injury during prolonged measurement. Additionally, the conductive gel between the electrodes and skin could evaporate in long-term usage and deteriorate the signal quality. To address these issues, in this work, textile electrodes integrated with a clothing belt are proposed to achieve EIT lung imaging along with a custom portable EIT system. The simulation and experimental results have verified the validity of the proposed portable EIT system. Furthermore, the imaging results of using the proposed textile electrodes were compared with commercial electrocardiogram electrodes to evaluate their performance.

Keywords: EIT; belt; portable electrical impedance tomography; wearable textile electrode.


Conflict of interest statement

The authors declared no potential conflicts of interest with respect to the research, authorship, and/or publication of this article.

Figures

Figure 1
Figure 1
Our proposed portable electrical impedance tomography (EIT) system.
Figure 2
Figure 2
Experimental phantom and simulation setup. (a) An acrylic rod with a diameter of 4 cm in the acrylic cylinder. (b) A conductivity contrasting inclusion with a diameter of 4 cm using a 2D finite element model. (c) An acrylic rod with a diameter of 2.5 cm in the acrylic cylinder. (d) A conductivity contrasting inclusion with a diameter of 2.5 cm using a 2D finite element model.
Figure 3
Figure 3
A wearable textile-electrode electrical impedance tomography (EIT) belt. (a) The back of the EIT belt with 16 snap buttons. (b) The front of the EIT belt with 16 textile electrodes.
Figure 4
Figure 4
In vivo experiment setup. (a) The wearable textile-electrode belt. (b) Sixteen commercial electrocardiogram electrodes.
Figure 5
Figure 5
A saline tank is used to calculate the voltage difference ΔV. (a) A saline tank with an acrylic rod. (b) The voltage difference ΔV with all 16 electrodes having a good contact and 1 non-contacted electrode.
Figure 6
Figure 6
A in vivo is used to calculate the voltage difference ΔV. (a) The wearable textile-electrode belt. (b) The voltage difference ΔV with all 16 electrodes having a good contact and 1 non-contacted electrode.
Figure 7
Figure 7
Experimental and simulated electrical impedance tomography (EIT) images. (a) An acrylic rod with a diameter of 4 cm in the acrylic cylinder. (b) A conductivity contrasting inclusion with a diameter of 4 cm using a 2D finite element model. (c) An acrylic rod with a diameter of 2.5 cm in the acrylic cylinder. (d) A conductivity contrasting inclusion with a diameter of 2.5 cm using a 2D finite element model.
Figure 8
Figure 8
The difference between the reference voltage and measurement voltage from 27 lung electrical impedance tomography data using commercial electrocardiogram electrodes.
Figure 9
Figure 9
The electrical impedance tomography images of the chest over three breathing cycles using commercial electrocardiogram electrodes.
Figure 10
Figure 10
The reconstructed electrical impedance tomography (EIT) image obtained using commercial electrocardiogram electrodes. (a) EIT imaging of lung ventilation. (b) Two-pixel waveforms in the left lung (red) and right lung (blue).
Figure 11
Figure 11
The difference of the reference voltage with the measurement voltage from 27 lung electrical impedance tomography data using a wearable textile-electrode belt.
Figure 12
Figure 12
The electrical impedance tomography images of the chest over three breathing cycles using the wearable textile-electrode belt.
Figure 13
Figure 13
The reconstructed electrical impedance tomography (EIT) image obtained using the wearable textile-electrode belt. (a) EIT imaging of lung ventilation. (b) Two-pixel waveforms in the left lung (red) and right lung (blue).

Similar articles

Cited by

References

    1. Bowdish D.M. The aging lung: Is lung health good health for older adults? Chest. 2019;155:391–400. doi: 10.1016/j.chest.2018.09.003. - DOI - PubMed
    1. Wu Y., Jiang D., Bardill A., De Gelidi S., Bayford R., Demosthenous A. A high frame rate wearable EIT system using ac-tive electrode ASICs for lung respiration and heart rate monitoring. IEEE Trans. Circuits Syst. I Regul. Pap. 2018;65:3810–3820. doi: 10.1109/TCSI.2018.2858148. - DOI
    1. Brown B.H., Barber D.C., Seagar A.D. Clinical physics and physiological measurement applied potential tomography: Pos-sible clinical applications. Clin. Phys. Physiol. Meas. 1985;6:109–121. doi: 10.1088/0143-0815/6/2/002. - DOI - PubMed
    1. Henderson R.P., Webster J.G. An impedance camera for spatially specific measurements of the thorax. IEEE Trans. Biomed. Eng. 1978;25:250–254. doi: 10.1109/TBME.1978.326329. - DOI - PubMed
    1. Barber D.C., Brown B.H., Freeston I.L. Imaging spatial distributions of resistivity using applied potential tomog-raphy. Electron. Lett. 1983;19:93–95. doi: 10.1049/el:19830637. - DOI

LinkOut - more resources