. 2021 Oct 13;21(20):6801.
doi: 10.3390/s21206801.

Functional Connectivity and Frequency Power Alterations during P300 Task as a Result of Amyotrophic Lateral Sclerosis

Affiliations

Functional Connectivity and Frequency Power Alterations during P300 Task as a Result of Amyotrophic Lateral Sclerosis

Claudia X Perez-Ortiz et al. Sensors (Basel). .

Abstract

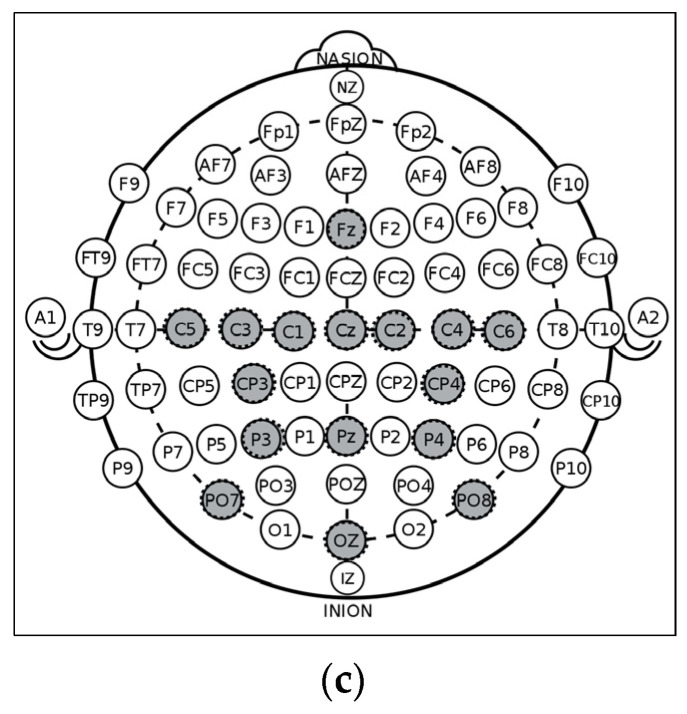
Amyotrophic Lateral Sclerosis (ALS) is one of the most aggressive neurodegenerative diseases and is now recognized as a multisystem network disorder with impaired connectivity. Further research for the understanding of the nature of its cognitive affections is necessary to monitor and detect the disease, so this work provides insight into the neural alterations occurring in ALS patients during a cognitive task (P300 oddball paradigm) by measuring connectivity and the power and latency of the frequency-specific EEG activity of 12 ALS patients and 16 healthy subjects recorded during the use of a P300-based BCI to command a robotic arm. For ALS patients, in comparison to Controls, the results (p < 0.05) were: an increment in latency of the peak ERP in the Delta range (OZ) and Alpha range (PO7), and a decreased power in the Beta band among most electrodes; connectivity alterations among all bands, especially in the Alpha band between PO7 and the channels above the motor cortex. The evolution observed over months of an advanced-state patient backs up these findings. These results were used to compute connectivity- and power-based features to discriminate between ALS and Control groups using Support Vector Machine (SVM). Cross-validation achieved a 100% in specificity and 75% in sensitivity, with an overall 89% success.

Keywords: ALS; BCI; EEG; classifier; connectivity; frequency-specific; neural.


Conflict of interest statement

The authors declare no conflict of interest.

Figures

Figure 1
Figure 1
(a) Layout of the BCI (Brain Computer Interface) system whose purpose is to generate an alternative pathway for muscle movement. (b) Graphical interface of the P300-BCI in its different stages used to control a robotic hand-orthosis [21]. (c) Position of electrodes used in this P300-BCI according to 10–20 system.
Figure 1
Figure 1
(a) Layout of the BCI (Brain Computer Interface) system whose purpose is to generate an alternative pathway for muscle movement. (b) Graphical interface of the P300-BCI in its different stages used to control a robotic hand-orthosis [21]. (c) Position of electrodes used in this P300-BCI according to 10–20 system.
Figure 2
Figure 2
Processing stages of information.
Figure 3
Figure 3
(a) Electrodes’ locations found to be statistically different in power magnitude variables between Amyotrophic Lateral Sclerosis (ALS) ALS and Control group; (b) distribution of power magnitude variables for each electrode of ALS group and Control group.
Figure 4
Figure 4
Mean ERPs of all 16 channels in Beta band. In cyan, the ALS group mean is observed, while blue represents the Control group. The segments that are red are significantly different with p < 0.05. The x-axis represents milliseconds and y-axis microvolts.
Figure 5
Figure 5
(a) Mean spectral power percent change of electrode CZ for ALS group; (b) mean spectral power percent change of electrode CZ for Control group; the Control group has a power increment and the ALS group has a power decrement; (c) mean spectral power percent change in electrode PZ for ALS group; (d) mean spectral power percent change in electrode PZ for Control group.
Figure 6
Figure 6
(a) Channel CZ. Time–frequency power map (up left). Time–frequency power map with the significant area highlighted (up right). Time–frequency power map displaying only significantly different area (down left); (b) Channel C2. Time–frequency power map with significant area highlighted; (c) Channel C4. Time–frequency power map with the significant area highlighted.
Figure 7
Figure 7
(a) Electrodes’ locations found to be statistically different in power latency variables between ALS and Control group; (b) distribution of latencies for ALS and Control group in location OZ for the Theta band; (c) distribution of latencies for ALS and Control group in location PO7 for the Alpha band.
Figure 8
Figure 8
(a) Electrodes’ locations found to be statistically different in connectivity variables between ALS and Control group for bands Delta, Theta, and Beta; (b) electrodes’ locations found to be statistically different in connectivity variables between ALS and Control group for Beta band; (c) ISPC of all subjects and patients of electrodes PO7 (bottom) and CP4 (top) with all channels. Control is in blue and ALS in green. Most connectivity values’ significant differences were found between the PO7 electrode and the electrodes above the motor cortex area, CZ, C1 C2, C3, C4, and CP4. This can be seen in the PO7 chart, where almost all ALS connectivities are below the Control group.
Figure 8
Figure 8
(a) Electrodes’ locations found to be statistically different in connectivity variables between ALS and Control group for bands Delta, Theta, and Beta; (b) electrodes’ locations found to be statistically different in connectivity variables between ALS and Control group for Beta band; (c) ISPC of all subjects and patients of electrodes PO7 (bottom) and CP4 (top) with all channels. Control is in blue and ALS in green. Most connectivity values’ significant differences were found between the PO7 electrode and the electrodes above the motor cortex area, CZ, C1 C2, C3, C4, and CP4. This can be seen in the PO7 chart, where almost all ALS connectivities are below the Control group.
Figure 9
Figure 9
(a) Average InterSite Phase Clustering (ISPC) between electrodes PO7 and CP4 of Control (red) and ALS (blue). Alpha band is shown in blue. In the Alpha band, the ALS group is below the Control group; (b) Average ISPC between electrodes PO7 and C2 of Control (red) and ALS (blue). Alpha band is shown in blue. In the Alpha band, the ALS group is below the Control group; (c) Average ISPC between electrodes FZ and CP4 of Control (red) and ALS (blue). Beta band is shown in blue. In the Beta band, the ALS group is above the Control group.
Figure 9
Figure 9
(a) Average InterSite Phase Clustering (ISPC) between electrodes PO7 and CP4 of Control (red) and ALS (blue). Alpha band is shown in blue. In the Alpha band, the ALS group is below the Control group; (b) Average ISPC between electrodes PO7 and C2 of Control (red) and ALS (blue). Alpha band is shown in blue. In the Alpha band, the ALS group is below the Control group; (c) Average ISPC between electrodes FZ and CP4 of Control (red) and ALS (blue). Beta band is shown in blue. In the Beta band, the ALS group is above the Control group.
Figure 10
Figure 10
(a) Estimated population density of maximum power for ALS group and Healthy Control; (b) connectivity (ISPC) value between electrodes CZ and PO7 in the Alpha range for four different sessions for Px1 and three different sessions for Px2. Each session was three months apart.

References

    1. Zarei S., Carr K., Reiley L., Diaz K., Guerra O., Altamirano P.F., Pagani W., Lodin D., OrOZco G., Chinea A. A comprehensive review of amyotrophic lateral sclerosis. Surg. Neurol. Int. 2015;6:171. doi: 10.4103/2152-7806.169561. - DOI - PMC - PubMed
    1. Kellmeyer P., Grosse-Wentrup M., Schulze-Bonhage A., Ziemann U., Ball T. Electrophysiological correlates of neurodegeneration in motor and non-motor brain regions in amyotrophic lateral sclerosis—Implications for brain-computer interfacing. J. Neural Eng. 2018;15:041003. doi: 10.1088/1741-2552/aabfa5. - DOI - PubMed
    1. Chiò A., Pagani M., Agosta F., Calvo A., Cistaro A., Filippi M. Neuroimaging in amyotrophic lateral sclerosis: Insights into structural and functional changes. Lancet Neurol. 2014;13:1228–1240. doi: 10.1016/S1474-4422(14)70167-X. - DOI - PubMed
    1. Iyer P.M., Egan C., Pinto-Grau M., Burke T., Elamin M., Nasseroleslami B., Pender N., Lalor E.C., Hardiman O. Functional connectivity changes in resting-state EEG as potential biomarker for Amyotrophic Lateral Sclerosis. PLoS ONE. 2015;10:e0128682. doi: 10.1371/journal.pone.0128682. - DOI - PMC - PubMed
    1. Fraschini M., Demuru M., Hillebrand A., Cuccu L., Porcu S., Di Stefano F., Puligheddu M., Floris G., Borghero G., Marrosu F. EEG functional network topology is associated with disability in patients with amyotrophic lateral sclerosis. Nat. Publ. Gr. 2016;6:1–7. doi: 10.1038/srep38653. - DOI - PMC - PubMed

MeSH terms