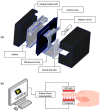
Review
. 2021 Oct 14;21(20):6820.
doi: 10.3390/s21206820.

A Review of Non-Invasive Optical Systems for Continuous Blood Glucose Monitoring

Affiliations
Review

A Review of Non-Invasive Optical Systems for Continuous Blood Glucose Monitoring

Bushra Alsunaidi et al. Sensors (Basel). .

Abstract

The prevalence of diabetes is increasing globally. More than 690 million cases of diabetes are expected worldwide by 2045. Continuous blood glucose monitoring is essential to control the disease and avoid long-term complications. Diabetics suffer on a daily basis with the traditional glucose monitors currently in use, which are invasive, painful, and cost-intensive. Therefore, the demand for non-invasive, painless, economical, and reliable approaches to monitor glucose levels is increasing. Since the last decades, many glucose sensing technologies have been developed. Researchers and scientists have been working on the enhancement of these technologies to achieve better results. This paper provides an updated review of some of the pioneering non-invasive optical techniques for monitoring blood glucose levels that have been proposed in the last six years, including a summary of state-of-the-art error analysis and validation techniques.

Keywords: Raman; diabetes; fluorescent; glucose; infrared; non-invasive; optics; photoacoustic; spectroscopy; terahertz.


Conflict of interest statement

The authors declare no conflict of interest.

Figures

Figure 1
Figure 1
Glucose monitoring techniques classification chart. In this paper, only the non-invasive optical methods with a grey background are reviewed.
Figure 2
Figure 2
Schematic representation of (a) transmission and (b) reflection configurations of NIR spectroscopy. In the transmission configuration, the detector is located on the other side of the sample and only the transmitted photons are measured. In the reflection configuration, the detector is located on the same side of the sample and only the scattered photons are measured.
Figure 3
Figure 3
A wearable glucose sensor system: (A) signal processing block diagram, (B) measurement site, and (C) designed printed circuit board with four photodiodes biosensor. Reprinted with permission from [23].
Figure 4
Figure 4
(a) A prototype for the NIR transmission spectroscopy for the noninvasive glucose monitoring system and (b) the finger placement illustration. In this prototype, only transmitted photons via the finger are measured. Reproduced with permission from [24].
Figure 5
Figure 5
Dual-channel near-infrared sensor where the SDS for the short channel (left side) is 2 mm at 1450 nm and the SDS for the long channel (right-side) is 6 mm at 1750 nm. Reprinted with permission from [25].
Figure 6
Figure 6
Illustration of the proposed iGLU 2.0 device using dual NIR spectroscopy that involves absorption and reflection spectroscopy of 940 nm, and absorption spectroscopy of 1300 nm. Reprinted with permission from [26].
Figure 7
Figure 7
Schematic setup of the proposed MIR system, where the light is propagated via a hollow fiber to an ATR prism that is put inside the mouth. Accordingly, the absorbance of the oral mucosa is measured using two ATR prisms of different thicknesses. Reprinted with permission from [27] © The Optical Society.
Figure 8
Figure 8
A simplified diagram of Raman spectroscopy where a collimating lens capture part of the scattered radiation and directing it to a filter, so only the Raman scattered light at a wavelength that is different from the incident light to be sensed by the detector. The computer processes the signal and provides the corresponding Raman shift. Redrawn from reference [5].
Figure 9
Figure 9
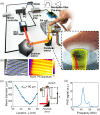
The suggested system: (A) schematic diagram, (B) experiment setup, and (C) obtained glucose profile. Exponential time decay of fluorescence from the skin in the inset (actual data in the yellow dotted line and its exponential approximation in the gray line). Reprinted with permission from [30].
Figure 10
Figure 10
THz-ATR setup schematic with a smart hydrogel where the incident THz wave from the bottom left-hand side is propelled to the upper interface of the THz-ATR prism in the middle and then generates evanescent waves that penetrate the sample attached to the surface of the prism. The output reflected THz signal shown on the bottom right-hand side contains information about the permittivity of the sample. Hence, the complex permittivity of the samples can be obtained. Reprinted with permission from [45].
Figure 11
Figure 11
Schematic diagram of fluorescent spectroscopy.
Figure 12
Figure 12
System diagram of photoacoustic spectroscopy for non-invasive glucose measurements. Redrawn from reference [5].
Figure 13
Figure 13
Photoacoustic spectroscopy system: (a) schematic diagram, (b) optical micrograph and photoacoustic image of SU-8 structures for resolution evaluation, (c) reflected beam diameter from the parabolic mirror, and (d) PAS peak signal that is located at 47.5 kHz with a reference carbon black tape sample. Reprinted with permission from [14].
Figure 14
Figure 14
Schematic illustration of the Mueller OCT system consisted of a halogen lamp, two photo-detectors, a scanning stage, a scanning stage driver, a dispersion compensator, an oscilloscope, and two nonideal beam splitters. Compensation for the polarization distortion was performed using a composite polarizer component comprising a quarter-wave plate, half-wave plate, and second quarter-wave plate. Reprinted with permission from [62].
Figure 15
Figure 15
Error grids plots: (a) CEG and (b) PEG for glucose monitoring. Reprinted with permission from [13].

References

    1. Kerner W., Brückel J. Definition, classification and diagnosis of diabetes mellitus. Exp. Clin. Endocrinol. Diabetes. 2014;122:384–386. doi: 10.1055/s-0034-1366278. - DOI - PubMed
    1. Association A.D. 2. Classification and Diagnosis of Diabetes: Standards of Medical Care in Diabetes—2018. Diabetes Care. 2018;41:S13–S27. doi: 10.2337/dc18-S002. - DOI - PubMed
    1. Davis B. What Is the Pathophysiology of Diabetes Mellitus? [(accessed on 6 October 2021)]. Available online: https://www.mvorganizing.org/what-is-the-pathophysiology-of-diabetes-mel...
    1. Mahler R.J., Adler M.L. Type 2 Diabetes Mellitus: Update on Diagnosis, Pathophysiology, and Treatment. J. Clin. Endocrinol. Metab. 1999;84:1165–1171. doi: 10.1210/jcem.84.4.5612. - DOI - PubMed
    1. Gonzales W.V., Mobashsher A.T., Abbosh A. The progress of glucose monitoring—A review of invasive to minimally and non-invasive techniques, devices and sensors. Sensors. 2019;19:800. doi: 10.3390/s19040800. - DOI - PMC - PubMed