

Validation of Soft Multipin Dry EEG Electrodes
- PMID: 34696039
- PMCID: PMC8541549
- DOI: 10.3390/s21206827
Validation of Soft Multipin Dry EEG Electrodes
Abstract
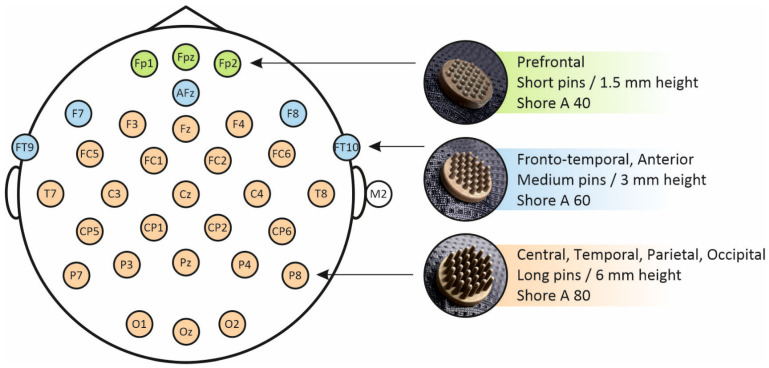
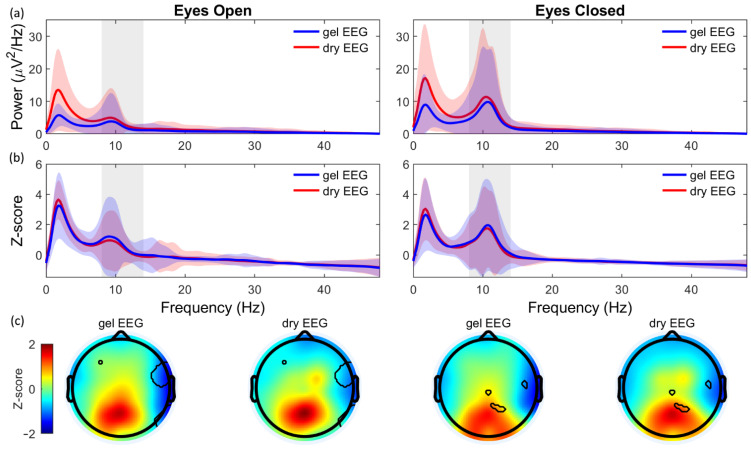
Current developments towards multipin, dry electrodes in electroencephalography (EEG) are promising for applications in non-laboratory environments. Dry electrodes do not require the application of conductive gel, which mostly confines the use of gel EEG systems to the laboratory environment. The aim of this study is to validate soft, multipin, dry EEG electrodes by comparing their performance to conventional gel EEG electrodes. Fifteen healthy volunteers performed three tasks, with a 32-channel gel EEG system and a 32-channel dry EEG system: the 40 Hz Auditory Steady-State Response (ASSR), the checkerboard paradigm, and an eyes open/closed task. Within-subject analyses were performed to compare the signal quality in the time, frequency, and spatial domains. The results showed strong similarities between the two systems in the time and frequency domains, with strong correlations of the visual (ρ = 0.89) and auditory evoked potential (ρ = 0.81), and moderate to strong correlations for the alpha band during eye closure (ρ = 0.81-0.86) and the 40 Hz-ASSR power (ρ = 0.66-0.72), respectively. However, delta and theta band power was significantly increased, and the signal-to-noise ratio was significantly decreased for the dry EEG system. Topographical distributions were comparable for both systems. Moreover, the application time of the dry EEG system was significantly shorter (8 min). It can be concluded that the soft, multipin dry EEG system can be used in brain activity research with similar accuracy as conventional gel electrodes.
Keywords: brain imaging; dry electrodes; electroencephalography (EEG); gel electrodes; validation study.
Conflict of interest statement
The funders had no role in the design of the study; in the collection, analyses, or interpretation of data; in the writing of the manuscript, or in the decision to publish the results. P.F. was employed at ANT Neuro b.v. (Hengelo, The Netherlands) during the design of the study, and not during the period of data analysis and the writing of the manuscript. Moreover, P.F. was not involved in the data collection and data analysis.
Figures


Similar articles
-
Multi-Center Evaluation of Gel-Based and Dry Multipin EEG Caps.Sensors (Basel). 2022 Oct 21;22(20):8079. doi: 10.3390/s22208079. Sensors (Basel). 2022. PMID: 36298430 Free PMC article.
-
Novel Multipin Electrode Cap System for Dry Electroencephalography.Brain Topogr. 2015 Sep;28(5):647-656. doi: 10.1007/s10548-015-0435-5. Epub 2015 May 22. Brain Topogr. 2015. PMID: 25998854
-
A high-density 256-channel cap for dry electroencephalography.Hum Brain Mapp. 2022 Mar;43(4):1295-1308. doi: 10.1002/hbm.25721. Epub 2021 Nov 19. Hum Brain Mapp. 2022. PMID: 34796574 Free PMC article.
-
Review of semi-dry electrodes for EEG recording.J Neural Eng. 2020 Oct 23;17(5):051004. doi: 10.1088/1741-2552/abbd50. J Neural Eng. 2020. PMID: 33002886 Review.
-
State of the Art of Non-Invasive Electrode Materials for Brain-Computer Interface.Micromachines (Basel). 2021 Dec 8;12(12):1521. doi: 10.3390/mi12121521. Micromachines (Basel). 2021. PMID: 34945371 Free PMC article. Review.
Cited by
-
Simultaneous Dry and Gel-Based High-Density Electroencephalography Recordings.Sensors (Basel). 2023 Dec 11;23(24):9745. doi: 10.3390/s23249745. Sensors (Basel). 2023. PMID: 38139591 Free PMC article.
-
Neonatal Electroencephalogram Recording with a Dry Electrode Cap: A Feasibility Study.Sensors (Basel). 2025 Feb 5;25(3):966. doi: 10.3390/s25030966. Sensors (Basel). 2025. PMID: 39943605 Free PMC article.
-
Neurological Outpatients Prefer EEG Home-Monitoring over Inpatient Monitoring-An Analysis Based on the UTAUT Model.Int J Environ Res Public Health. 2022 Oct 13;19(20):13202. doi: 10.3390/ijerph192013202. Int J Environ Res Public Health. 2022. PMID: 36293783 Free PMC article.
-
Active Claw-Shaped Dry Electrodes for EEG Measurement in Hair Areas.Bioengineering (Basel). 2024 Mar 13;11(3):276. doi: 10.3390/bioengineering11030276. Bioengineering (Basel). 2024. PMID: 38534550 Free PMC article.
-
Four-Dimensional Adjustable Electroencephalography Cap for Solid-Gel Electrode.Sensors (Basel). 2025 Jun 28;25(13):4037. doi: 10.3390/s25134037. Sensors (Basel). 2025. PMID: 40648293 Free PMC article.
References
-
- Lazarou I., Nikolopoulos S., Petrantonakis P.C., Kompatsiaris I., Tsolaki M. EEG-Based Brain-Computer Interfaces for Communication and Rehabilitation of People with Motor Impairment: A Novel Approach of the 21 (st) Century. Front. Hum. Neurosci. 2018;12:14. doi: 10.3389/fnhum.2018.00014. - DOI - PMC - PubMed
MeSH terms
Grants and funding
LinkOut - more resources
Full Text Sources
