. 2021 Oct 18;21(20):6891.
doi: 10.3390/s21206891.

Operational Parameters for Sub-Nano Tesla Field Resolution of PHMR Sensors in Harsh Environments

Affiliations

Operational Parameters for Sub-Nano Tesla Field Resolution of PHMR Sensors in Harsh Environments

Taehyeong Jeon et al. Sensors (Basel). .

Abstract

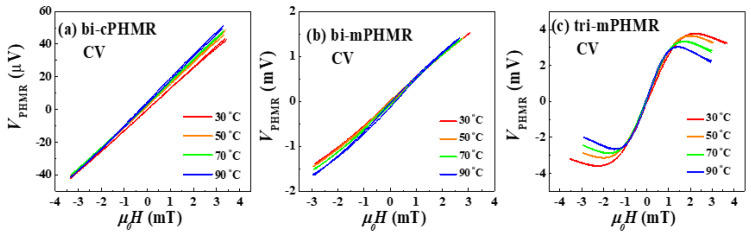
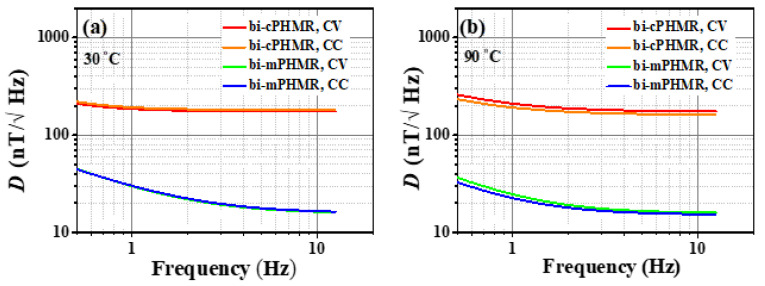
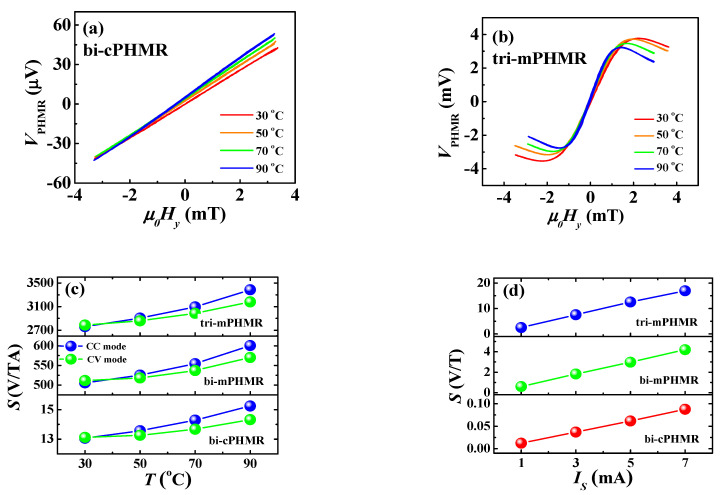
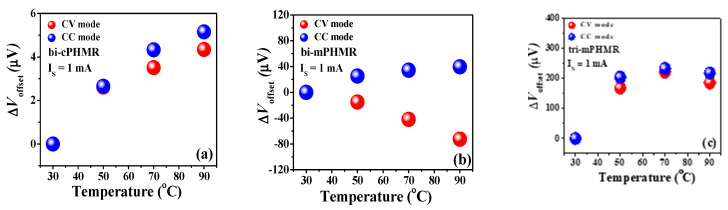
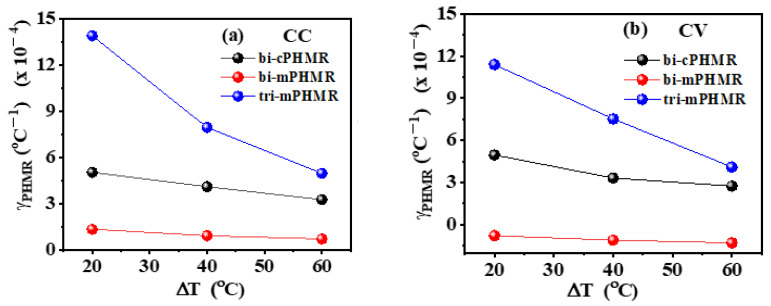
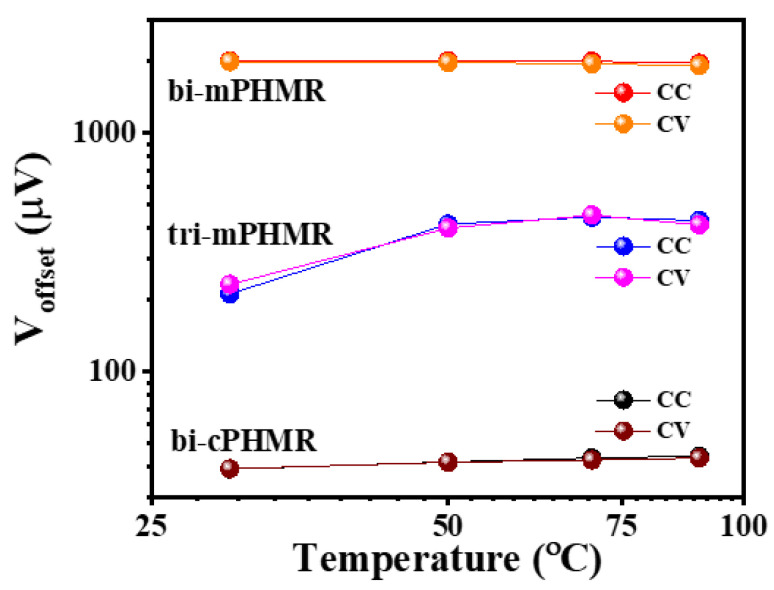
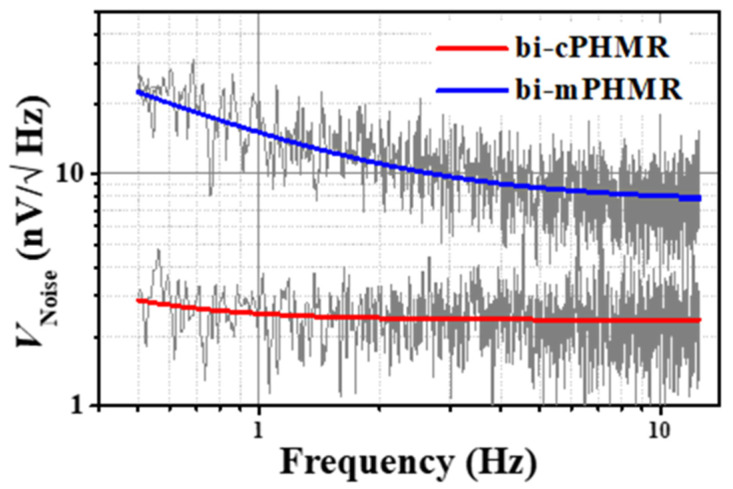
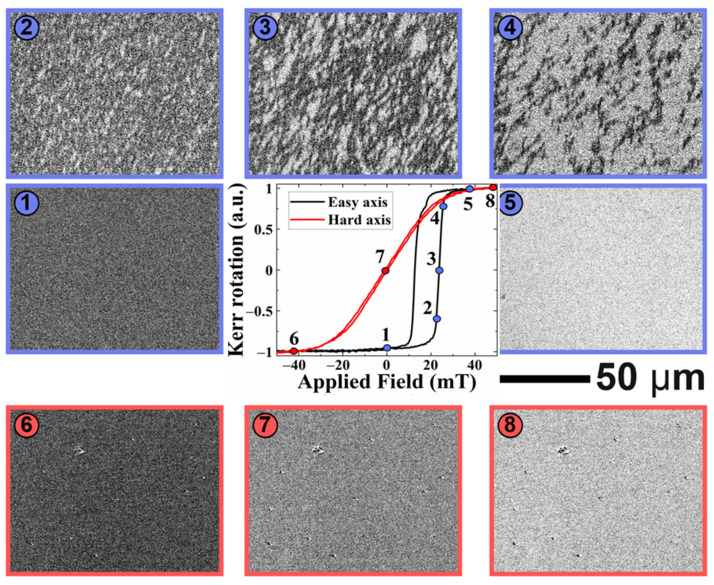
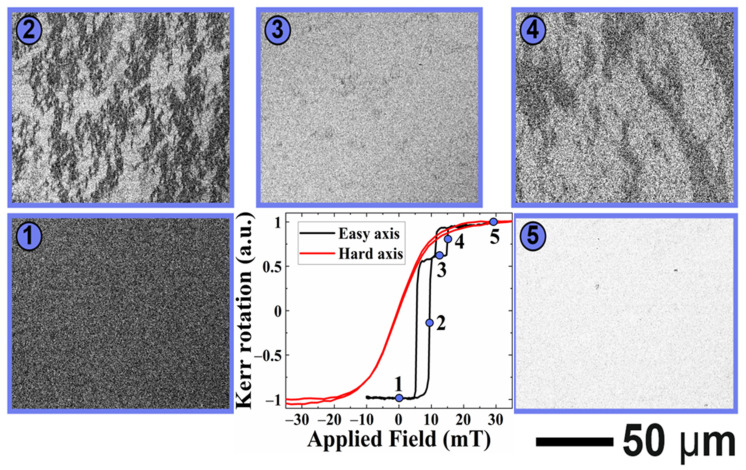
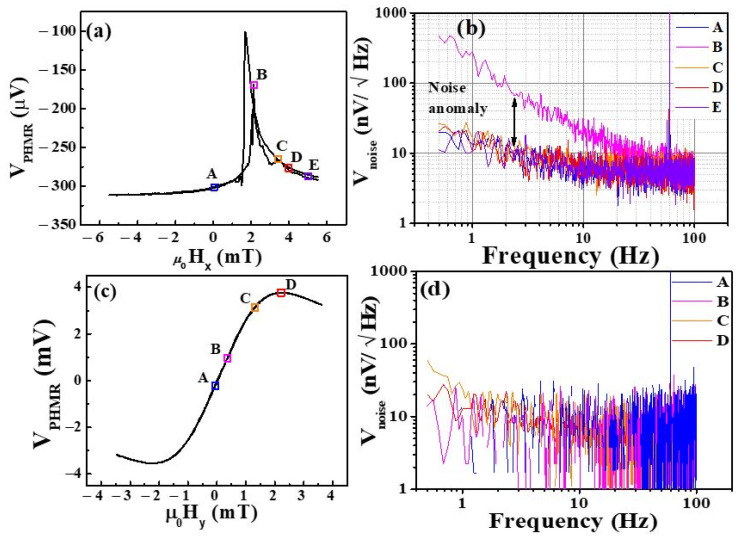
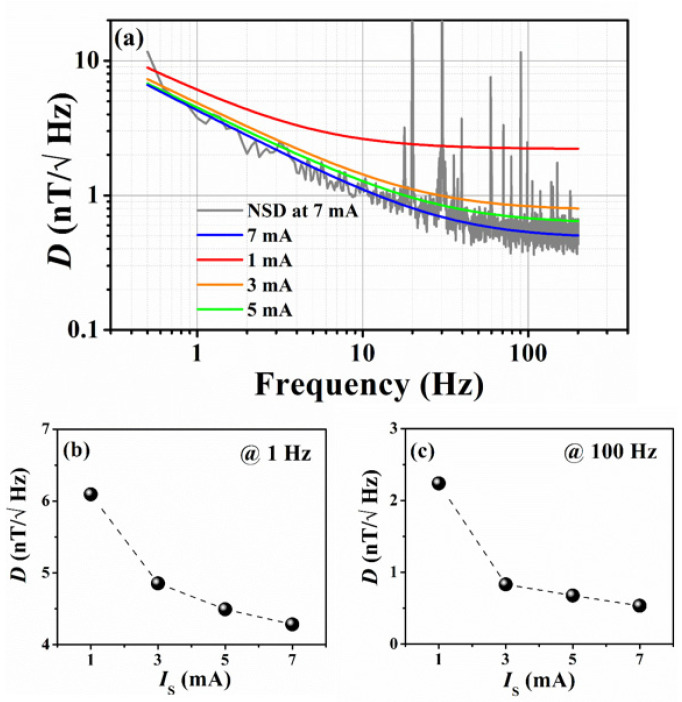
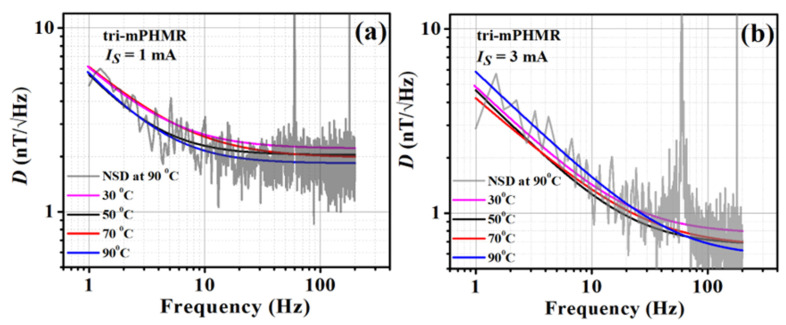
The resolution of planar-Hall magnetoresistive (PHMR) sensors was investigated in the frequency range from 0.5 Hz to 200 Hz in terms of its sensitivity, average noise level, and detectivity. Analysis of the sensor sensitivity and voltage noise response was performed by varying operational parameters such as sensor geometrical architectures, sensor configurations, sensing currents, and temperature. All the measurements of PHMR sensors were carried out under both constant current (CC) and constant voltage (CV) modes. In the present study, Barkhausen noise was revealed in 1/f noise component and found less significant in the PHMR sensor configuration. Under measured noise spectral density at optimized conditions, the best magnetic field detectivity was achieved better than 550 pT/√Hz at 100 Hz and close to 1.1 nT/√Hz at 10 Hz for a tri-layer multi-ring PHMR sensor in an unshielded environment. Furthermore, the promising feasibility and possible routes for further improvement of the sensor resolution are discussed.

Keywords: field detectivity; magnetoresistive sensors; planar-Hall magnetoresistance; sensitivity.


Conflict of interest statement

The authors declare no conflict of interest.

Figures

Figure A1
Figure A1
(ac) Variation of amplified PHMR voltages with temperature for different sensors in CV mode.
Figure A2
Figure A2
(a,b) Field detectivity for bi-layered cPHMR and mPHMR sensors at 30 °C and 90 °C. Equivalent magnetic noise, or detectivity data was fitted with Equation (14). These measurements were carried out to investigate the NSDs’ dependence on CC and CV modes.
Figure 1
Figure 1
Schematic representation of sensitivity estimation from a PHMR signal profile.
Figure 2
Figure 2
Optical microscopic images of (a) bilayer cross-type PHMR (bi-cPHMR) and (b) multi-ring type bi(tri) layer PHMR (mPHMR) sensor. (c) Schematic of the noise measurement setup, including electrical connection and the external field application (μ0Hx,y).
Figure 3
Figure 3
(a,b) Change in PHMR voltage with temperatures in CC mode for bi-cPHMR and tri-mPHMR sensors; (c) sensitivity change with temperature and applied sensing current for 1 mA; (d) sensing current dependence on sensitivity.
Figure 4
Figure 4
(ac) Baseline offset drifts (ΔVBaseline) with temperature change in CC and CV modes.
Figure 5
Figure 5
(a,b) Temperature-dependent variation of γPHMR in CC and CV modes. ΔT refers to the relative temperature increment with respect to room temperature (30 °C).
Figure 6
Figure 6
Sensors offset voltage variation with temperatures. Sensing current was 1 mA.
Figure 7
Figure 7
Measured voltage noise for bi-cPHMR and bi-mPHMR sensors at room temperature. Solid line depicts the fit employing thea02+(a1fγ)2 model. The sensing current was set to 1 mA. The 1/f noise is presented in measured total average noise <15 Hz.
Figure 8
Figure 8
Magnetization reversal loop and magnetic domain evolution in bi-layer structure, measured by Kerr magnetometry with the external magnetic field applied along easy axis μ0Hx (black curve) and along hard axis μ0Hy (red curve).
Figure 9
Figure 9
Magnetization reversal loop and magnetic domain evolution in tri-layer structure measured by Kerr magnetometry with the external magnetic field applied along easy axis (black curve) and along hard axis (red curve).
Figure 10
Figure 10
(a) VPHMR-Hx curve of the tri-mPHMR device. (b) Noise voltage spectra of the tri-mPHMR sensor when the external field was applied in parallel to the sensor easy axis (along x-axis). (c) VPHMR-Hy curve of the tri-mPHMR device. (d) Noise voltage spectra of the tri-mPHMR sensor when the external field was applied transversely to the sensor easy axis (along y-axis). All measurements were performed at room temperature, and the sensing current was set to 1 mA.
Figure 11
Figure 11
(a) Detectivity for tri-mPHMR sensor for different currents in CC mode; recorded room temperature NSD at 7 mA is shown in the background (gray); (b,c) exhibit change in detectivity at 1 Hz and 100 Hz, respectively (with dashed lines as a guide to the eye).
Figure 12
Figure 12
Detectivity plots at different temperatures and the fits employing Equation (14) at two different sensing currents: 1 mA (a) and 3 mA (b). Recorded NSD at 90 °C is shown in the background (gray).

Similar articles

Cited by

References

    1. Makarov A., Windbacher T., Sverdlov V., Selberherr S. CMOS-compatible spintronic devices: A review. Semicond. Sci. Technol. 2016;31:11. doi: 10.1088/0268-1242/31/11/113006. - DOI
    1. Kent A., Worledge D. A new spin on magnetic memories. Nat. Nanotechnol. 2015;10:187–191. doi: 10.1038/nnano.2015.24. - DOI - PubMed
    1. Zhai J., Dong S., Xing Z., Li J., Viehland D. Geomagnetic sensor based on giant magnetoelectric effect. Appl. Phys. Lett. 2007;91:123513. doi: 10.1063/1.2789391. - DOI
    1. Kim H.-S., Seo W., Baek K.-R. Indoor positioning system using magnetic field map navigation and an encoder system. Sensors. 2017;17:651. doi: 10.3390/s17030651. - DOI - PMC - PubMed
    1. Zuo S., Heidari H., Farina D., Nazarpour K. Miniaturued magnetic sensors for implantable magnetomyography. Adv. Mater. Tech. 2020;5:2000185. doi: 10.1002/admt.202000185. - DOI