. 2021 Oct 19;21(20):6934.
doi: 10.3390/s21206934.

Prediction of In Vivo Laser-Induced Thermal Damage with Hyperspectral Imaging Using Deep Learning

Affiliations

Prediction of In Vivo Laser-Induced Thermal Damage with Hyperspectral Imaging Using Deep Learning

Martina De Landro et al. Sensors (Basel). .

Abstract

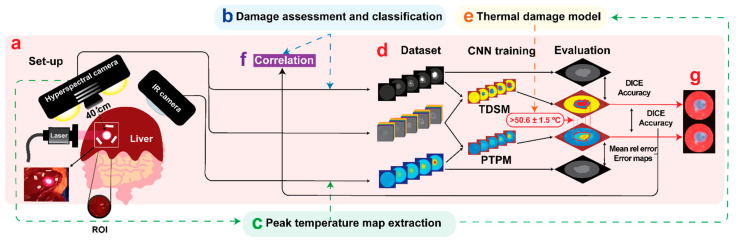
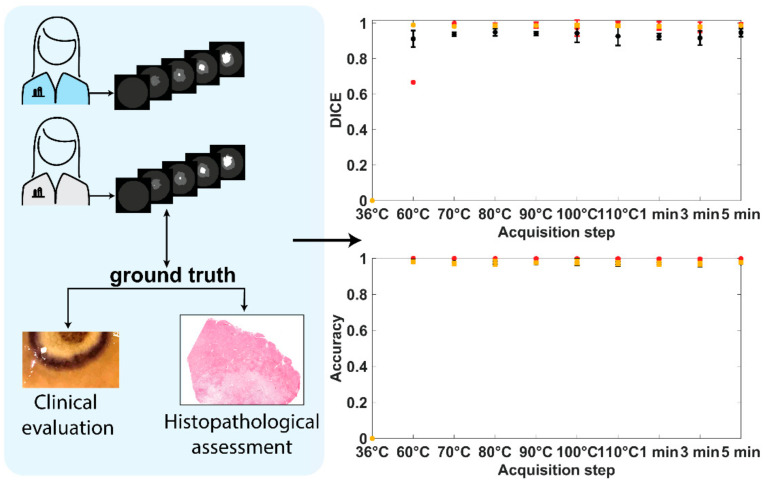
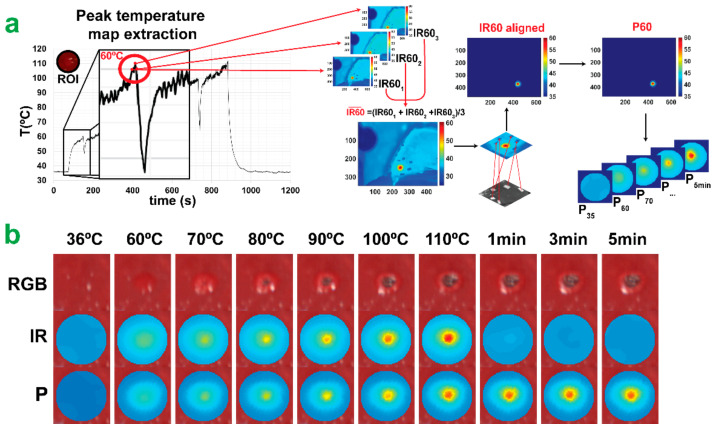
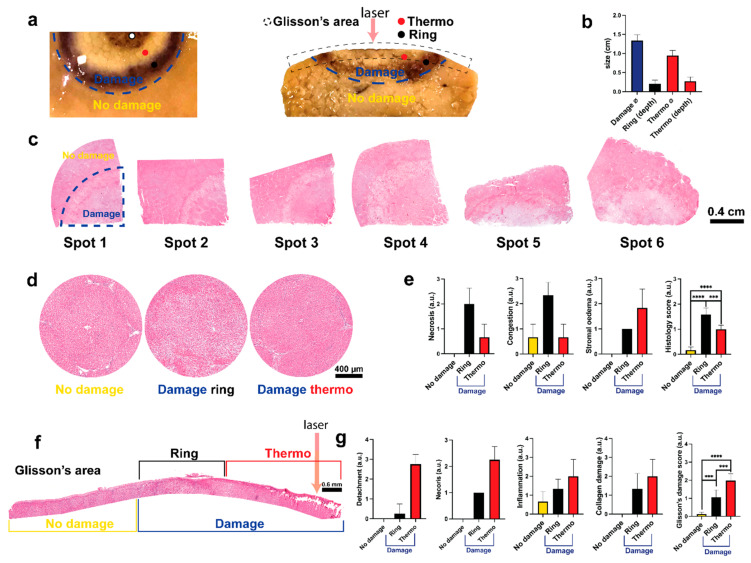
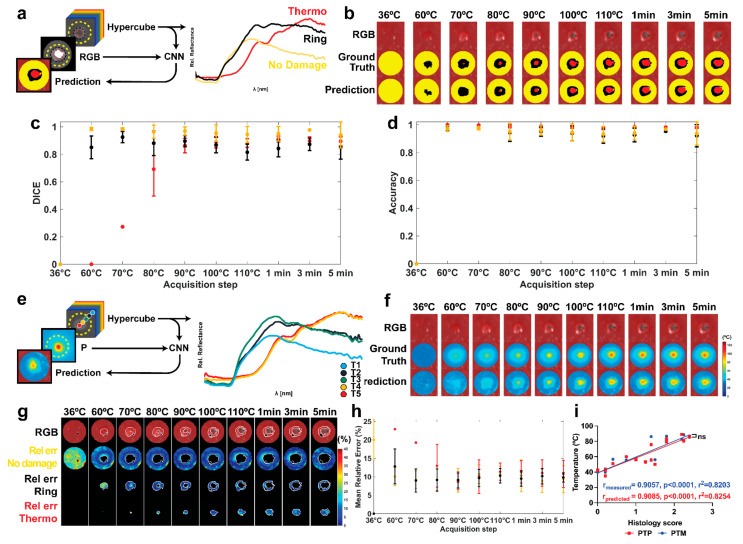
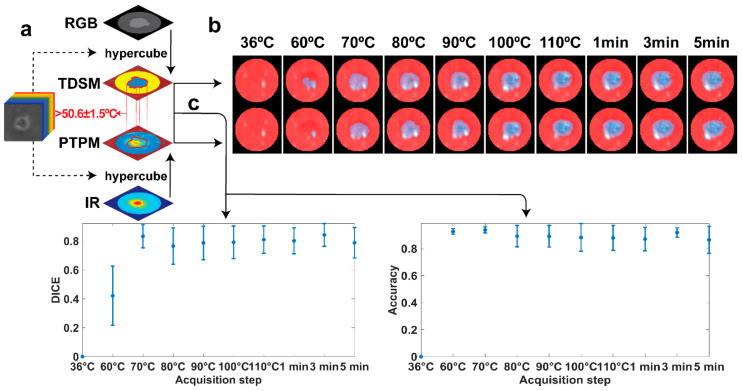
Thermal ablation is an acceptable alternative treatment for primary liver cancer, of which laser ablation (LA) is one of the least invasive approaches, especially for tumors in high-risk locations. Precise control of the LA effect is required to safely destroy the tumor. Although temperature imaging techniques provide an indirect measurement of the thermal damage, a degree of uncertainty remains about the treatment effect. Optical techniques are currently emerging as tools to directly assess tissue thermal damage. Among them, hyperspectral imaging (HSI) has shown promising results in image-guided surgery and in the thermal ablation field. The highly informative data provided by HSI, associated with deep learning, enable the implementation of non-invasive prediction models to be used intraoperatively. Here we show a novel paradigm "peak temperature prediction model" (PTPM), convolutional neural network (CNN)-based, trained with HSI and infrared imaging to predict LA-induced damage in the liver. The PTPM demonstrated an optimal agreement with tissue damage classification providing a consistent threshold (50.6 ± 1.5 °C) for the damage margins with high accuracy (~0.90). The high correlation with the histology score (r = 0.9085) and the comparison with the measured peak temperature confirmed that PTPM preserves temperature information accordingly with the histopathological assessment.

Keywords: convolutional neural network; deep learning; hyperspectral imaging; in vivo experiments; infrared imaging; laser ablation; remote sensing; thermal damage; thermal damage prediction.


Conflict of interest statement

The authors declare no conflict of interest. The funders had no role in the design of the study; in the collection, analyses, or interpretation of data; in the writing of the manuscript, or in the decision to publish the results.

Figures

Figure A1
Figure A1
Schematic of the analysis performed and metrics calculated to validate peak temperature maps as a thermal damage mode.
Figure 1
Figure 1
(a) The experimental setup. The laser ablation procedure was performed on the in vivo pig liver surface. The ablation progress was recorded by HS and IR cameras. A circular ROI centered on the ablation spot was defined in the images and used in the CNN implementation. The data collected during the experiment were used to obtain the final dataset for training the TDSM and PTPM. (b) TDSM dataset creation. Starting from the damage assessment of the histology, RGB images collected from the HS camera were manually annotated. (c) PTPM dataset creation. Extraction of peak temperature maps from the IR camera video. (d) The TDSM was trained with supervised learning using hypercubes and damage zone annotations obtained from the RGB images. The PTPM was trained with supervised learning using the hypercubes and peak temperature maps extracted from IR video. The two models were trained and tested using pixels in the ROIs. (e) Peak temperature maps were used as a model for thermal damage outcome. (f) The PTPM was validated by applying a linear correlation with histology. (g) As a final step, damage predictions of the two models were compared and the PTPM was validated also using TDSM results. The area of damage in the predicted peak temperature maps was obtained using the threshold of 50.6 ± 1.5 °C.
Figure 2
Figure 2
After laparotomy, liver tissue was irradiated until specific temperature thresholds occurred. The temperature was monitored continuously using the IR video. Once the set temperature threshold was reached, the laser system was switched off and the HS data (hypercube and RGB image) were acquired.
Figure 3
Figure 3
TDSM dataset creation. The manual segmentation was performed by visual inspection based on the color profile. Two annotators were used, and inter-annotator agreement was assessed with DICE and accuracy scores.
Figure 4
Figure 4
Peak temperature map extraction. (a) PTPM dataset creation. Extraction of peak temperature maps (Pi) from IR camera video. (b) The normal RGB is reported with IRi,aligned and Pi images for each acquisition step.
Figure 5
Figure 5
(a) Figure target of the biopsy, frontal and intraparenchymal view. Two classes, “damage” and “no damage”, are visible. Within the “damage” class it is possible to observe two classes: one homogeneous called “ring” and one heterogeneous called “thermo” composed by a white area visible in both views and one by a carbonization which characterizes only the Glisson’s area. (b) Descriptive analysis of the damage size. (c) Frontal view of all the spots. Spots 1 to 4 pig 1, spots 5 and 6 for pig 2. The margin of the damaged area is visible accordingly with the figure target. (d) Macro of the 3 main classes reconstructed with 5 to 10 images 10×. Compared with the “no damage” area, “ring” and “thermo” present a reperfusion and ischemic damage given by the heating transferred by the laser from the Glisson’s to the parenchyma in a radial fashion. (e) Histology score of the parenchymal view. Necrosis, congestion, and stromal oedema are displayed separately and their averages with the sinusoidal dilatation are shown on the right. The three areas are statistically different. (f) Glisson’s area map reconstructed with 9 images 10×. “Thermo” class presents a visible detachment with coagulative necrosis and superficial carbonization of the collagen and parenchyma. (g) Score of the Glisson’s area. Detachment, necrosis, inflammation, and collagen damage are shown separately. Glisson’s damage score represents the average with mesothelium damage. The three areas are statistically different. One-way ANOVA was used. Data are presented as mean ± s.d. and compared to the control, two tailed p-value p ≤ 0.05 was considered statistically significant, *** p ≤ 0.001, **** p ≤ 0.0001. N = 6 (ROIs in 2 pigs). Pictures sampled with microscope Zeiss AXIO scope A1.
Figure 6
Figure 6
(a) Dataset and output of the TDSM, and relative reflectance for each class. (b) The normal RGBs are shown with ground truth and predicted pixel classes within the ROI of the first test. (c) Mean DICE scores for the three classes with standard deviation for all the acquisition steps. (d) Mean accuracy was also measured with standard deviation. (e) Dataset and output of the PTPM, and relative reflectance for several pixels associated with specific temperature value (T1 … T5) provided by the IR camera. (f) The normal RGBs are shown with ground truth and predicted peak temperature maps within the ROI of the first test. Predicted and ground truth temperature values, in the range 0–125 °C, are overlayed to the correspondent RGB images. (g) Maps of the Relerr (%) for the three classes. Damage class borders are highlighted in white on the RGB images. The black spot shows the pixels selected as specularity in the images. (h) MRE % and its standard deviation in the three areas. (i) Linear regression between histology scores and (1) measured peak temperature values (PTM-blue curve), and (2) predicted peak temperature values (PTP-red curve) for the three classes. The parameters resulting from the correlation are also reported.
Figure 7
Figure 7
(a) Scheme demonstrating the approach used to compare the models to define the HSI abilities in margins detection. (b) Masks of damage for the two models overlayed on the RGB images in the ROI for all the acquisition steps of the first test. (c) Mean values and standard deviation for DICE and accuracy parameters defining the match between the two model.

References

    1. Heimbach J.K., Kulik L.M., Finn R.S., Sirlin C.B., Abecassis M.M., Roberts L.R., Zhu A.X., Murad M.H., Marrero J.A. AASLD guidelines for the treatment of hepatocellular carcinoma. Hepatology. 2018;67:358–380. doi: 10.1002/hep.29086. - DOI - PubMed
    1. Chu K.F., Dupuy D.E. Thermal ablation of tumours: Biological mechanisms and advances in therapy. Nat. Rev. Cancer. 2014;14:199–208. doi: 10.1038/nrc3672. - DOI - PubMed
    1. Mullins F., Minton J.P., Hoye R.C., Dearman J.R., McKnight W.B. The effect of high energy laser pulses on the primate liver. Surg. Gynecol. Obstet. 1966;122:727–732. - PubMed
    1. Giorgio A., Tarantino L., de Stefano G., Farella N., Catalano O., Cusati B., Del Viscovo L., Alaia A., Caturelli E. Interstitial laser photocoagulation under ultrasound guidance of liver tumors: Results in 104 treated patients. Eur. J. Ultrasound. 2000;11:181–188. doi: 10.1016/S0929-8266(00)00086-0. - DOI - PubMed
    1. Christophi C., Muralidharan V. Treatment of hepatocellular carcinoma by percutaneous laser hyperthermia. J. Gastroenterol. Hepatol. 2001;16:548–552. doi: 10.1046/j.1440-1746.2001.02477.x. - DOI - PubMed