. 2021 Oct 16;13(10):2085.
doi: 10.3390/v13102085.

Towards a Precision Medicine Approach and In Situ Vaccination against Prostate Cancer by PSMA-Retargeted oHSV

Affiliations

Towards a Precision Medicine Approach and In Situ Vaccination against Prostate Cancer by PSMA-Retargeted oHSV

Andrea Vannini et al. Viruses. .

Abstract

Prostate specific membrane antigen (PSMA) is a specific high frequency cell surface marker of prostate cancers. Theranostic approaches targeting PSMA show no major adverse effects and rule out off-tumor toxicity. A PSMA-retargeted oHSV (R-405) was generated which both infected and was cytotoxic exclusively for PSMA-positive cells, including human prostate cancer LNCaP and 22Rv1 cells, and spared PSMA-negative cells. R-405 in vivo efficacy against LLC1-PSMA and Renca-PSMA tumors consisted of inhibiting primary tumor growth, establishing long-term T immune response, immune heating of the microenvironment, de-repression of the anti-tumor immune phenotype, and sensitization to checkpoint blockade. The in situ vaccination protected from distant challenge tumors, both PSMA-positive and PSMA-negative, implying that it was addressed also to LLC1 tumor antigens. PSMA-retargeted oHSVs are a precision medicine tool worth being additionally investigated in the immunotherapeutic and in situ vaccination landscape against prostate cancers.

Keywords: PSMA; immune checkpoint inhibitors; immunotherapy; in situ vaccine; oncolytic herpes simplex virus; oncolytic virus; prostate cancer; retargeting; vaccination.


Conflict of interest statement

GCF is a minor shareholder in Nouscom. The other authors declare no conflict of interest.

Figures

Figure 1
Figure 1
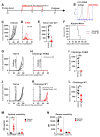
Tropism of R-405 for PSMA-positive cells. (A) Genome organization of R-405. The drawing shows the linear map of R-405 genome. Glycoprotein gB gene carries the insertion of GCN4 peptide [45]. The single peptide murine IL-12 is inserted in the US1-US2 intergenic locus. The gD gene carries the deletion of amino acid 30 and the replacement of amino acid 38 with scFv to PSMA. EGFP (enhanced green fluorescence protein) is inserted in the UL37-UL38 locus. (B). Flow cytometry quantification of PSMA in LNCaP, 22Rv1 and in PC3-PIP cells. Samples were reacted with MAb D2B to PSMA (red lines) or isotype control (black lines), washed twice, then reacted with the secondary antibody Alexa Fluor™ 488 anti-mouse IgG. (C) Flow cytometry quantification of transgenic PSMAΔ in SK-OV-3-PSMA, LLC1-PSMA and Renca-PSMA cells (red lines, details above). The corresponding wt cells were included as control (black lines). (D) Infection of the indicated PSMA-positive cells and lack of infection of PSMA-negative cells by R-405. Infection was detected by EGFP fluorescence. Magnification 100×. (E) Inhibition of R-405 infection by MAb D2B to PSMA (left panel) and by neutralizing MAb 52S to HSV gH (right panel). Dotted line in the right panel: SK-OV-3 cells infected with wt R-LM5. Each column is the average of triplicate samples ± standard deviation (SD). (F) Detection of gD protein in the SK-OV-3-PSMA cells infected with R-LM5 or R-405 viruses by indirect immunofluorescence. SK-OV-3-PSMA were infected with the indicated virus (0.01 PFU/cell); 24 h later, cells were fixed with methanol (this treatment also quenched virus-encoded EGFP), reacted with anti-gD MAb BD80, and with the secondary antibody anti-rabbit DyLight 549. Magnification 600×. (G) Efficiency of gD incorporation in R-405 virions. Purified R-LM5 (lane 1) or R-405 (lane 2) virions were subjected to SDS-PAGE, transferred to nitrocellulose membranes, and visualized by Western blotting with the conformation-independent MAb BD80, directed against C-terminus of gD ectodomain (264–274 aa). gD from R-405 contained the scFv to PSMA and exhibited a lower electrophoretic mobility than wt-gD present in the R-LM5 virus. On the left, the predicted molecular weights of the wt-gD (55 KDa) and scFv(PSMA)-gD (72 KDa) are reported.
Figure 2
Figure 2
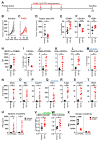
Infectivity, cell-to-cell spread, and cytotoxicity caused by R-405 in different PSMA-positive cell lines. (A) Time course of R-405 replication in the indicated cells lines. Infected cells were harvested at 24, 48, and 72 h after infection at 0.1 PFU/cell, as titrated in the respective cell. Progeny virus was titrated in SK-OV-3-PSMA cells. Each column is the average of triplicate samples ± SD. (B) Efficiency of R-405 infection. Replicate aliquots of R-405 were plated onto SK-OV-3-PSMA, LNCaP, 22RV1, PC3-PIP, Renca-PSMA, and LLC1-PSMA cells. The number of plaques formed in the indicated cell lines is reported as the ratio to the number of plaques formed in SK-OV-3-PSMA cells. (C) Genome copies per PFU values were determined as described [42]. (D) Representative R-405 plaques in the indicated cell lines. (E) Average plaque size of R-405. For each of the indicated cell lines, six pictures were taken, plaque areas were measured by Nis Elements-Imaging software (Nikon) and plotted ± SD. Magnification 100×. (F) Time course of cytotoxic effect of R-405 on the indicated cell lines. Cytotoxicity was determined by AlamarBlue as detailed [21] and expressed at each time point as the percentage of infected relative to uninfected cells. Each column is the average of triplicate samples ± SD.
Figure 3
Figure 3
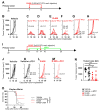
Efficacy of R-405 monotherapy on the growth of LLC1-PSMA tumors. (A) Schedule of treatments. Six-to-eight weeks old C57BL/6 mice were s.c. implanted in the left flank with 1 × 10⁶ LLC1-PSMA cells in 100 μL of PBS, according to [24]. 7 d later, when the tumor volumes averaged 70–100 mm3, mice received 3 intratumoral injections of R-405 (5 × 10⁷ PFUs, diluted in 50 μL PBS) or vehicle (50 μL PBS), at 5 days intervals. At d 33, the R-405-treated mice, which had survived the primary tumor received simultaneously two contralateral challenge tumors made of LLC1-PSMA and LLC1-wt cells (1 × 10⁶/mouse), respectively. (B) Flow cytometry quantification of PSMA in LLC1-PSMA tumors. Single cell suspensions were prepared from freshly isolated LLC1-PSMA tumors at sacrifice and plated. Three days after, non-adherent cells were removed; samples were trypsinized and reacted with MAb D2B to PSMA (red line) or with the isogenic control (black line), washed twice, then reacted with the secondary antibody Alexa Fluor™ 488 anti-mouse IgG. (CE) Kinetics of tumor growth in mice treated with vehicle (C) or R-405 (D). The numbers reported in each panel indicate the numbers of mice which were completely cured from tumors (complete response, CR), or which showed a delay/reduction in tumor growth (partial response, PR). The mice were scored PR when the tumor volume was <50% smaller than the mean size of the tumors in the vehicle group, in at least 2 consecutive measurements. (E) Volumes of the primary tumors at d 21 after implantation. (F) Kaplan-Meier survival curves of the two groups of mice. (GK) Kinetics of growth of challenge tumors in naïve mice (G,J), or in the R-405 survivors’ arm (H,K). Mice received simultaneously LLC1-wt (J,K) and LLC1-PSMA cells (G,H) in the right and left flanks, respectively. No tumor growth and delayed tumor growth are indicated. (I,L) Volumes of challenge tumors. LLC1-PSMA (I); LLC1-wt (L). (M,N) Long-term T and B cell immunity to LLC1-PSMA and LLC1-wt cells. (M) Splenocyte harvested at sacrifice were incubate with LLC1-PSMA or LLC1-wt cells. Reactivity was quantified as IFNγ release. (N) Antibodies to LLC1-PSMA or LLC1-wt cells in sera harvested at sacrifice. Reactivity was measured in CELISA test. (E,I,LN) Circles correspond to individual mice, horizontal line indicates the mean value, and vertical bars ± SD. (E,F,I,LN) Statistical significance was calculated by the t-test (E,I,LN) or by Log-rank (Mantel-Cox) test (F) and expressed as ** = p-value < 0.01; *** = p-value < 0.001; **** = p-value < 0.0001. Color code: mice treated with vehicle or R-337 are indicated in black or red, respectively.
Figure 4
Figure 4
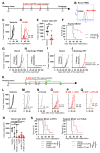
Immune modifications to TME and long-term T and B responses induced by intratumoral R-405 monotherapy. (A). Schedule of treatment. (B,C) Kinetics of tumor growth in C57BL/6 mice treated with vehicle (B) or R-405 (C). (D) Tumor volumes at d 19. (EL) Immune cell populations in tumors. Single cell suspensions were prepared from freshly isolated LLC1-PSMA tumors at sacrifice. For each sample, 2 × 10⁶ cells were blocked with α-CD16/32 Ab, and then reacted with the antibodies CD8a-PE, CD45-PE-Cy7, CD335-PE, FoxP3-PE, CD11b-FITC, CD69-PercP, MHC-I(H-2Kb)-APC, PD-L1-APC, and IFNγ-APC. Data were acquired by means of BD C6 Accuri. CD8 (CD8+ cells), NK (CD335+ cells) and myeloid cells (CD11b+ cells) were gated on CD45+ subpopulation. Activated (CD69+ of IFNγ+) NK cells were gated on CD335+ subpopulation. Tregs (FoxP3+ CD4+) were gated on CD4+ population. MHC-I levels were assayed in cell population gated on PSMA+. (MT) Expression profile of HSV-1 marker, immune related markers, and immune-related transcription factors. Tumor homogenates were employed for total RNA purification and 1.2 µg of RNA was employed for the cDNA synthesis. cDNAs were assayed by real-time PCR with Taqman probes. The levels of expression were determined using the ΔΔCt method, normalized on the Rpl13a housekeeping gene and on the mean of the vehicle-treated group. For panel M, HSV-1 gC values were normalized on the mean of the R-405-treated group. (U) Immune response in splenocytes to LLC1-PSMA and to LLC1-wt cells was quantified as IFNγ secretion in the culture medium. (V,W) Splenocyte reactivity and immune cell populations in spleens. Sample preparation and staining as described for tumors. (X) Serum antibody reactivity to LLC1-PSMA and to LLC1-wt cells. (DX) Circles correspond to individual mice, horizontal line indicates the mean value, and vertical bars ± SD. (DX) Statistical significance was calculated by the t-test and expressed as * = p-value < 0.05; ** = p-value < 0.01; *** = p-value < 0.001; **** = p-value < 0.0001. Color code: mice treated with vehicle or R-337 are indicated in black or red, respectively.
Figure 5
Figure 5
Therapeutic effects of R-405 in combination with anti-PD-1 antibody on the growth of LLC1-PSMA tumors. (A) Schedule of the monotherapy treatments. Mice were implanted with LLC1-PSMA cells. At d 7 after implantation, when tumors reached the average volume of 70–100 mm3, mice received 2 i.t. injections of R-405 at indicated dosages ranging from 5 × 10⁷ to 2 × 10⁵ PFUs or vehicle at 7 d time interval. (BH) Tumor growth curves at indicated dosages. (I) Schedule of the combination treatments. Mice received two i.t. injections of R-405 at 7 d interval and 4 i.p. injections of anti-PD-1 at 3–4 d intervals. (JM) Tumor growth curves in mice receiving the monotherapies or combination treatment. Figures in panels indicate the number of mice exhibiting complete response (CR) or partial response (PR). (N) Volumes of the primary tumors at d 24 after implantation. Circles correspond to individual mice, horizontal line indicates the mean value, and vertical bars ± SD. (O) Kaplan-Meier survival curves of the four indicated groups of mice. (N,O) Statistical significance was calculated by means of the ANOVA test with Tukey’s correction (N) or Log-rank (Mantel-Cox) test with Bonferroni’s correction (O), and expressed as * = p-value < 0.05; ** = p-value < 0.01; *** = p-value < 0.001. Color codes: mice treated with vehicle (black) or R-337 (red). Full circles and continuous lines, monotherapies. Open circles and dotted lines, combination therapies.
Figure 6
Figure 6
Efficacy of R-405 monotherapy and combination therapies on the growth of Renca-PSMA tumors. (A) Schedule of monotherapy treatment. Mice were s.c. implanted in the left flank with 1 × 10⁶ Renca-PSMA cells in 100 μL of PBS. 16 d later, when the tumor volumes averaged 70–100 mm3, mice received 4 intratumoral injections of R-405, 1 × 10⁸ PFUs each, diluted in 50 μL PBS or vehicle (50 μL PBS), at 4-5 days intervals. At d 51, the R-405-treated mice that survived the primary tumor received simultaneously two contralateral challenge tumors made of Renca-PSMA and Renca-wt cells (1 × 10⁶/mouse), respectively. (B) Flow cytometry quantification of PSMA in Renca-PSMA tumors. Samples were prepared as detailed in Figure 3. (C,D) Kinetics of tumor growth in mice treated with vehicle (C), or R-405 (D). The numbers reported in each panel indicate the numbers of mice which exhibited C.R. or P.R. (E) Volumes of the primary tumors at d 37 after implantation. (F) Kaplan-Meier survival curves of the two groups of mice. (GJ). Tumor growth curves in mice implanted with challenge tumors made of Renca-PSMA (G,H) or Renca-wt cells (I,J). (K) Schedule of combination treatments. Mice received 3 i.t. injections of R-405 at 4–5 d interval and 3 i.p. injections of the ICI at the indicated time interval. (LQ) tumor growth curves in mice receiving vehicle, the indicated monotherapies or combination therapies. (R) Tumor volumes at d 30 in the six groups of mice. (S) Kaplan-Meier survival curves of the indicated groups of mice. (E,R) Circles correspond to individual mice, horizontal line indicates the mean value, and vertical bars ± SD. (E,F,R,S) Statistical significance was calculated by means of the ANOVA test with Tukey’s correction (R), Log-rank (Mantel-Cox) test (F), Log-rank (Mantel-Cox) test with Bonferroni’s correction (S), or t-test (E), and expressed as * = p-value < 0.05; ** = p-value < 0.01; *** = p-value < 0.001. Color codes: mice treated with vehicle (black) or R-337 (red). Full circles and continuous lines, monotherapies. Open circles and dashed lines, combination therapies with anti-PD-1; open diamonds and dotted lines, combination therapies with anti-CTLA4.

References

    1. WHO—Latest Global Cancer Data: Cancer Burden Rises to 18.1 Million New Cases and 9.6 Million Cancer Deaths in 2018. [(accessed on 12 September 2018)]. Available online: https://www.who.int/cancer/PRGlobocanFinal.pdf.
    1. The Global Cancer Observatory—All Cancers. [(accessed on 1 December 2020)]. Available online: https://gco.iarc.fr/today/data/factsheets/cancers/39-All-cancers-fact-sh....
    1. Cooperberg M.R., Moul J.W., Carroll P.R. The changing face of prostate cancer. J. Clin. Oncol. Off. J. Am. Soc. Clin. Oncol. 2005;23:8146–8151. doi: 10.1200/JCO.2005.02.9751. - DOI - PubMed
    1. Goswami S., Aparicio A., Subudhi S.K. Immune checkpoint therapies in prostate cancer. Cancer J. 2016;22:117. doi: 10.1097/PPO.0000000000000176. - DOI - PMC - PubMed
    1. Cheever M.A., Higano C.S. PROVENGE (Sipuleucel-T) in prostate cancer: The first FDA-approved therapeutic cancer vaccine. Clin. Cancer Res. 2011;17:3520–3526. doi: 10.1158/1078-0432.CCR-10-3126. - DOI - PubMed

Publication types