Comparative Study
. 2021 Oct 25;21(1):487.
doi: 10.1186/s12870-021-03266-1.

Alternative splicing regulation appears to play a crucial role in grape berry development and is also potentially involved in adaptation responses to the environment

Affiliations
Comparative Study

Alternative splicing regulation appears to play a crucial role in grape berry development and is also potentially involved in adaptation responses to the environment

Pascale Maillot et al. BMC Plant Biol. .

Abstract

Background: Alternative splicing (AS) produces transcript variants playing potential roles in proteome diversification and gene expression regulation. AS modulation is thus essential to respond to developmental and environmental stimuli. In grapevine, a better understanding of berry development is crucial for implementing breeding and viticultural strategies allowing adaptation to climate changes. Although profound changes in gene transcription have been shown to occur in the course of berry ripening, no detailed study on splicing modifications during this period has been published so far. We report here on the regulation of gene AS in developing berries of two grapevine (Vitis vinifera L.) varieties, Gewurztraminer (Gw) and Riesling (Ri), showing distinctive phenotypic characteristics. Using the software rMATS, the transcriptomes of berries at four developmental steps, from the green stage to mid-ripening, were analysed in pairwise comparisons between stages and varieties.

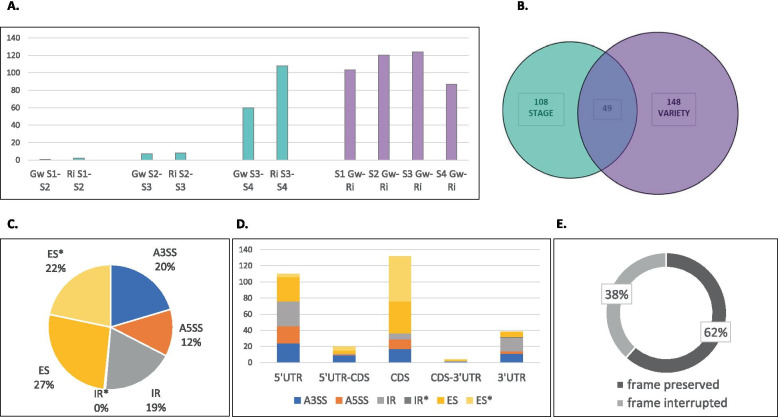
Results: A total of 305 differential AS (DAS) events, affecting 258 genes, were identified. Interestingly, 22% of these AS events had not been reported before. Among the 80 genes that underwent the most significant variations during ripening, 22 showed a similar splicing profile in Gw and Ri, which suggests their involvement in berry development. Conversely, 23 genes were subjected to splicing regulation in only one variety. In addition, the ratios of alternative isoforms were different in Gw and Ri for 35 other genes, without any change during ripening. This last result indicates substantial AS differences between the two varieties. Remarkably, 8 AS events were specific to one variety, due to the lack of a splice site in the other variety. Furthermore, the transcription rates of the genes affected by stage-dependent splicing regulation were mostly unchanged, identifying AS modulation as an independent way of shaping the transcriptome.

Conclusions: The analysis of AS profiles in grapevine varieties with contrasting phenotypes revealed some similarity in the regulation of several genes with developmental functions, suggesting their involvement in berry ripening. Additionally, many splicing differences were discovered between the two varieties, that could be linked to phenotypic specificities and distinct adaptive capacities. Together, these findings open perspectives for a better understanding of berry development and for the selection of grapevine genotypes adapted to climate change.

Keywords: Abiotic stress; Adaptive traits; Alternative splicing regulation; Fruit development; Grapevine.


Conflict of interest statement

The authors declare that they have no competing interests.

Figures

Fig. 1
Fig. 1
DAS events detected during berry development in Gw and Ri. a Number of differential events detected in each comparison between consecutive stages: S1 (green berry at 6 weeks post-flowering) vs S2 (hard berry at mid-véraison), S2 vs S3 (soft berry at mid-véraison) and S3 vs S4 (mid-ripening), as well as between the two varieties at each stage. b Relationship between the set of stage-regulated AS events and the set of AS events showing differential isoform ratios between Gw and Ri. c Distribution by AS type of the 305 unique DAS events identified in all comparisons: A3SS, A5SS, ES, IR, ES* and IR* (ES and IR not included in the VCost.v3 annotation). d Localization of the AS events of different types in the CDS or in the 3′- and 5′-UTRs. e Percentage of AS events localized in the CDS that preserve or not the reading frame
Fig. 2
Fig. 2
Similar regulation between Gw and Ri of an ES event in the CDS of (a) XBAT35 and (b) CNOT9. The Sashimi plots showing RNAseq reads aligned to gene annotations at S2 (hard berry at mid-véraison), S3 (soft berry at mid-véraison) and S4 (mid-ripening) are respectively color-coded in red, blue and green. The arrows indicate the position of the skipped exons. The transcript variants included in the VCost.v3 annotation are presented as dark blue exon-plots: exons as solid lines and introns as dashed lines
Fig. 3
Fig. 3
Similar regulation between Gw and Ri of two AS events in the 5’UTR of MAN2. Enhancement of an ES event between S1 (green berry at 6 weeks post-flowering) and S2 (hard berry at mid-véraison), followed by the down-regulation of an IR event between S3 (soft berry at mid-véraison) and S4 (mid-ripening). The Sashimi plots showing RNAseq reads aligned to gene annotations at S1, S2, S3 and S4 are respectively color-coded in orange, red, blue and green. The arrows respectively indicate the position of the skipped exon and of the retained intron. The transcript variants included in the VCost.v3 annotation are presented as dark blue exon-plots: exons as solid lines and introns as dashed lines
Fig. 4
Fig. 4
Variety-specific AS events associated with the gain or loss of a splice site. For each event, the arrow indicates the position of the SNP involved in the gain or loss of a splice site, by reference to the canonical GT (5′-donor) -and AG (3′-acceptor) sequences. The Sashimi plots showing RNAseq reads aligned to gene annotations are respectively color-coded in red for Gw and blue for Ri. The transcript variants included in the VCost.v3 genome annotation are presented as dark blue exon-plots: exons as solid lines and introns as dashed lines. The table under each plot summarizes, from top to bottom, first line: the gene ID, the region affected (3′-UTR, 5′-UTR orCDS), and the genomic location of the SNP, in brackets; second line: the nucelotide sequence at the position of the splice site in each variety (the specific nucleotide is in bold red font); third line: the splice site modification linked to the SNP and the specific alternative isoform (or specific event) produced

References

    1. van Leeuwen C, Destrac-Irvine A, Dubernet M, Duchêne E, Gowdy M, Marguerit E, et al. An update on the impact of climate change in viticulture and potential adaptations. Agronomy. 2019;9:514.
    1. Gomès E, Maillot P, Duchêne E. Molecular Tools for Adapting Viticulture to Climate Change. Front Plant Sci. 2021;12:133. - PMC - PubMed
    1. Conde C, Silva PF, Fontes N, Dias ACP, Tavares RM, Sousa MJ, et al. Biochemical changes throughout grape berry development and fruit and wine quality. Food. 2007;1:1–22.
    1. Deluc LG, Grimplet J, Wheatley MD, Tillett RL, Quilici DR, Osborne C, et al. Transcriptomic and metabolite analyses of Cabernet Sauvignon grape berry development. BMC Genomics. 2007;8:429. - PMC - PubMed
    1. Wang L, Sun X, Weiszmann J, Weckwerth W. System-level and granger network analysis of integrated proteomic and metabolomic dynamics identifies key points of grape berry development at the interface of primary and secondary metabolism. Front Plant Sci. 2017;8:1066. - PMC - PubMed

Publication types