

Colon Cancer Progression Is Reflected to Monotonic Differentiation in Gene Expression and Pathway Deregulation Facilitating Stage-specific Drug Repurposing
- PMID: 34697067
- PMCID: PMC8569813
- DOI: 10.21873/cgp.20295
Colon Cancer Progression Is Reflected to Monotonic Differentiation in Gene Expression and Pathway Deregulation Facilitating Stage-specific Drug Repurposing
Abstract
Background/aim: Colon cancer is one of the most common cancer types and the second leading cause of death due to cancer. Many efforts have been performed towards the investigation of molecular alterations during colon cancer progression. However, the identification of stage-specific molecular markers remains a challenge. The aim of this study was to develop a novel computational methodology for the analysis of alterations in differential gene expression and pathway deregulation across colon cancer stages in order to reveal stage-specific biomarkers and reinforce drug repurposing investigation.
Materials and methods: Transcriptomic datasets of colon cancer were used to identify (a) differentially expressed genes with monotonicity in their fold changes (MEGs) and (b) perturbed pathways with ascending monotonic enrichment (MEPs) related to the number of the participating differentially expressed genes (DEGs), across the four colon cancer stages. Through an in silico drug repurposing pipeline we identified drugs that regulate the expression of MEGs and also target the resulting MEPs.
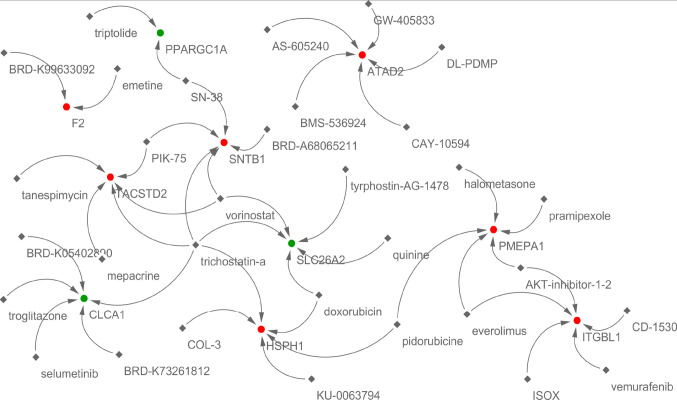
Results: Our methodology highlighted 15 MEGs and 32 candidate repurposed drugs that affect their expression. We also found 51 MEPs divided into two groups according to their rate of DEG content alteration across colon cancer stages. Focusing on the target MEPs of the highlighted repurposed drugs, we found that one of them, the neuroactive ligand-receptor interaction, was targeted by the majority of the candidate drugs. Moreover, we observed that two of the drugs (PIK-75 and troglitazone) target the majority of the resulting MEPs.
Conclusion: These findings highlight significant genes and pathways that can be used as stage-specific biomarkers and facilitate the discovery of new potential repurposed drugs for colon cancer. We expect that the computational methodology presented can be applied in a similar way to the analysis of any progressive disease.
Keywords: Monotonically expressed genes; colon cancer progression; colon cancer staging; drug repurposing; monotonically enriched pathways.
Copyright© 2021, International Institute of Anticancer Research (Dr. George J. Delinasios), All rights reserved.
Conflict of interest statement
The Authors declare no conflicts of interest.
Figures


Similar articles
-
Molecular docking and machine learning analysis of Abemaciclib in colon cancer.BMC Mol Cell Biol. 2020 Jul 8;21(1):52. doi: 10.1186/s12860-020-00295-w. BMC Mol Cell Biol. 2020. PMID: 32640984 Free PMC article.
-
Identification of differentially expressed genes regulated by methylation in colon cancer based on bioinformatics analysis.World J Gastroenterol. 2019 Jul 14;25(26):3392-3407. doi: 10.3748/wjg.v25.i26.3392. World J Gastroenterol. 2019. PMID: 31341364 Free PMC article.
-
Screening key genes and miRNAs in early-stage colon adenocarcinoma by RNA-sequencing.Tumour Biol. 2017 Jul;39(7):1010428317714899. doi: 10.1177/1010428317714899. Tumour Biol. 2017. PMID: 28714374
-
Integration of genetic variants and gene network for drug repurposing in colorectal cancer.Pharmacol Res. 2020 Nov;161:105203. doi: 10.1016/j.phrs.2020.105203. Epub 2020 Sep 17. Pharmacol Res. 2020. PMID: 32950641
-
Repurposed Drugs as Potential Therapeutic Candidates for the Management of Alzheimer's Disease.Curr Drug Metab. 2017;18(9):842-852. doi: 10.2174/1389200218666170607101622. Curr Drug Metab. 2017. PMID: 28595531 Review.
Cited by
-
In silico approaches for drug repurposing in oncology: a scoping review.Front Pharmacol. 2024 Jun 11;15:1400029. doi: 10.3389/fphar.2024.1400029. eCollection 2024. Front Pharmacol. 2024. PMID: 38919258 Free PMC article.
-
Luteolin Protects Against 6-Hydoroxydopamine-Induced Cell Death via an Upregulation of HRD1 and SEL1L.Neurochem Res. 2024 Jan;49(1):117-128. doi: 10.1007/s11064-023-04019-2. Epub 2023 Aug 26. Neurochem Res. 2024. PMID: 37632637 Free PMC article.
-
Stage-specific gene pair ratios highlight genes and mechanisms related to presymptomatic and symptomatic Multiple Myeloma.Comput Struct Biotechnol J. 2025 Jul 12;27:3090-3098. doi: 10.1016/j.csbj.2025.07.017. eCollection 2025. Comput Struct Biotechnol J. 2025. PMID: 40703094 Free PMC article.
References
MeSH terms
LinkOut - more resources
Full Text Sources