. 2021 Oct;9(10):e003623.
doi: 10.1136/jitc-2021-003623.

Immune landscape in vulvar cancer-draining lymph nodes indicates distinct immune escape mechanisms in support of metastatic spread and growth

Affiliations

Immune landscape in vulvar cancer-draining lymph nodes indicates distinct immune escape mechanisms in support of metastatic spread and growth

Anne Marijne Heeren et al. J Immunother Cancer. 2021 Oct.

Abstract

Background: Therapeutic immune intervention is highly dependent on the T-cell priming and boosting capacity of tumor-draining lymph nodes (TDLN). In vulvar cancer, in-depth studies on the immune status of (pre)metastatic TDLN is lacking.

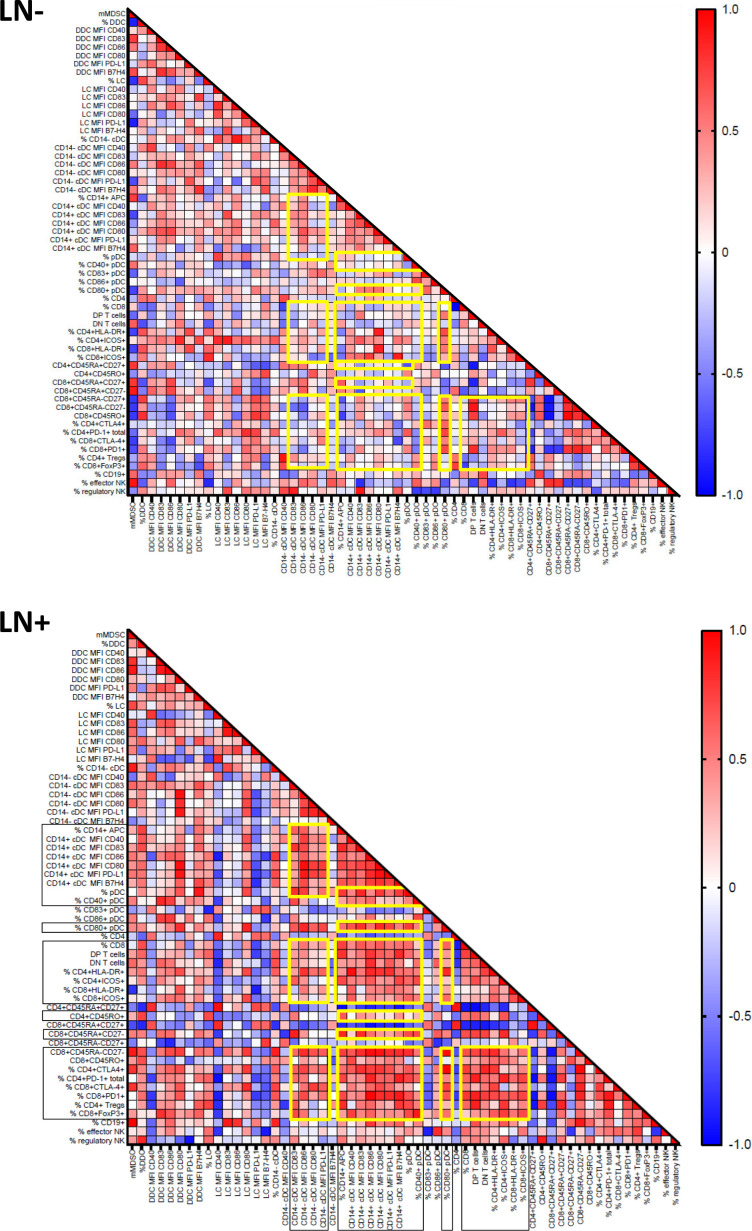
Methods: We have phenotyped and enumerated various T-cell and myeloid subsets in tumor-free (LN-, n=27) and metastatic TDLN (LN+, n=11) using flow cytometry. Additionally, we studied chemokine and cytokine release profiles and assessed expression of indoleamine 2,3-dioxygenase (IDO) in relation to plasmacytoid dendritic cell (pDC) or myeloid subsets.

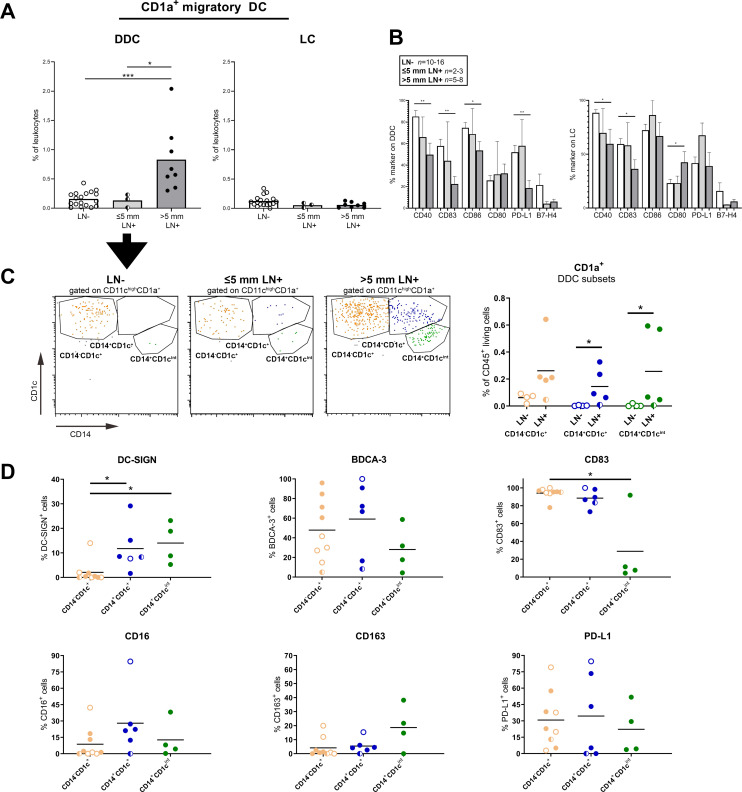
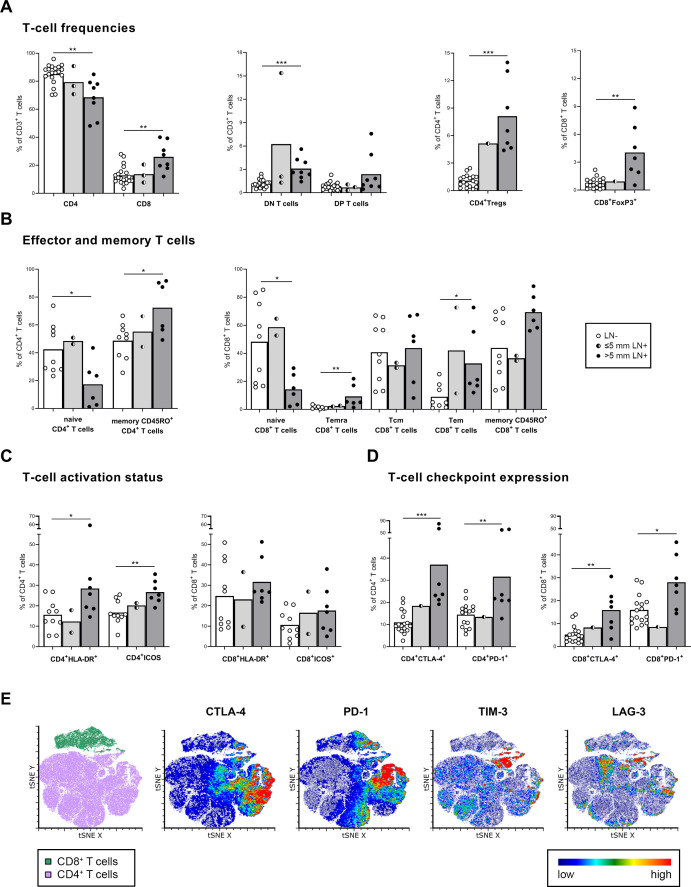
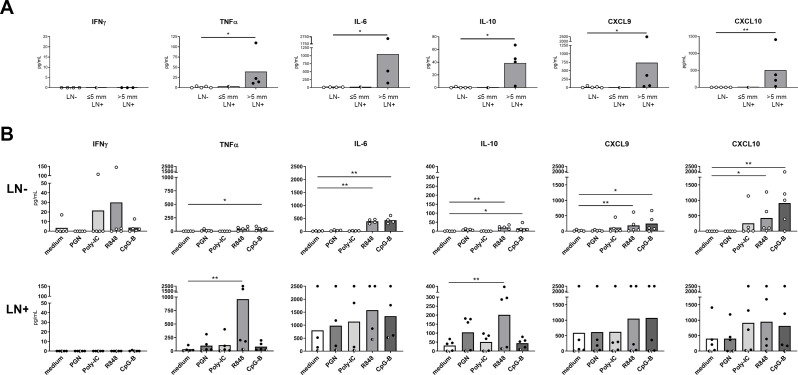
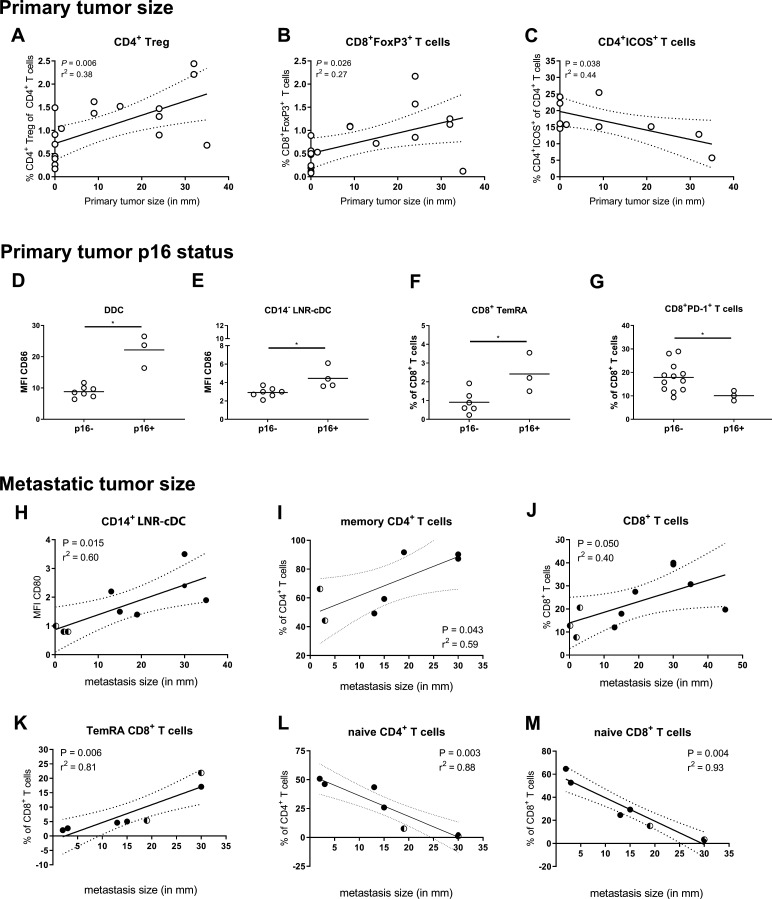
Results: Metastatic involvement of TDLN was accompanied by an inflamed microenvironment with immune suppressive features, marked by hampered activation of migratory DC, increased cytokine/chemokine release, and closely correlated elevations of pDC and LN-resident conventional DC (LNR-cDC) activation state and frequencies, as well as of terminal CD8+ effector-memory T-cell (TemRA) differentiation, regulatory T-cell (Treg) rates, T-cell activation, and expression of cytotoxic T-lymphocyte protein-4 (CTLA-4) and programmed cell death protein-1 (PD-1) immune checkpoints. In addition, high indoleamine 2,3-dioxygenase (IDO) expression and increased frequencies of monocytic myeloid-derived suppressor cells (mMDSC) were observed. Correlation analyses with primary and metastatic tumor burden suggested respective roles for Tregs and suppression of inducible T cell costimulator (ICOS)+ T helper cells in early metastatic niche formation and for CD14+ LNR-cDC and terminal T-cell differentiation in later stages of metastatic growth.

Conclusions: Metastatic spread in vulvar TDLN is marked by an inflamed microenvironment with activated effector T cells, which are likely kept in check by an interplay of suppressive feedback mechanisms. Our data support (neoadjuvant) TDLN-targeted therapeutic interventions based on CTLA-4 and PD-1 blockade, to reinvigorate memory T cells and curb early metastatic spread and growth.

Keywords: T-lymphocytes; cytokines; dendritic cells; myeloid-derived suppressor cells; tumor microenvironment.


Conflict of interest statement

Competing interests: No, there are no competing interests.

Figures

Figure 1
Figure 1
Frequency and phenotype of migratory DC subsets in vulvar TDLN. Frequency and activation state of migratory DC subsets in LN− (white BAR), ≤5 mm LN+ (light gray BAR), and >5 mm LN+ (dark gray BAR). (A) Frequencies of CD1a frequencies of CD1a+ migratory DC subsets (DDC and LC), expressed as percentage of total ln leucocytes. (B) Expression of CD40, CD83, CD86, CD80, PD-L1, and B7-H4 on CD1a) expression of CD40, CD83, CD86, CD80, PD-L1, and B7-H4 on CD1a+ migratory DDC and LC, expressed as percentage of positive cells. (C) Representative flow cytometry dot plots for DDCs (gated first on singlets and CD45+ live cells and on CD1a+CD11chi) in LN-, in ≤5 mm LN+, and in >5 mm ln +identifying three different (CD1a+) DDC populations: CD14-CD1c+, CD14+CD1c+, and CD14+CD1cint. Graph shows frequencies for CD14-CD1c+, CD14+CD1c+-, and CD14+CD1cint DDCs in LN− and LN+, with colors corresponding to the gated populations in the FACS plots. (D) Expression levels ofDC-SIGN, BDCA-3, CD83, CD16, CD163, and PD-L1 on CD1a+CD14-CD1c+-, CD1a+CD14+CD1c+-, and CD1a+CD14+CD1cint- in LN− and LN+, expressed as percentage of positive cells within each subset. Each dot represents a lymph node: open dots LN−, half-closed dots ≤5 mm LN+, and the closed dots >5 mm LN+. *P≤0.05, **p<0.01, and ***p<0.001 by Kruskal-Wallis test, Mann-Whitney U test or unpaired T test in case n<3 for ≤5 mm LN+. Data in A and B were generated using 4-color flow cytometry panels. Data in C and D were generated using 10-color flow cytomtery panels. DC, dendritic cell; DDC, dermal DC; LC, Langerhans cells; LN, lymph nodes; TDLN, tumor-draining LN.
Figure 2
Figure 2
Frequency and phenotype of LNR-DC subsets in TDLN. Frequency and activation state of LNR-DC subsets in LN− (white BAR), ≤5 mm LN+ (light gray BAR), and >5 mm LN+ (dark gray BAR). (A) Frequencies of LNR-cDC subsets (CD14- CDC and CD14+ CDC), expressed as percentage of total ln leucocytes. Expression of CD40, CD86, CD80, PD-L1, and B7-H4 on (B) CD14- and CD14+ cDC, expressed as percentage of positive cells. (C) Representative flow cytometry dot plots for CD14- LNR-cDC (gated first on singlets, CD45+ live cells, and on CD1a-CD11chi) in LN−, in ≤5 mm LN+, and in >5 mm LN+ identifying two different populations based on CD1c expression: CD14-CD1clo and CD14-CD1c+. Graph shows frequencies for CD1a-CD14-CD1clo and CD1a-CD14-CD1c+ cells in LN− and LN+, with colors corresponding to the gated populations in the FACS plots. (D) Representative flow cytometry dot plots for CD14+ CDC (gated first on singlets, CD45+ live cells, and on CD1a-CD11c+CD14+) in LN−, in ≤5 mm LN+, and in >5 mm LN+ identifying two CD1a-CD14+ populations based on CD1c expression: CD14+CD1clo and CD14+CD1c+. Graph shows frequencies for CD14+CD1clo and CD14+CD1c+ DCs in LN− and LN+, with colors corresponding to the gated populations in the FACS plots. (E) Expression of DC-SIGN, BDCA-3, CD83, CD16, CD163, and PD-L1 on CD1a-CD14-CD1clo, CD1a-CD14-CD1c+, CD1a-CD14+CD1clo, and CD1a-CD14+CD1c+ cDC in vulvar TDLN, expressed as percentage of positive cells within each subset. (F) Frequencies of pDC and expression levels of CD40 and CD83 on pDC (both expressed as percentage positive cells). Each symbol represents a lymph node sample: open dots LN−, half-closed dots ≤5 mm LN+, and the closed dots >5 mm LN+. *P≤0.05, **p<0.01, and ***p<0.001 by Kruskal-Wallis test, Mann-Whitney U test or unpaired T test in case n<3 for ≤5 mm LN+. Data in A, B, F were generated using 4-color flow cytometry panels. Data in C, D, E were generated using 10-color flow cytomtery panels. cDC, conventional DC; DC, dendritic cell; FACS, fluorescence activated cell sorting; LN, lymph node; LNR, LN resident; pDC, plasmacytoid DC; TDLN, tumor-draining lymph nodes.
Figure 3
Figure 3
T-cell subset distribution and phenotype in vulvar TDLN. T-cell subset distribution in LN− (white BAR), ≤5 mm LN+ (light gray BAR), and >5 mm LN+ (dark gray BAR). Frequencies of (A) CD4+ and CD8+ T cells (first panel), double-negative (DN, CD4-CD8-) and double-positive (DP, CD4+CD8+) T cells (second panel), CD4+ Tregs (third panel), and FoxP3-expressing CD8+ T cells (fourth panel). (B) Frequencies of naive and memory CD4+ T cells (left panel) and frequencies of naive, effector memory Ra+ (TemRa), central memory (Tcm), effector memory (TEM), and memory-like CD8+ T cells (right panel). (C) expression of activation markers HLA-DR and inducible T cell costimulator (ICOS) on CD4+ (left panel) and CD8+ T cells (right panel). (D) Checkpoint molecule expression of CTLA-4 and PD-1 on CD4+ (left panel) and CD8+ T cells (right panel). Each symbol represents a lymph node sample: open dots LN-, half-closed dots ≤5 mm LN+, and the closed dots >5 mm LN+. *P≤0.05; **p<0.01, and ***p<0.001, measured using Kruskal-Wallis test, Mann-Whitney U test or unpaired t-test in case n<3 for ≤5 mm LN+. (E) t-SNE analysis visualizingCD4+ and CD8+ T-cell distribution and expression levels of checkpoint molecules CTLA-4, PD-1, TIM-3, and LAG-3 in concatenated data sets of two vulvar SLN− and three LN+ samples. Data in A, B, C, D were generated using 4-color flow cytometry panels. Data in E was generated using 11-color flow cytomtery panels. CTLA-4, cytotoxic T-lymphocyte protein-4; LN, lymph nodes; PD-1, programmed cell death protein-1; SLN, sentinel LN; TDLN, tumor-draining LN; TIM-3, T cell immunoglobulin mucin-3; t-SNE, t-distributed stochastic neighbor embedding.
Figure 4
Figure 4
Cytokine and chemokine release profiles in vulvar TDLN. (A) Cytokine/chemokine release (in pg/mL) of IFNγ, TNFα, IL-6, IL10, and CXCL9 and CXCL10 in single-cell suspensions from LN−, ≤5 mm and >5 mm LN+ on 24 hours in vitro culture. (B) Cytokine/chemokine release (in pg/mL) of IFNγ, TNFα, IL-6, IL10, CXCL9 and CXCL10 in single-cell suspensions from LN-, ≤5 mm and >5 mm LN+ on 24 hours in vitro culture with the indicated TLR agonists. Each symbol represents a lymph node sample: open dots LN-, half-closed dots ≤5 mm LN+, and the closed dots >5 mm LN+. *P≤0.05 and **p<0.01 measured using Kruskal-Wallis test or Mann-Whitney U test or unpaired t-test in case n<3 for ≤5 mm LN+. IFNγ, interferon γ; IL-6, interleukin 6; LN, lymph nodes; TDLN, tumor-draining LN; TLR, toll-like receptor; TNFα, tumor necrosis factor-α.
Figure 5
Figure 5
Immune subset frequencies and activation state in relation to primary tumor size and p16 status, or metastatic tumor size. Scatter plots show the correlation of the frequency of (A) CD4 CD4+ Treg, (B) CD8 CD8+FoxP3+ T cells, and (C) CD4+ICOS+ T cells in LN− to the size (in millimeters, MM) of the primary tumor measured after surgery by a pathologist. Median Fluorescence Index (MFI) of CD86 on (D) DDC and on (E) CD14- LNR-cDC in LN− from patients with p16- primary tumors compared with patients with p16+ primary tumors. Percentages of (F) CD8+ TemRA and (G) CD8+PD-1+ T cells in LN− from patients with p16- primary tumors compared with patients with p16+ primary tumors. (H) Scatter plots show the MFI of CD80 on CD14+ LNR-cDC in ≤5 mm LN+ (black-white dots) and >5 mm LN+ (black dots) correlated to the size of lymph node metastasis in millimeters (mm) measured after surgery by a pathologist. Scatter plots show the frequency of (I) memory CD4+ T cells, (J) CD8+ T cells, (K) TemRA CD8+, (L) naïve CD4+ T cells, and (M) naïve CD8+ T cells in ≤5 mm LN+ (half-closed dots) and >5 mm LN+ (closed dots) correlated to the size of lymph node metastasis. Each symbol represents a lymph node sample. Dotted lines represent 95% CI of the regression line. *P≤0.05, measured using Mann-Whitney U test. Data was generated using 4-color flow cytometry panels. cDC, conventional DC; DDC, dermal dendritic cell; LN, lymph nodes; LNR, LN resident; TemRA, effector-memory T-cell.
Figure 6
Figure 6
Association between immune-cell subsets in vulvar cancer-draining lymph nodes (LN). Correlation matrices showing correlation coefficients between vulvar TDLN immune subsets in LN− and in (≤5 mm and >5 mm) LN+ as heat map. Yellow boxes highlight concerted correlations in LN+ between DC and T-cell subsets or activation marker or immune checkpoint expression levels. Data were generated using four-color flow cytometry panels. APC, antigen-presenting cell; cDC, conventional DC; DC, dendritic cell; DDC, dermal DC; MDSC, myeloid-derived suppressor cells; MFI, Median Fluorescence Index; NK, natural killer; TDLN, tumor-draining KN.

References

    1. Hoang LN, Park KJ, Soslow RA, et al. . Squamous precursor lesions of the vulva: current classification and diagnostic challenges. Pathology 2016;48:291–302. 10.1016/j.pathol.2016.02.015 - DOI - PMC - PubMed
    1. Burger MP, Hollema H, Emanuels AG, et al. . The importance of the groin node status for the survival of T1 and T2 vulval carcinoma patients. Gynecol Oncol 1995;57:327–34. 10.1006/gyno.1995.1151 - DOI - PubMed
    1. Mahner S, Jueckstock J, Hilpert F, et al. . Adjuvant therapy in lymph node-positive vulvar cancer: the AGO-CaRE-1 study. J Natl Cancer Inst 2015;107. 10.1093/jnci/dju426. [Epub ahead of print: 24 01 2015]. - DOI - PMC - PubMed
    1. Daayana S, Elkord E, Winters U, et al. . Phase II trial of imiquimod and HPV therapeutic vaccination in patients with vulval intraepithelial neoplasia. Br J Cancer 2010;102:1129–36. 10.1038/sj.bjc.6605611 - DOI - PMC - PubMed
    1. Kenter GG, Welters MJP, Valentijn ARPM, et al. . Vaccination against HPV-16 oncoproteins for vulvar intraepithelial neoplasia. N Engl J Med 2009;361:1838–47. 10.1056/NEJMoa0810097 - DOI - PubMed

Publication types