. 2021 Oct 26;10(10):71.
doi: 10.1038/s41389-021-00359-2.

Dissecting the single-cell transcriptome network in patients with esophageal squamous cell carcinoma receiving operative paclitaxel plus platinum chemotherapy

Affiliations

Dissecting the single-cell transcriptome network in patients with esophageal squamous cell carcinoma receiving operative paclitaxel plus platinum chemotherapy

Zhencong Chen et al. Oncogenesis. .

Abstract

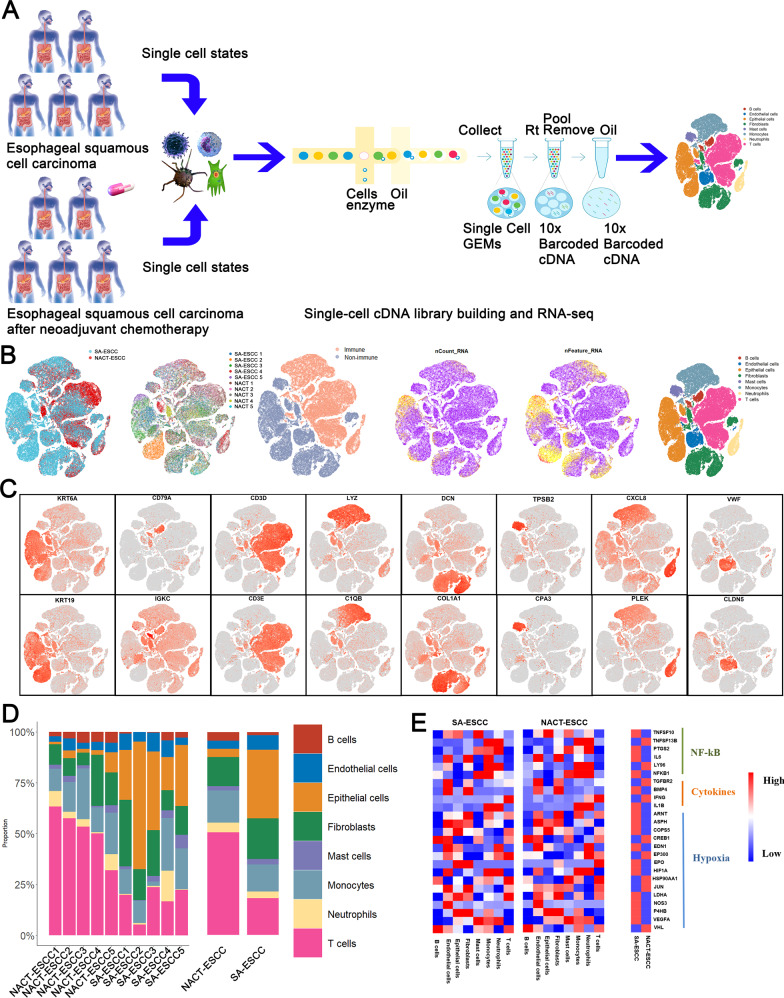
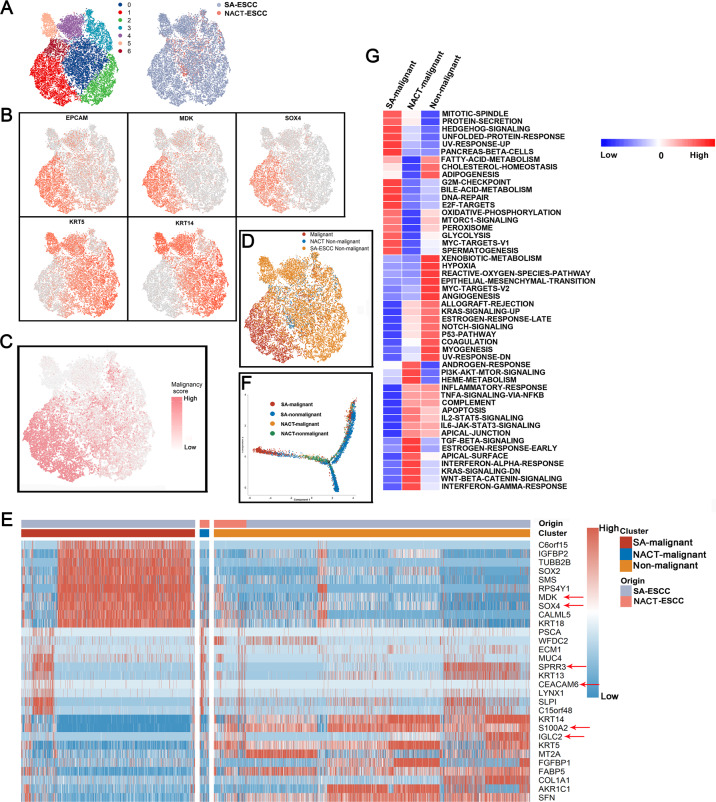
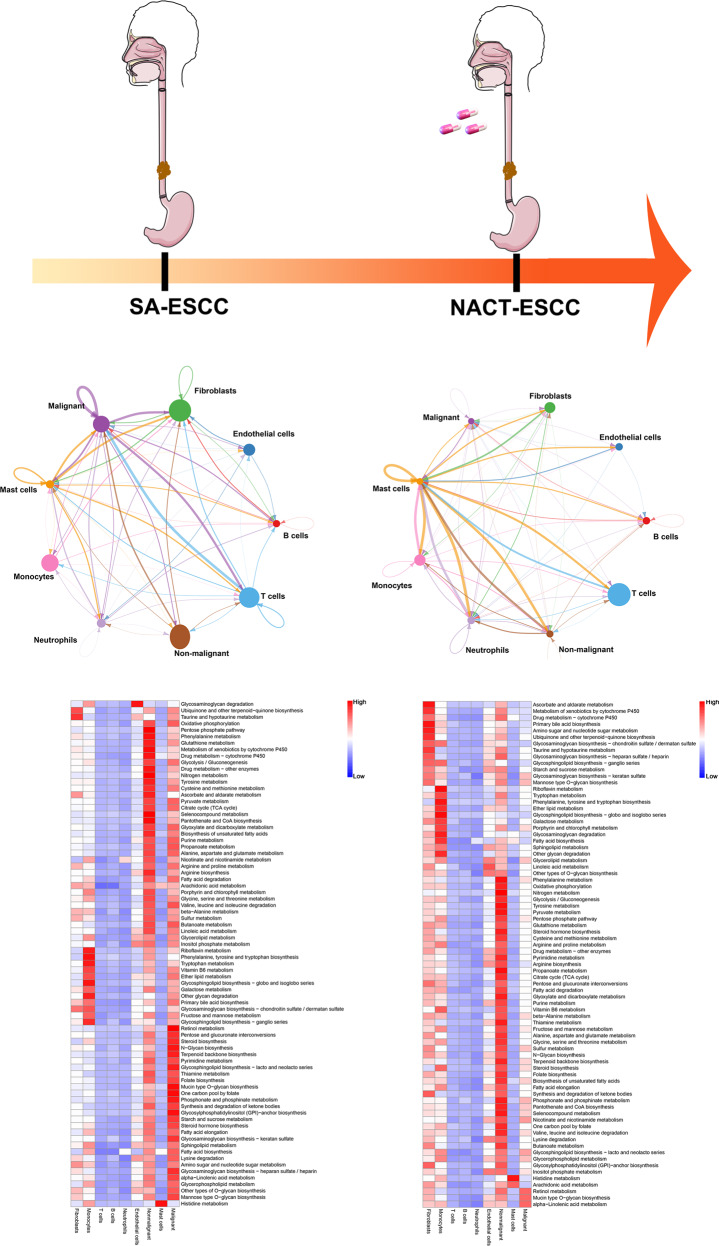
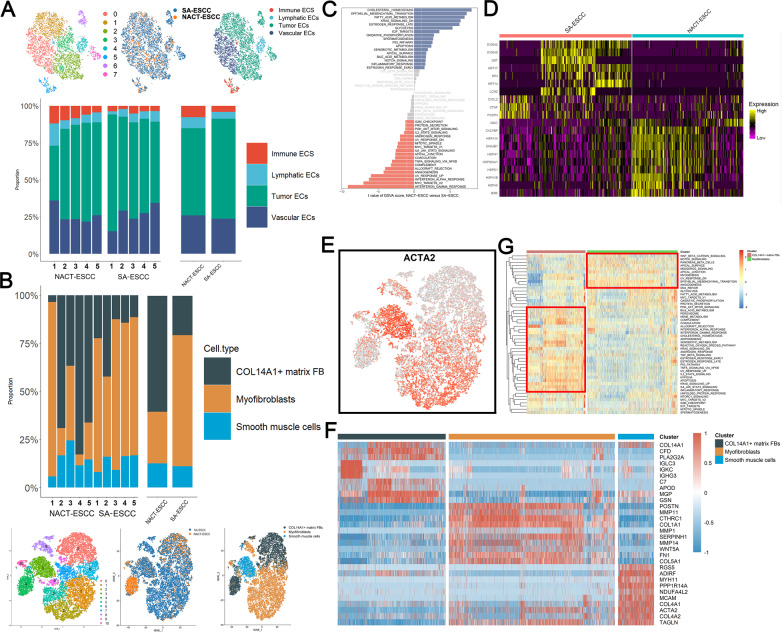
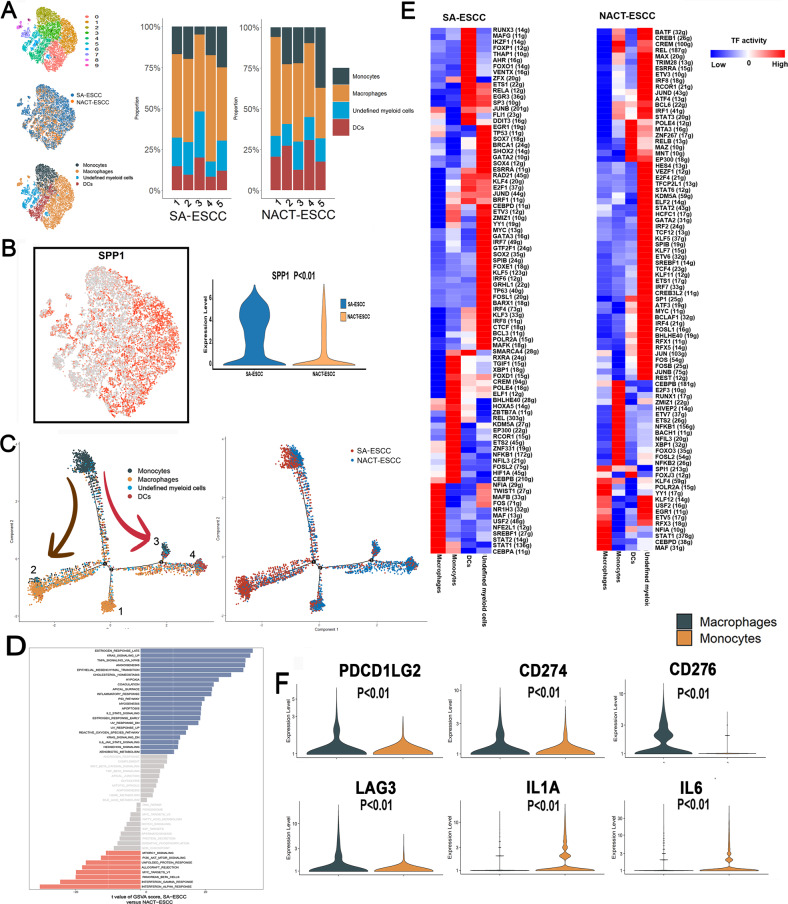
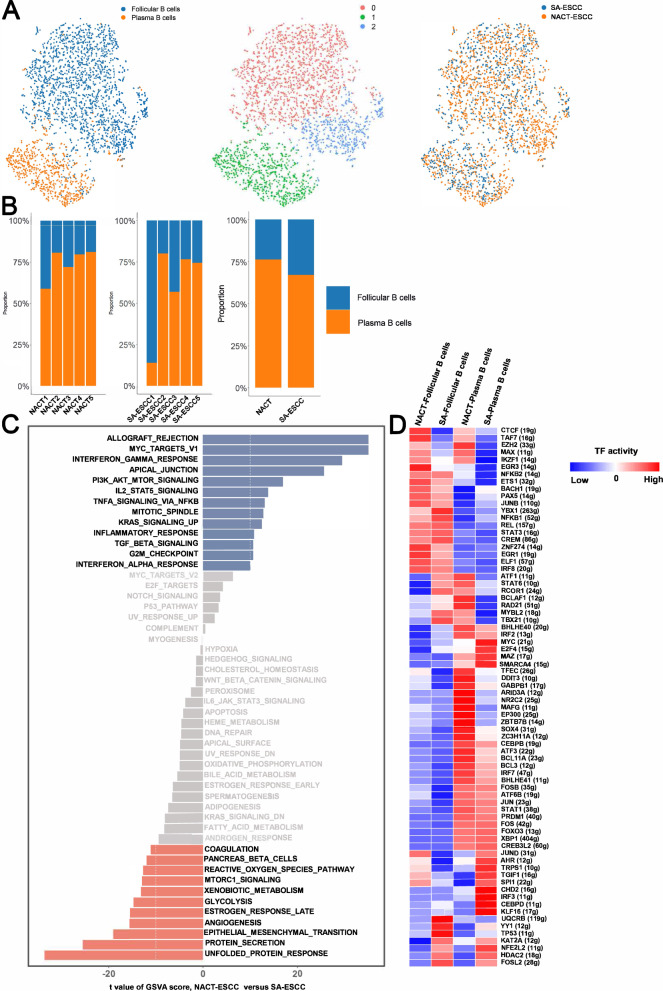
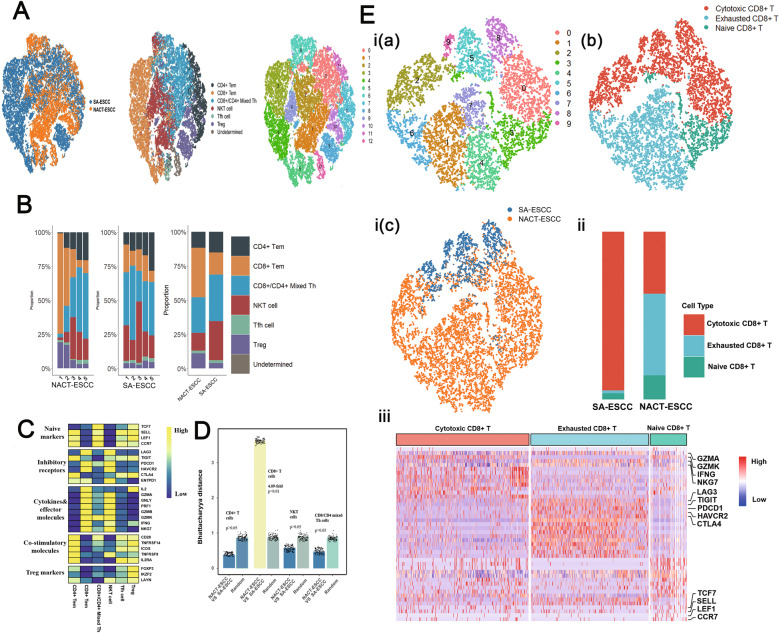
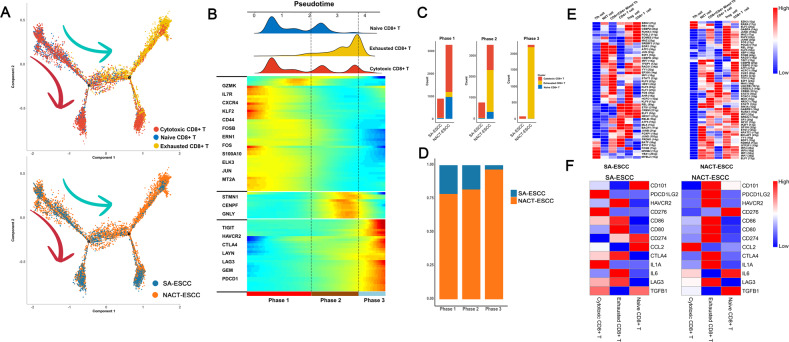
Esophageal squamous cell carcinoma (ESCC) accounts for 90% of all cases of esophageal cancers worldwide. Although neoadjuvant chemotherapy (NACT-ESCC) improves the survival of ESCC patients, the five-year survival rate of these patients is dismal. The tumor microenvironment (TME) and tumor heterogeneity decrease the efficacy of ESCC therapy. In our study, 113,581 cells obtained from five ESCC patients who underwent surgery alone (SA-ESCC) and five patients who underwent preoperative paclitaxel plus platinum chemotherapy (NACT-ESCC), were used for scRNA-seq analysis to explore molecular and cellular reprogramming patterns. The results showed samples from NACT-ESCC patients exhibited the characteristics of malignant cells and TME unlike samples from SA-ESCC patients. Cancer cells from NACT-ESCC samples were mainly at the 'intermediate transient stage'. Stromal cell dynamics showed molecular and functional shifts that formed the immune-activation microenvironment. APOE, APOC1, and SPP1 were highly expressed in tumor-associated macrophages resulting in anti-inflammatory macrophage phenotypes. Levels of CD8+ T cells between SA-ESCC and NACT-ESCC tissues were significantly different. Immune checkpoints analysis revealed that LAG3 is a potential immunotherapeutic target for both NACT-ESCC and SA-ESCC patients. Cell-cell interactions analysis showed the complex cell-cell communication networks in the TME. In summary, our findings elucidate on the molecular and cellular reprogramming of NACT-ESCC and ESCC patients. These findings provide information on the potential diagnostic and therapeutic targets for ESCC patients.


Conflict of interest statement

The authors declare no competing interests.

Figures

Fig. 1
Fig. 1. A Single-Cell Atlas of SA-ESCC and NACT-ESCC.
A The workflow showing the collection and processing of specimens from SA-ESCC and NACT-ESCC tissues for scRNA-seq analysis. B TSNE of 113,581 cells, each cell has a color code. From left to right are: origin of sample type (SA-ESCC or NACT-ESCC), the corresponding patient, immune type, transcript counts, transcript features, and associated cell type. C Expression of marker genes for each cell subtype. D The proportion of each cell type in SA-ESCC and NACT-ESCC samples. E Heatmap of representative genes in cytokines, nuclear factor-kB (NF-kB), and hypoxia signaling pathways mapped onto cell types in SA-ESCC and NACT-ESCC samples.
Fig. 2
Fig. 2. The single-cell transcriptomes of epithelial cells in non-malignant and malignant esophagus.
A The TSNE plot and overview of the 90,606 epithelial cells, each cell has color code for its cluster and origin of sample type. B Expression of marker genes for each epithelial subtype. C The TSNE plot of epithelial cells colored based on the malignancy scores of the cells. D The TSNE plot of epithelial cells colored based on the cell type. E Expression of marker genes for SA-malignant, NACT-malignant, and Non-malignant cells. F Unsupervised transcriptional trajectory of malignant and normal epithelial cells from Monocle2 colored by cell type. G Differences in pathway activities scored per cell by GSVA among different epithelial cells subtypes. Normalized pathways scores.
Fig. 3
Fig. 3. The single-cell transcriptome network underlying SA-ESCC and NACT-ESCC conditions.
Cellular and molecular changes from SA-ESCC to NACT-ESCC. Top: The cell-cell communication networks constructed using CellPhoneDB. The nodes stand for each epithelial cell type in SA-ESCC and NACT-ESCC tissue, and the thickness of edges in the network denotes the correlation coefficient between each cell type. Bottom: Epithelial cell type-specific metabolic reprogramming based on scRNA-seq data under SA-ESCC and NACT-ESCC patients.
Fig. 4
Fig. 4. The scRNA Profiles for Stromal Cell Lineages in SA-ESCC and NACT-ESCC.
A The TSNE plot and the proportion of endothelial cells in SA-ESC and NACT-ESCC samples. B The TSNE plot and proportion of fibroblasts in SA-ESC and NACT-ESCC samples. C Differences in pathway activities scored per cell by GSVA among immune EDCs under SA-ESCC and NACT-ESCC conditions. Normalized pathways scores. D Heatmap showing the activity of marker genes of immune EDCs in SA-ESCC and NACT-ESCC conditions. E Feature plot of ACTA2 in fibroblasts. F Heatmap showing the activity of marker genes in each fibroblasts subtypes. (G) Differences in pathway activities scored per cell by GSVA among COL14A1+ matrix fibroblasts and myofibroblasts. Normalized pathways scores.
Fig. 5
Fig. 5. The scRNA Profiles for myeloid cells in SA-ESCC and NACT-ESCC.
A The TSNE plot and the proportion of myeloid cells in SA-ESC and NACT-ESCC samples. B Feature plot and violin plot of SPP1. C Potential developmental trajectory of myeloid cells inferred by analysis with Monocle2. D Differences in pathway activities scored per cell by GSVA among macrophages in SA-ESCC and NACT-ESCC conditions. Normalized pathways scores. E Heatmap showing the activity of TFs in each myeloid cell subtypes in NACT-ESCC and SA-ESCC, respectively. The TF activity is scored using AUCell. F Violin plots of immune checkpoints upregulated or downregulated between monocytes and macrophages cells.
Fig. 6
Fig. 6. The scRNA Profiles for B cells in SA-ESCC and NACT-ESCC.
A The TSNE plot of B cells in SA-ESC and NACT-ESCC samples. B The proportion of each B cell subtypes in SA-ESCC and NACT-ESCC samples. C GSVA analysis in plasma B cells from different conditions. D Heatmap showing the activity of TFs in each B cell subtypes in each condition. The TF activity is scored using AUCell.
Fig. 7
Fig. 7. The scRNA Profiles for T cells in SA-ESCC and NACT-ESCC.
A The TSNE plot of T cells in SA-ESC and NACT-ESCC samples. B The proportion of each T cell subtypes in SA-ESCC and NACT-ESCC samples. C Average expression of selected T cell function-associated genes of naïve markers, inhibitory receptors, cytokines and effector molecules, co-stimulatory molecules, and Treg markers in each T cell subtype. D Quantification of differences between major T cell subtypes in NACT-ESCC and SA-ESCC. Each dot stands for a subsample of 500 cells from PCA space for NACT-ESCC and SA-ESCC or a sample of 500 cells from a random group. The height of the bar is the mean of the subsample. E The overview of CD8+ T cells. I, the TSNE plot of CD8+ T cells with each colored by its clusters (a), the associated cell type (b), and sample type of origin (SA-ESCC or NACT-ESCC) (c). II, the proportion of each CD8+ T cell subtypes in SA-ESCC and NACT-ESCC samples. III, heatmap of marker genes of each CD8+ T cell subtypes.
Fig. 8
Fig. 8. The scRNA Profiles for CD8+ T cells in SA-ESCC and NACT-ESCC.
A Potential developmental trajectory of CD8+ T cells inferred by analysis with Monocle2. B Dynamic changes in gene expression of CD8+ T cells during the transition (divided into 3 phases), subtypes are labeled by colors (upper panel). C Histogram showing the cell distribution of CD8+ T cells, in SA-ESCC and NACT-ESCC samples. CD8 subtypes labeled by colors. D Histogram showing the cell distribution of SA-ESCC and NACT-ESCC samples. E Heatmap showing the activity of TFs in each CD8+ T cell subtypes in each condition. The TF activity is scored using AUCell. Left, SA-ESCC. Right, NACT-ESCC. F Heatmap showing the activity of immune checkpoints in each T cell subtypes in each condition. Left, SA-ESCC. Right, NACT-ESCC.

References

    1. Abnet CC, Arnold M, Wei W-Q. Epidemiology of esophageal squamous cell carcinoma. Gastroenterology. 2018;154:360–73. - PMC - PubMed
    1. Bray F, Ferlay J, Soerjomataram I, Siegel RL, Torre LA, Jemal A. Global cancer statistics 2018: GLOBOCAN estimates of incidence and mortality worldwide for 36 cancers in 185 countries. CA Cancer J Clin. 2018;68:394–424. - PubMed
    1. Li R, Li P, Xing W, Qiu H. Heterogeneous genomic aberrations in esophageal squamous cell carcinoma: a review. Am J Transl Res. 2020;12:1553–68. - PMC - PubMed
    1. Rustgi AK, El-Serag HB. Esophageal carcinoma. N Engl J Med. 2014;371:2499–509. - PubMed
    1. Yamasaki M, Yasuda T, Yano M, Hirao M, Kobayashi K, Fujitani K, et al. Multicenter randomized phase II study of cisplatin and fluorouracil pl us docetaxel (DCF) compared with cisplatin and fluorouracil plus Adria mycin (ACF) as preoperative chemotherapy for resectable esophageal squamous cell carcinoma (OGSG1003) Ann Oncol. 2017;28:116–20. - PubMed