. 2021 Oct 25;12(1):6160.
doi: 10.1038/s41467-021-26421-6.

Pparg signaling controls bladder cancer subtype and immune exclusion

Affiliations

Pparg signaling controls bladder cancer subtype and immune exclusion

Tiffany Tate et al. Nat Commun. .

Abstract

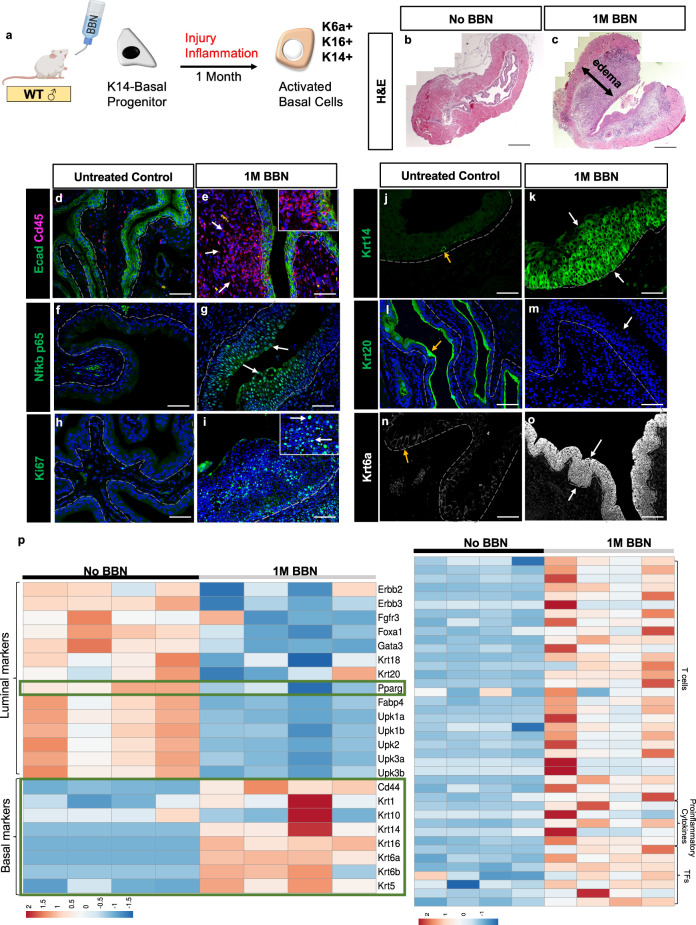
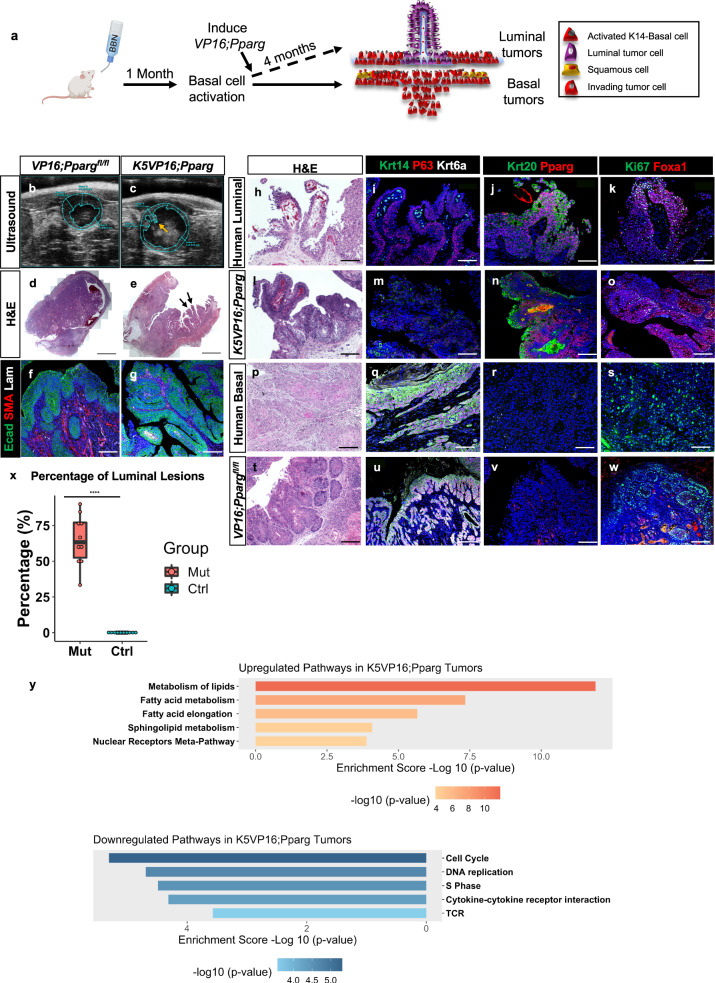
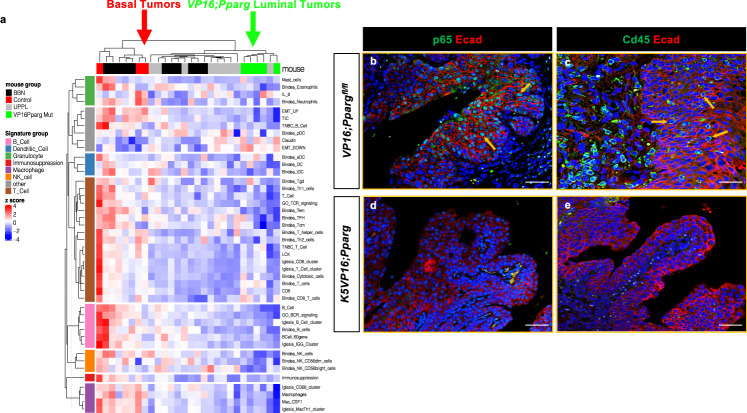
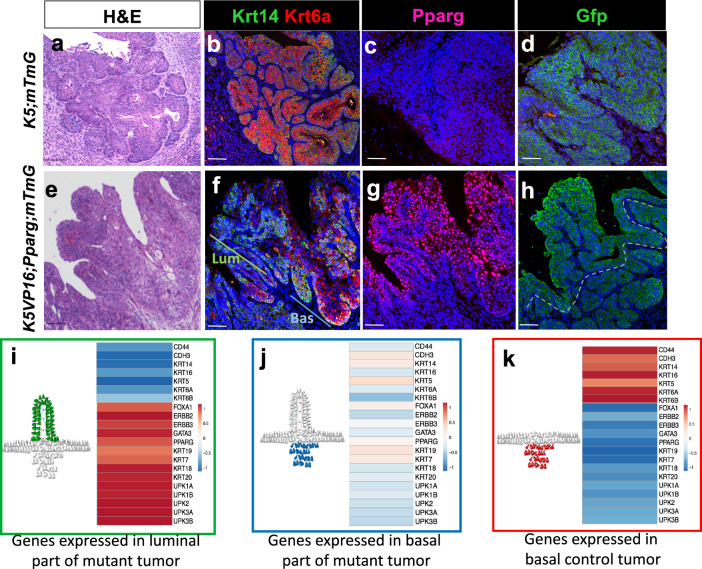
Pparg, a nuclear receptor, is downregulated in basal subtype bladder cancers that tend to be muscle invasive and amplified in luminal subtype bladder cancers that tend to be non-muscle invasive. Bladder cancers derive from the urothelium, one of the most quiescent epithelia in the body, which is composed of basal, intermediate, and superficial cells. We find that expression of an activated form of Pparg (VP16;Pparg) in basal progenitors induces formation of superficial cells in situ, that exit the cell cycle, and do not form tumors. Expression in basal progenitors that have been activated by mild injury however, results in luminal tumor formation. We find that these tumors are immune deserted, which may be linked to down-regulation of Nf-kb, a Pparg target. Interestingly, some luminal tumors begin to shift to basal subtype tumors with time, down-regulating Pparg and other luminal markers. Our findings have important implications for treatment and diagnosis of bladder cancer.


Conflict of interest statement

The authors declare no competing interests.

Figures

Fig. 1
Fig. 1. Expression of VP16;Pparg in basal cells induces an S-cell differentiation program.
aj Immunostaining showing expression of Pparg, Krt14, and Fabp4 in the urothelium of VP16;Pparg control (a) and K5VP16;Pparg mutants (f). Expression of Krt18 and Fabp4 in the urothelium of control (b) and a K5VP16;Pparg mutant (g). Expression of Krt20 and Krt14 in the urothelium of control (c) and a K5VP16;Pparg mutant (h). Expression of Krt14 and Fabp4 in the urothelium of control (d) and K5VP16;Pparg mutant (i). Expression of P21 and Fabp4 in the urothelium of control (e) and a K5VP16;Pparg mutant (j). k Quantification of the percentages of Basal cells undergoing luminal differentiation in VP16;Pparg controls (n = 3) versus K5VP16;Pparg mutants 4 days (n ≥ 3) after tamoxifen induction: expression of cell-type-specific markers in mutants and controls: Krt18 in the basal layer (p = 0.021), Gfp and Fabp4 in the basal layer (p = 0.038), Fabp4 and K14 (p = 0.031), Fabp4 but not K5 (p = 0.038). Box plots display minima, maxima, and interquartile range (IQR). Significance was calculated by one-sided Mann–Whitney U test. *p ≤ 0.05. l Schematic showing the mouse models and timing of analysis. The VP16;Pparg cassette was inserted in the Rosa26 Locus to generate VP16;Pparg mutant mice, where expression is activatable in cells expressing Cre recombinase. VP16;Pparg mice were then crossed with the Krt5CreERT2 line, which drives Cre-dependent recombination in Basal cells after Tamoxifen induction, activating the expression of the transgene. Tamoxifen was administered 3× over the course of 1 week, and bladders were harvested 4 days after the last Tamoxifen induction. m Schematic of the S-cell differentiation program induced by VP16;Pparg expression in basal cells. n Upregulated and downregulated pathways from RNA-seq analysis of controls and K5VP16;Pparg mutants 4 days after Tamoxifen induction. p values were calculated by hypergeometric test and corrected for multiple testing. Yellow arrows in ae denote superficial cells. White arrows in fj denote mutant cells undergoing a basal to luminal shift. Scale bars, 50 μm. Source data are provided as a Source Data file.
Fig. 2
Fig. 2. Short BBN treatment induces a wound-healing response in the urothelium that primes basal cell progenitors for tumorigenesis.
a Schematic representation showing activation of K14-progenitors. bc Histology of bladders from untreated mice (b) and from mice treated with BBN for 1 month (c); the black double-headed arrow denotes edema. Scale bars, 200 μm. di Immune infiltration visualized by Cd45 staining in bladders from untreated controls (d) and mice treated with BBN for 1 month (e). Expression of p65 in controls (f) and in mice treated with BBN for 1 month (g). Expression of Ki67 in controls (h) and in bladders from mice treated with BBN for 1 month (i). White arrows denote cells positive for Cd45 (e), p65 (g), and Ki67 (i) in bladders from BBN-treated animals. The inserts in e and i show images at higher magnification. jo Loss of normal urothelial populations and gain of squamous populations in bladders from a mouse treated with BBN for 1 month. Krt14 expression in control (j) and in urothelium from a mouse treated with BBN for 1 month (k). Yellow arrows in j denote a Krt14-expressing cell. Krt20 expression in a control (l) and in the urothelium from a mouse treated with BBN for 1 month (m). The yellow arrow in l denotes a Krt20-expressing S-cell. The white arrow in m denotes the loss of Krt20-positive S-cells after BBN treatment. Krt6a expression in control (n) and in urothelium from a mouse treated with BBN for 1 month (o). The yellow arrow in n denotes the absence of detectable Krt6a expression in the untreated urothelium. White arrows in o denote activated basal cells expressing Krt6a, a squamous marker not present in the healthy urothelium. Scale bars, 50 μm. p Heatmaps of luminal/basal gene signatures and immune cell signatures generated from pathway analysis of RNA-seq performed on the urothelium of control and BBN-treated bladders.
Fig. 3
Fig. 3. Activation of Pparg in K5VP16;Pparg mice produces luminal bladder tumors.
a Schematic showing time-course of tamoxifen and BBN treatment used in experiments with K5VP16;Pparg mice and controls. bg Ultrasound images of VP16;Ppargfl/fl control bladders (b) and a K5VP16;Pparg mutant (c) 4 months after Tamoxifen induction. Yellow arrow in c denotes a lesion protruding into the lumen. H&E images of bladders from a VP16;Ppargfl/fl control (d) and a K5VP16;Pparg mutant (e) 4 months after Tamoxifen induction. Double black arrows in (e) denote high grade papillary lesions. Expression of E-cadherin, smooth muscle actin, and laminin in a VP16;Ppargfl/fl control (f) and in a K5VP16;Pparg mutant (g). hw An H&E image of human luminal tumor (h), a K5VP16;Pparg mutant tumor (l), a human basal tumor (p), and a VP16;Pparg control basal tumor (t). Expression of Krt14, P63, and Krt6a in a human luminal tumor (i), a K5VP16;Pparg mutant tumor (m), a human basal tumor (q), and a VP16;Pparg control basal tumor (u). Krt20 and Pparg expression in a luminal tumor (j), a K5VP16;Pparg mutant tumor (n), a human basal tumor (r), and a VP16;Pparg control basal tumor (v). Ki67 and Foxa1 expression in a luminal tumor (k), a K5VP16;Pparg mutant tumor (o), a human basal tumor (s), and a VP16;Pparg control basal tumor (w). x Quantification of the percentage of luminal tumors observed in VP16;Pparg controls (n = 10) and K5VP16;Pparg mutants (n = 10). Box plots display minima, maxima, and interquartile range (IQR). Significance was calculated by a one-sided Mann–Whitney U test. ****p = 3.14e-05. y Upregulated and downregulated signaling pathways based on RNA-seq analyses of K5VP16;Pparg mutant tumors compared to VP16;Ppargfl/fl basal control tumors 4 months after tamoxifen induction. p values were calculated by hypergeometric test and corrected for multiple testing. Scale bars in de 200 μm. Scale bars in fw, 100 μm. Source data are provided as a Source Data file.
Fig. 4
Fig. 4. K5VP16;Pparg tumors are immune cold.
a Immune gene signatures of K5;mTmG control tumors, K5;VP16;Pparg;mTmG mutant tumors, tumors induced by BBN, and UPPL primary tumor samples. Expression of p65 and E-cadherin in controls (b) and in K5VP16;Pparg mutant tumors (d). Expression of Cd45 and Ecad in controls (c) and in K5VP16;Pparg mutant tumors (e). Yellow arrows in b and c denote p65 and Cd45-expressing cells in control tumors. Scale bars, 100 μm.
Fig. 5
Fig. 5. K5VP16;Pparg;mTmG luminal tumors develop basal domains.
ak H&E images of a K5;mTmG control tumor (a) and a K5VP16;Pparg;mTmG mutant tumor (e) 4 months after induction. Expression of Krt14 and Krt6a in a K5;mTmG control tumor (b) and K5VP16;Pparg;mTmG mutant tumor (f) 4 months after induction. Expression of Pparg in a K5;mTmG control tumor (c) and a K5VP16;Pparg;mTmG mutant tumor (g) 4 months after induction. Expression of Gfp in a VP16;Pparg;mTmG control tumor (d) and in a K5VP16;Pparg mutant tumor (h) 4 months after Tamoxifen induction. ik Heatmaps and schematic representation showing tumor evolution. The luminal portion of a K5VP16;Pparg mutant tumor is shown in green (i) and the basal domain is depicted in blue (j). k shows a schematic representation of a control basal tumor, which is depicted in red. Scale bars, 100 μm.

References

    1. Society AC. Cancer Facts & Figures 2020. American Cancer Society (2020).
    1. Jost SP. Cell cycle of normal bladder urothelium in developing and adult mice. Virchows Arch. B Cell Pathol. Incl. Mol. Pathol. 1989;57:27–36. doi: 10.1007/BF02899062. - DOI - PubMed
    1. Ma E, et al. A multiplexed analysis approach identifies new association of inflammatory proteins in patients with overactive bladder. Am. J. Physiol. Ren. Physiol. 2016;311:F28–F34. doi: 10.1152/ajprenal.00580.2015. - DOI - PMC - PubMed
    1. Birder LA. Pathophysiology of interstitial cystitis. Int. J. Urol. 2019;26:12–15. doi: 10.1111/iju.13985. - DOI - PubMed
    1. Schafer FM, et al. Mode of surgical injury influences the source of urothelial progenitors during bladder defect repair. Stem Cell Rep. 2017;9:2005–2017. doi: 10.1016/j.stemcr.2017.10.025. - DOI - PMC - PubMed

Publication types

MeSH terms