. 2021 Oct 25;11(1):21008.
doi: 10.1038/s41598-021-00435-y.

Single-stranded DNA binding proteins influence APOBEC3A substrate preference

Affiliations

Single-stranded DNA binding proteins influence APOBEC3A substrate preference

Amber L Brown et al. Sci Rep. .

Abstract

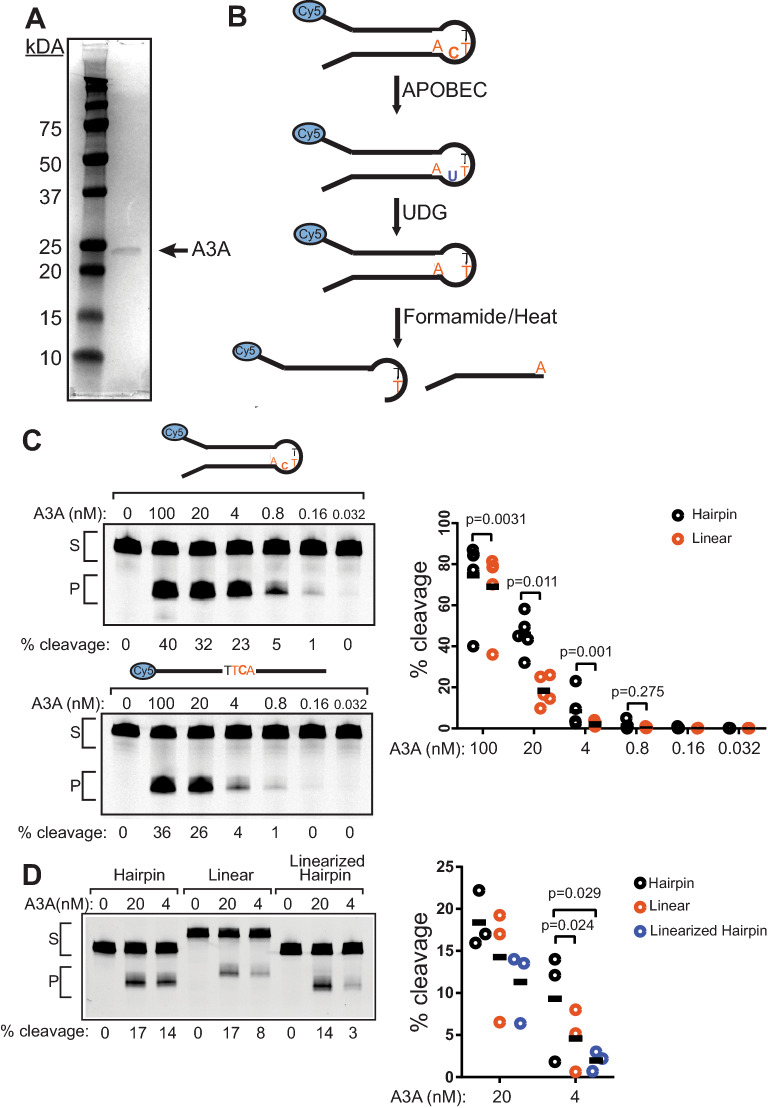
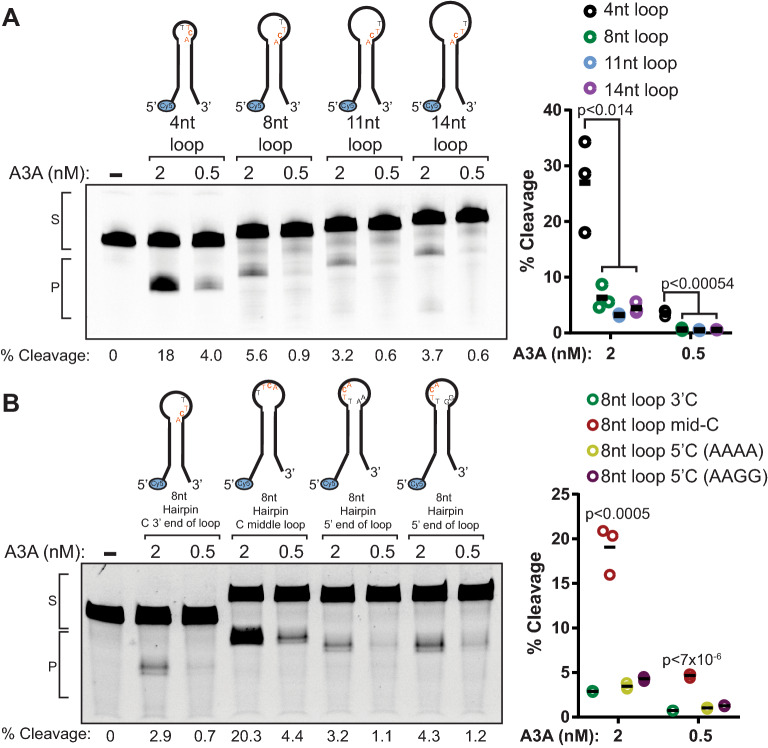
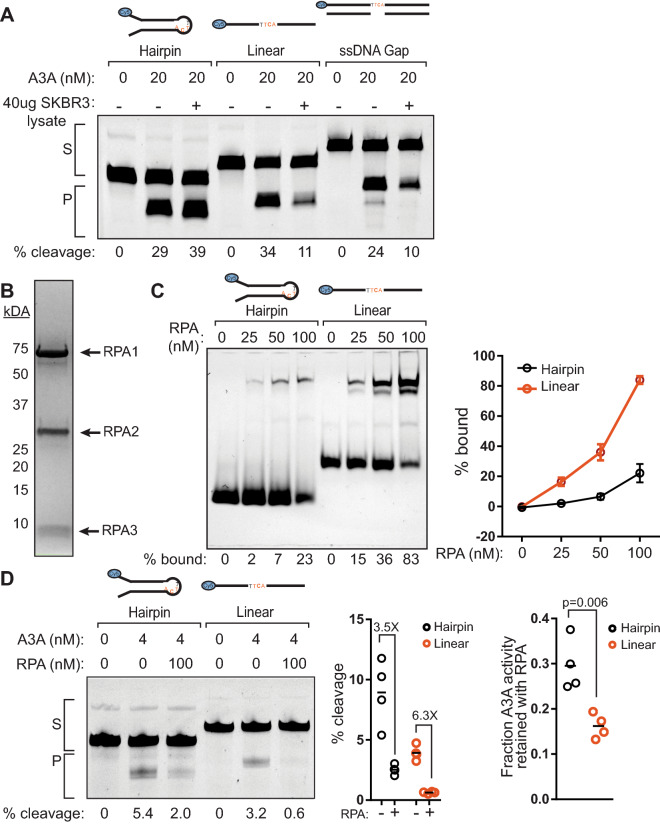
The cytidine deaminase, APOBEC3A (A3A), is a prominent source of mutations in multiple cancer types. These APOBEC-signature mutations are non-uniformly distributed across cancer genomes, associating with single-stranded (ss) DNA formed during DNA replication and hairpin-forming sequences. The biochemical and cellular factors that influence these specificities are unclear. We measured A3A's cytidine deaminase activity in vitro on substrates that model potential sources of ssDNA in the cell and found that A3A is more active on hairpins containing 4 nt ssDNA loops compared to hairpins with larger loops, bubble structures, replication fork mimics, ssDNA gaps, or linear DNA. Despite pre-bent ssDNAs being expected to fit better in the A3A active site, we determined A3A favors a 4 nt hairpin substrate only 2- to fivefold over linear ssDNA substrates. Addition of whole cell lysates or purified RPA to cytidine deaminase assays more severely reduced A3A activity on linear ssDNA (45 nt) compared to hairpin substrates. These results indicate that the large enrichment of A3A-driven mutations in hairpin-forming sequences in tumor genomes is likely driven in part by other proteins that preferentially bind longer ssDNA regions, which limit A3A's access. Furthermore, A3A activity is reduced at ssDNA associated with a stalled T7 RNA polymerase, suggesting that potential protein occlusion by RNA polymerase also limits A3A activity. These results help explain the small transcriptional strand bias for APOBEC mutation signatures in cancer genomes and the general targeting of hairpin-forming sequences in the lagging strand template during DNA replication.


Conflict of interest statement

The authors declare no competing interests.

Figures

Figure 1
Figure 1
APOBEC3A prefers to deaminate hairpins over linear ssDNA. (A) Coomassie stained SDS-PAGE gel showing the purity of C-terminally Strep-tagged A3A (23 kDa) overexpressed in and purified from HEK293T cells. (B) Schematic of the in vitro deaminase assay. (C) Representative gel images of the activity of decreasing concentrations of purified A3A incubated with 250 nM hairpin and linear substrates in vitro for 30 min at 37 °C in the presence of uracil DNA glycosylase. S denotes substrate band; P denotes the product band. Quantification of 5 replicate experiments comparing A3A activity on hairpin and linear substrates. Horizontal bars indicate mean values. P-values were determined by Ratio paired t-tests. (D) 20 nM A3A, 4 nM A3A or no A3A was incubated with 250 nM hairpin or linear substrates. Reactions were performed and denoted as in 1C. Shown is a representative gel image and the quantification of 3 independent experimental replicates (horizontal bars represent mean values for each condition). P-values were determined as in (C). Full-length gel images for 1C and 1D are presented in Fig. S4.
Figure 2
Figure 2
APOBEC3A prefers stem loops with 4nt loops, and target C in the middle of the loop. (A) Deaminase assay of 2 nM A3A, 0.5 nM A3A or no A3A incubated with 100 nM hairpins with 4, 8, 11, or 14 nt loops for 1 h at 37 °C before processing as in Fig. 1C. (B) Deaminase assay as in (A) using 8 nt hairpins with the target C in the 3′-most (8nt loop 3′C), middle (8nt loop mid-C), or 5′-most (8nt loop 5′C) position in the loop for 3 h at 37 °C before processing as in Fig. 1C. Two versions of the 8nt loop 5′C hairpin are included, where the sequence of the 3′ portion of the loop is either AAAA [8nt loop 5′C (AAAA)] or AAGG [8nt loop 5′C (AAGG)]. S denotes substrate band; P denotes the product band. Full-length gel images for 2A and 2B are presented in Fig. S5. Quantifications of the percent cleavage for 3 replicate experiments of (A) and (B) are shown. Horizontal bars indicate mean values. P-values were determined by t-test.
Figure 3
Figure 3
APOBEC3A prefers hairpin substrates over other structures that are possible sources of ssDNA. (A) Graphical representation of ssDNA substrates tested. All substrates contained a TTCA motif and were 5′ Cy5 tagged. Structures with double-stranded regions were confirmed prior to use (Fig. S2). (B) Deaminase assay of 100 nM A3A, 20 nM A3A, or no A3A was incubated with 20 nM hairpin, replication fork, ssDNA gap, or bubble substrates containing 4 nt spans of ssDNA. Assays were performed and processed as in Fig. 1C. S denotes substrate band; P denotes the product band. (C) Quantification of 3 deaminase assay replicates was conducted as described in (B). P-values indicate significant differences in A3A activity comparing the hairpin and ssDNA gap substrates pairwise to the replication fork and bubble substrates by t-test. Deamination efficiency was displayed as percent cleavage of each substrate by 20 nM A3A. Error bars indicate standard error of the mean. (D) Deaminase assay of 100 nM A3A, 20 nM A3A, or no A3A with 20 nM of hairpin, replication fork, ssDNA gap, or bubble substrates with longer spans of ssDNA (10 nt). Assays were performed and processed as in Fig. 1C. S denotes substrate band; P denotes the product band. (E) Quantification of 3 replicate deaminase assays was conducted as in (D) and displayed as in (C). n.s. indicates no statistical difference was observed in activities among substrates. Full-length gel images for 3B and 3D are presented in Fig. S6.
Figure 4
Figure 4
APOBEC3A activity is reduced more severely on linear substrates than on hairpins in the presence of whole cell lysate or RPA. (A) Deaminase assay of 20 nM A3A or no A3A incubated with 20 nM hairpin, linear, or gap-fill substrates with or without whole cell lysate. Substrates were preincubated with 40 µg of SKBR3 whole cell lysates or buffer for 1 h at 37 °C, then A3A was added to 20 nM final concentration, and incubated for an additional 30 min at 37 °C prior to processing as in Fig. 1C. S denotes the substrate band; P denotes the product band. The results are representative of three independent experiments. (B) Coomassie stained SDS-PAGE gel of purified human RPA. (C) Electrophoretic mobility shift assay of 0, 25, 50, and 100 nM RPA incubated with 50 nM hairpin or linear ssDNA substrate. Three replicate experiments were quantified to determine the percent of each substrate bound. Dots and error bars indicate mean values and standard deviation. (D) 4 nM A3A was incubated with 50 nM hairpin or linear ssDNA substrate at 37 °C for 5 or 15 min, respectively, in the presence or absence of 100 nM RPA. The percent substrate cleavage in the presence and absence of 100 nM RPA as well as the fraction of A3A deaminase activity remaining after RPA addition for the hairpin (black dots) and linear substrates (red dots) was quantified from 4 experimental replicates. Horizonal bars indicate mean values. P-values were determined by t-test. Full-length gel images for 4A and 4D are presented in Fig. S7.
Figure 5
Figure 5
APOBEC3A activity is low on transcription bubbles. Deaminase assay of 0, 20, 50, or 100 nM A3A during in vitro T7 RNA polymerase transcription, stalled at T in AAGT within the transcribed strand (i.e. across from a TTCA on the non-transcribed strand). Reactions were carried out with 50 units of T7 RNA polymerase or an equal volume of 50% glycerol, and GTP, CTP, and UTP but no ATP, to cause the stalling. Reactions were incubated for 24 h at 37 °C in the presence of Uracil DNA Glycosylase, stopped by the addition of Proteinase K and SDS buffer, then heated for 10 min at 95 °C in formamide buffer before separating out product from substrate via denaturing polyacrylamide gels. Gels were imaged for Cy5 fluorescent tags (upper panel) and after staining with GelRed to observed total nucleic acids produced in the reaction (lower panel). S denotes the substrate band; P denotes the product band. Full-length gel images are presented in Fig. S8. Shown is a representative image from 10 independent experiments.

Similar articles

Cited by

References

    1. Conticello SG. The AID/APOBEC family of nucleic acid mutators. Genome Biol. 2008;9:229. doi: 10.1186/gb-2008-9-6-229. - DOI - PMC - PubMed
    1. Refsland EW, Harris RS. The APOBEC3 family of retroelement restriction factors. Curr. Top. Microbiol. Immunol. 2013;371:1–27. - PMC - PubMed
    1. Smith HC, Bennett RP, Kizilyer A, McDougall WM, Prohaska KM. Functions and regulation of the APOBEC family of proteins. Semin. Cell. Dev. Biol. 2012;23:258–268. doi: 10.1016/j.semcdb.2011.10.004. - DOI - PMC - PubMed
    1. Burns MB, Leonard B, Harris RS. APOBEC3B: Pathological consequences of an innate immune DNA mutator. Biomed. J. 2015;38:102–110. doi: 10.4103/2319-4170.148904. - DOI - PubMed
    1. Chan K, Resnick MA, Gordenin DA. The choice of nucleotide inserted opposite abasic sites formed within chromosomal DNA reveals the polymerase activities participating in translesion DNA synthesis. DNA Repair. 2013;12:878–889. doi: 10.1016/j.dnarep.2013.07.008. - DOI - PMC - PubMed

Publication types