. 2021 Nov;24(11):1555-1566.
doi: 10.1038/s41593-021-00929-y. Epub 2021 Oct 25.

Context-dependent representations of movement in Drosophila dopaminergic reinforcement pathways

Affiliations

Context-dependent representations of movement in Drosophila dopaminergic reinforcement pathways

Aryeh Zolin et al. Nat Neurosci. 2021 Nov.

Abstract

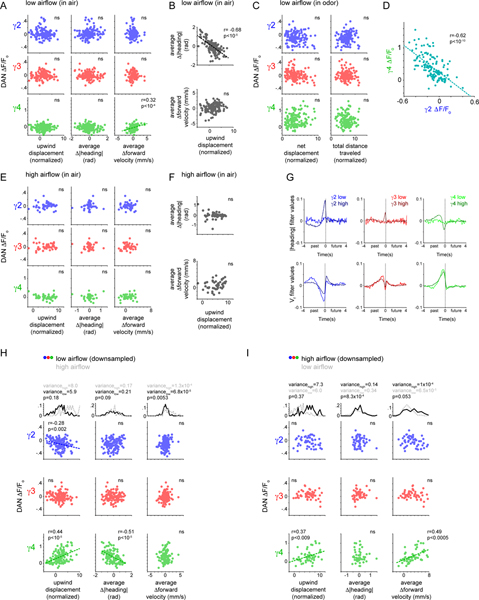
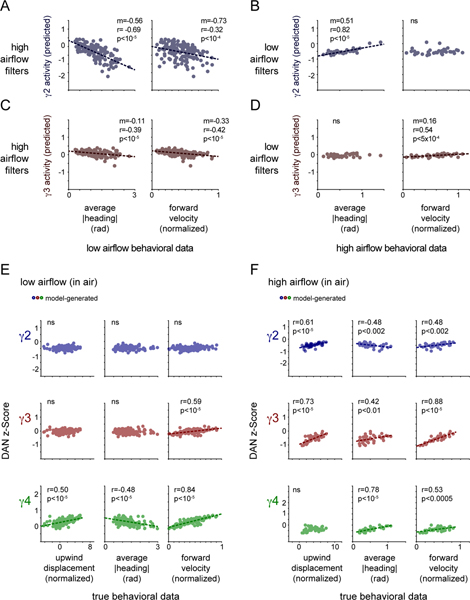
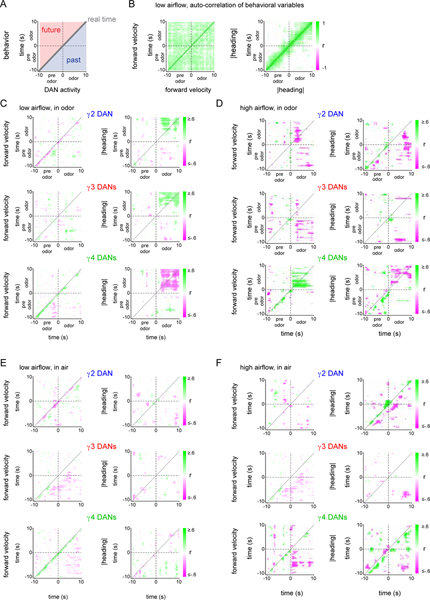
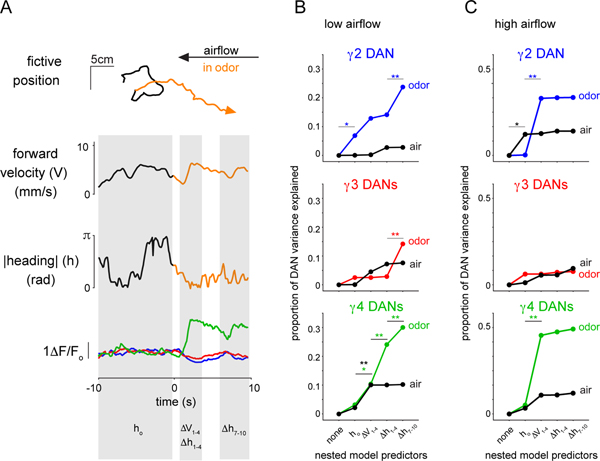
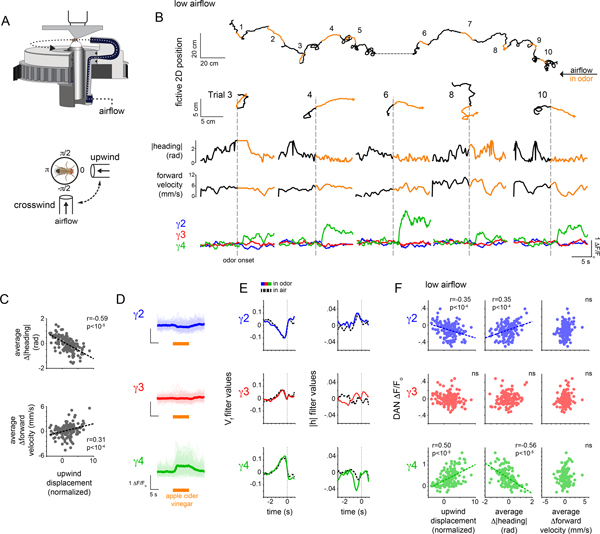
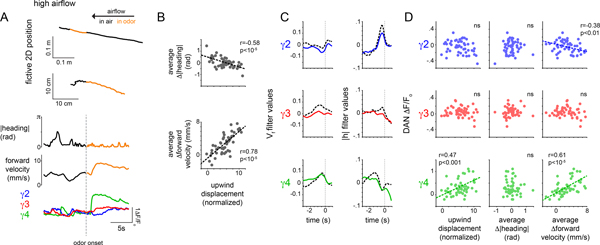
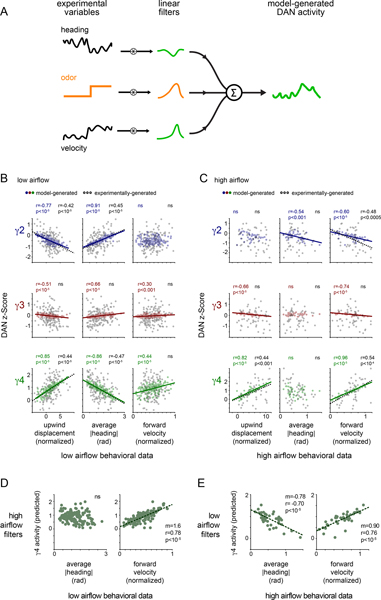
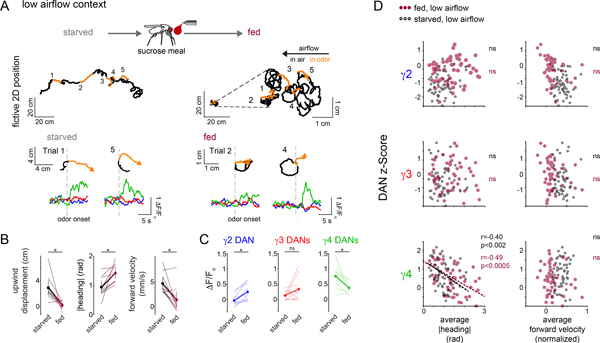
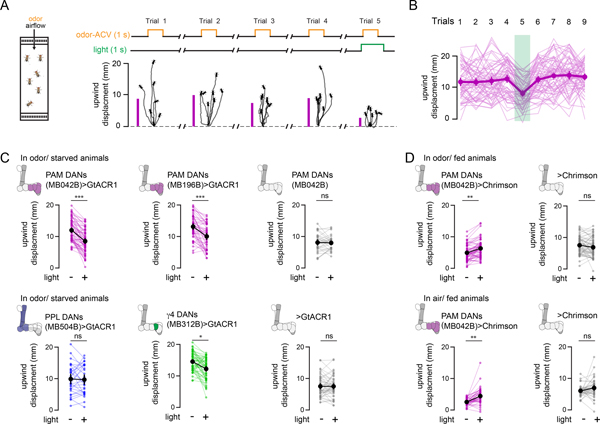
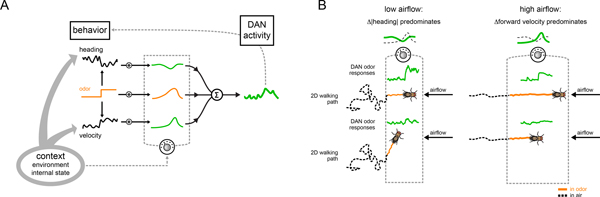
Dopamine plays a central role in motivating and modifying behavior, serving to invigorate current behavioral performance and guide future actions through learning. Here we examine how this single neuromodulator can contribute to such diverse forms of behavioral modulation. By recording from the dopaminergic reinforcement pathways of the Drosophila mushroom body during active odor navigation, we reveal how their ongoing motor-associated activity relates to goal-directed behavior. We found that dopaminergic neurons correlate with different behavioral variables depending on the specific navigational strategy of an animal, such that the activity of these neurons preferentially reflects the actions most relevant to odor pursuit. Furthermore, we show that these motor correlates are translated to ongoing dopamine release, and acutely perturbing dopaminergic signaling alters the strength of odor tracking. Context-dependent representations of movement and reinforcement cues are thus multiplexed within the mushroom body dopaminergic pathways, enabling them to coordinately influence both ongoing and future behavior.


Conflict of interest statement

Competing Interests Statement

The authors declare no competing interests.

Figures

Extended Data Fig. 1
Extended Data Fig. 1. Compartmentalized DAN activity and dopamine release coordinately represent reward and locomotion.
(A) Schematic depicting experimental system and definition of the quantified parameters of locomotion. (B) Comparison of maximum DAN activity measured by sytGCaMP6s expressed in DANs (left) and dopamine release measured by dLight expressed in Kenyon cell (KCs) (right) in response to ingestion of a sucrose reward (R) or during locomotion (L). Signals normalized by subtracting the median fluorescence during the 5 min trial. Paired two-sided t-test with Bonferroni correction, p<0.05(*), see Supplementary Table 2. (C) Correlated and compartmentalized sytGCaMP6s activity in γ lobe DANs (top) and KC dLight expression reflecting dopamine release (bottom) during periods of spontaneous locomotion and sucrose ingestion. Multiple clustering algorithms identify each compartment as a relatively homogenous unit, with stronger correlations within than across compartments. Left: pixels color coded by k-means clustering analysis. Middle: pixels color coded by CNMF clustering analysis. Right: pixel-by-pixel cross-correlation (Pearson correlation coefficient) for the same animal. (D) Anatomic reconstructions of γ4 DAN subpopulations from hemibrain connectome. Upper and lower axonal commissures that DANs use to innervate the lobes highlighted in red and green, respectively. (E) Presynaptic distribution of DANs following upper (red) and lower (green) commissure within the γ4 compartment. (F) Overlay of forward velocity (black) and activity of either the MB312B+ γ4 DANs (top, which follow the upper commissure, red) or MB316B+ γ4 DANs (bottom, which follow the lower commissure, green) expressing GCaMP6f during locomotion and sucrose ingestion (maroon bar). (G) Average MB312B (top, upper commissure, red) or MB316B (bottom, lower commissure, green) responses aligned to the beginning of sucrose ingestion (maroon bar). N for MB312B= 6 animals, 10 sucrose presentations. N for MB316B= 5 animals, 14 sucrose presentations. (H) Heat map of maximum ΔF/Fo for MB312B (top, upper commissure) or MB316B (bottom, lower commissure) during locomotion (middle) or sugar ingestion (right) overlaid on GCaMP fluorescence (left) highlights that MB312B+ DANs are active during locomotion but not reward ingestion while MB316B+ DANs display multiplexed activity during both contexts.
Extended Data Fig. 2
Extended Data Fig. 2. Multiplexed and correlated activity in γ4 DAN subsets.
(A) MB312B+ γ4 DANs (upper commissure) expressing GCaMP6f fluorescence (left) with functionally correlated and spatially adjacent pixels clustered into single ROIs by CNMF analysis (middle). Right: representative ROIs whose activity is plotted in (C). Similar results observed in N=6 animals. (B) Same as in (A) but for MB316B+ γ4 DANs (lower commissure). Right: representative ROIs plotted in (D). Similar results observed in N=5 animals. (C) Net motion (top row, black) aligned to the activity in representative CNMF-generated-ROIs from (A) (2nd, 3rd, and 4th rows, shades of green), total MB312B+ DAN GCaMP activity (5th row), the average CNMF-generated-ROI activity (bottom row), and the activity in all ROIs (heatmap) from a representative experiment in a MB312B>GCaMP6f individual. Maroon bars indicate period of sucrose ingestion. (D) As in (C) but for MB316B+ γ4 DANs (upper commissure). Maroon bars indicate period of sucrose ingestion. (E) Cytoplasmic GCaMP6f activity in MB312B+ γ4 DAN soma (shades of green) in representative examples during sugar ingestion (left) and spontaneous movement (right) aligned to forward velocity (top row, black). Different shades of green indicate different γ4 DAN soma recorded from the same animal. Maroon bars indicate period of sucrose ingestion. (F) As in (E) but recording from MB316+ γ4 DAN soma. (G) Motor-associated signals across individual γ4 DANs is highly correlated. Cytoplasmic GCaMP6f activity in MB312B+ γ4 DAN soma measured with volumetric imaging during spontaneous bouts of locomotion. For three flies: top row shows a representative bout of forward velocity (black), middle row shows cytoplasmic GCaMP6s fluorescence (shades of green indicate different γ4 DAN soma), and bottom row is heatmap depicting the cross-correlation (Pearson correlation coefficient) between GCaMP6s signals in different γ4 DANs during spontaneous locomotion in a 5 min trial.
Extended Data Fig. 3
Extended Data Fig. 3. Variability of DAN - behavior correlations.
(A) Top: average motion (black) ± 95% confidence interval (CI, obscured by average line) as animals initiate locomotion. Bottom: heat map of ΔF/Fo in γ DANs aligned to movement initiation. Rows (bouts) ordered by average γ2 (left) or γ4 (right) ΔF/Fo. Dashed lines indicate 20% of trials with highest or lowest average ΔF/Fo. N=53 animals, 1060 starts. (B) DAN activity and parameters of locomotion during spontaneous movement initiation in which γ2 and γ4 were most differentially active). Left: average γ2 ΔF/Fo (top), motion (2nd row), acceleration (3rd), forward velocity (4th), and |angular velocity| (bottom) ± 95% CI as animals initiated locomotion. 20% of bouts of movement initiation with highest (dark) and lowest (lighter) average γ2 ΔF/Fo as indicated by lines in (A). Right: as left but for with highest (ligher) and lowest (dark) average γ4 ΔF/Fo. N=212 bouts. (C) As in (B) but for flies walking in non-odorized air in closed-loop. N=91 bouts. (D) γ2 (top) and γ4 (bottom) DAN activity vs different behavioral variables. N=1060 bouts. All Pearson correlation coefficients are either weak (|r|<0.18) or not significant (no Bonferroni correction). (E) Comparisons of average DAN ΔF/Fo during the onset of locomotion. Pearson correlation coefficient (r) indicated where relationship is statistically significant (p<0.00001, Bonferroni correction, see Supplementary Table 2). N=1060 starts. (F) Pearson correlation coefficient between change in DAN activity and net motion during bouts of movement initiation for flies walking in clean air in closed-loop. Columns (flies) ordered by average γ4-motion correlation. N=32 animals, 452 starts. (G) Filters predicting DAN activity from forward velocity (top) or |angular velocity| (bottom) in open loop (OL, as in Figure 1F, light lines) or closed-loop (CL) in clean air. ± 95% CI. OL: N=66 animals, 119 5-minute trials. CL: N=20 animals, 32 5-minute trials. (H) Comparison of γ Kenyon Cells activity during presentation of apple cider vinegar from indicated angles. Average ΔF/Fo (dark line) ± 95% CI aligned to odor onset. Right: average ΔF/Fo during odor presentation from indicated angles. N=16 animals, 3 odor presentations per orientation (total 144 odor presentations). One-way ANOVA followed by Tukey’s multiple comparison test; no statistical significance observed.
Extended Data Fig. 4
Extended Data Fig. 4. Rapidly fluctuating network correlations between DANs and different behavioral variables.
(A) Representative traces from two flies showing the net motion of each animal (top), overlay of γ DAN activity (colored) and either forward velocity (middle rows, black) or turning velocity (bottom rows, black) during a period of continuous locomotion (epoch shown by gray dashed box in top trace). DAN activity is normalized to minimum and maximum values during the selected bout of walking. (B) Average activity of γ DANs aligned to increases in forward velocity during bouts of continuous movement. N=9,772 movements in 74 flies. (C) Average activity of γ DANs aligned to increases in turning velocity during bouts of continuous movement. N=11,667 movements in 74 flies. (D) Left: overlay of DAN activity in different compartments during epochs designated in (A). Top: same epoch as left panel of (A). Bottom: same epoch as right panel of (A). Middle: running cross-correlation between pairs of γ DANs for the traces at left. Right: histograms of running correlation. (E) Histogram of running cross-correlation between pairs of γ DANs for all flies. Shuffled controls (random 1–20 sec temporal shift) in black. N=74 animals, 178 5-minute trials. (F) Partial correlations between γ DANs to control for potential relationships that arise from common behavioral signals. N=74 animals, 178 5-minute trials. ANOVA followed by Tukey’s multiple comparison test with. Data labeled with different letters are significantly different from each other (p < 0.00001). (G) Proportion of the variance (R2) in net motion (left), forward velocity (middle), and |angular velocity| (right) explained by individual and all DANs. N=66 animals, 119 5-minute trials. ANOVA followed by Tukey’s multiple comparison test. Data labeled with different letters are significantly different from each other (p < 0.0005). (H) No significant relationships are apparent between intercompartmental correlations and behavioral parameters. Pearson correlation coefficient between pairs of γ DANs and different parameters of movement during bouts of continuous locomotion. All Pearson correlation coefficients are either weak (|r|<0.1) or not significant, see Supplementary Table 2. p values not adjusted with Bonferroni correction.
Extended Data Fig. 5
Extended Data Fig. 5. DAN-motor correlations vary across conditions.
(A) Same analysis as in Figure 3F but offset by 15 sec such that animals were walking only in clean air. N=26 flies, 143 epochs. (B) Same analysis as in Figure 3C but offset by 15 sec such that animals were walking in clean air. Fisher r-to-z transformation indicates no significant differences. in correlation coefficients between upwind displacement and Δ|heading| in and out of odor (z=−1.32). N=26 flies, 143 odor presentations. (C) Average γ DAN ΔF/Fo shows no correlations with an animal’s net displacement (left) or total scalar distance traveled (right) during odor presentations. Displacement was normalized (divided by) an individual’s average walking speed. Pearson correlation coefficient (r) indicated where relationship is statistically significant (p=10−15, Bonferroni correction). N=26 flies, 143 epochs. (D) ΔF/Fo of DANs in the γ2 vs γ4 compartments during odor presentation. Pearson coefficient (r) indicated where relationship is significant (p<0.0001, see Supplementary Table 2). N=26 flies, 143 odor presentations. (E) Same analysis as in Figure 4D but offset by 15 sec such that flies were walking in clean air. N=22 flies, 52 odor presentations. (F) Same analysis as in Figure 4B but offset by 15 sec such that animals were walking in clean air. N=22 flies, 52 odor presentations. (G) Filters predicting DAN activity from |heading| (top) or forward velocity (bottom) as animals walked in clean air, under low (lighter) or high airflow (darker) conditions. ± 95% confidence interval obscured by thickness of the data line. (H) Average γ DAN ΔF/Fo plotted as a function of upwind displacement (left), Δ|heading| (middle), and Δ forward velocity (right) during odor presentation from Fig. 3F however here data from the low airflow context was subsampled such that the variance of the Δ |heading| was statistically equal to that of the high airflow context. Top: distribution of range of behavior. Pearson coefficient (r) indicates where relationship between subsampled variables is significant (p<0.05 with Bonferroni, see Supplementary Table 2). Nlow airflow=135 odor presentations. (I) Same as (H) except when data from the high airflow context is subsampled such that the variance of the Δforward velocity was statistically equal to that of the low airflow context. Nhigh airflow=50 odor presentations.
Extended Data Fig. 6
Extended Data Fig. 6. Analysis of dynamic DAN-motor correlations.
(A) Average predicted γ2 odor responses generated from high airflow filters plotted as a function of upwind displacement (left), |heading| (middle), and forward velocity (right) during odor presentation under low airflow conditions. Best fit line and Pearson coefficient (r) indicated where relationship is significant (p<0.0001, Bonferroni correction, see Supplementary Table 2). N=26 flies, 143 odor presentations. (B) As in (A) but predicted DAN odor responses generated from low airflow filters plotted against behavior under high airflow conditions. Best fit line and Pearson coefficient (r) indicated where relationship is significant (p<0.0001, Bonferroni correction). N=22 flies, 52 odor presentations. (C-D) Same as (A-B) except for γ3 DAN odor responses. N=26 flies, 143 odor presentations (C), N=22 flies, 52 odor presentations (D). (E) Average predicted DAN odor responses plotted as a function of upwind displacement (left), |heading| (middle), and forward velocity (right) as animals walked in clean air, under low airflow. Best fit line and Pearson coefficient (r) indicated where relationship is significant (p<0.01 with Bonferroni correction, see Supplementary Table 2). N=26 flies, 143 odor presentations. (F) Same as (A) except under high airflow. N=22 flies, 52 odor presentations.
Extended Data Fig. 7
Extended Data Fig. 7. Cross-correlation analysis between DAN activity and behavior during odor pursuit.
(A) Organization of cross correlation matrix comparing DAN activity to past, present, and future behavior in and out of odor. (B) Auto-correlation of forward velocity (left) and |heading| (right) before and during odor presentation during the 10 sec prior to odor and the 10 sec of odor presentation. Colored points indicate statistically significant correlations (Pearson correlation coefficient, p<0.05, no Bonferroni correction, see Supplementary Table 2). N=26 flies, 143 odor presentations. Note the correlation between an animal’s current and past or future forward velocity extend throughout the trial, while the correlation between an animal’s current and past or future heading is < 3 sec. (C-D) Cross correlation matrix between forward velocity (left) or |heading| (right) and γ DAN activity during the 10 sec prior to odor onset and the 10 sec during odor presentation under low (C) and high (D) airflow conditions. Only relationships that are statistically significant by Pearson cross correlation (p<0.05, no Bonferroni correction, see Supplementary Table 2) are shown in color indicated by green-magenta scale. N=26 flies, 143 odor presentations (C), N=22 flies, 52 odor presentations (D). (E-F) Same analysis as in (C-D) but over a 20-sec period during which only clean air is presented to the animal. Colored points indicate statistically significant correlations (p<0.05, no Bonferroni correction, see Supplementary Table 2). N=26 flies, 143 odor presentations (E), N=22 flies, 52 clean air epochs (F).
Extended Data Fig. 8
Extended Data Fig. 8. Correlations between DAN activity and current and future behavior emerge during odor tracking.
(A) Representative trial showing fictive 2D trajectory, forward velocity, |heading|, and γ DAN activity in which the fly reorients and tracks upwind in response to apple cider vinegar in the low airflow context. Black trajectories indicate clean air, orange indicates time of odor presentation. Shaded areas represent epochs used in nested linear model (B). (B) A nested linear model predicting γ DAN activity during the initial phase of odor presentation under low airflow conditions (t=1–4 sec after odor onset) based on an animal’s average heading 10 sec prior to odor onset (ho), initial Δforward velocity (t=1–4 sec, ΔV1–4), initial Δ|heading| (t=1–4 sec, Δh1–4), and future Δ|heading| (t=7–10 sec, Δh7–10, a time window when behavioral autocorrelations are no longer relevant). Fraction of DAN variance explained as a function of which predictors were included in the model, for odor presentation (colored lines) and same temporal epochs offset 10 sec prior to the odor presentation (black) when the fly walked in clean air. F-test, p<0.05 (*), p<0.01 (**) with colored asterisk depicting significant differences in odor and black asterisk depicting significant differences in clean air. N=26 flies, 143 odor presentations. (C) Same as (B) except under high flow conditions. N=22 flies, 52 odor presentations.
Extended Data Fig. 9
Extended Data Fig. 9. DAN-movement relationships during odor tracking in low airflow conditions are comparable in starved and fed animals.
(A) Linear filters predicting DAN activity using forward velocity (Vf, left) or |heading| (|h|, right) in fed (colored lines) and starved (black dashed lines) flies during odor tracking over a 4 second window. N=10 flies, 49–53 odor presentations. (B) Average predicted DAN activity plotted as a function of upwind displacement (left), |heading| (middle), and forward velocity (right) during odor presentation in fed individuals. Best fit line and Pearson correlation coefficient (r) indicated where relationship is statistically significant (p<0.0001 with Bonferroni correction, see Supplementary Table 2). (C-D) Average predicted γ2 DAN odor responses generated by applying filters derived from fed animals to behavioral data from starved (C) or fed (D) animals, plotted as a function of |heading| (left) or forward velocity (right) during odor presentation. Best fit line and Pearson correlation coefficient (r) indicated where relationship is statistically significant (p<0.0005 with Bonferroni correction, see Supplementary Table 2). N=10 flies, 49 (fed) and 53 (starved) odor presentations. (E-F) Same as (C-D) but for γ3 DANs. (G-H) Same as (C-D) but for γ4 DANs.
Extended Data Fig. 10
Extended Data Fig. 10. Optogenetic inhibition or excitation of PAM DANs bidirectionally influences upwind tracking behavior.
(A) Average upwind velocity during odor presentations preceding optogenetic inhibition (−) and during odor presentations paired with optogenetic inhibition (+) for the indicated genotypes in starved animals. PAM DANs (MB042B driver)>GtACR1 (N=63, top left), PAM DANs (MB196B driver)>GtACR1 (N=49, top middle), PAM DANs MB042B-Gal4 parental controls (N=33, top right), PPL DANs (MB504B driver)>GtACR1 (N=30, bottom left), γ4 DANs (MB312B driver)>GtACR1 (N=54, bottom middle), UAS-GtACR1 parental controls (N=48, bottom right). Paired two-sided t-test with Bonferroni correction, p<10–5 (**), see Supplementary Table 2. (B) Top: average upwind speed in odor presentations preceding optogenetic activation (−) and in odor predsentations paired with optogenetic activation (+) in fed PAM DANs (MB042B driver)>CsChrimson flies (left) and UAS-CsChrimson parental controls (right). N=60 paired cohorts of PAM>CsChrimson and parental control animals assayed together during a single experiment. Bottom: average upwind speed of fed animals in clean air preceding optogenetic activation (−) and with optogenetic activation (+) for fed PAM DANs (MB042B driver)>CsChrimson flies (left) and UAS-Chrimson parental controls (right). N=44 paired cohorts of PAM>CsChrimson and parental control animals assayed together during a single experiment. Paired two-sided t-test with Bonferroni correction, p<10–5 (**), see Supplementary Table 2.
Figure 1.
Figure 1.. Compartmentalized DAN activity and dopamine release during reward and locomotion.
(A) Schematic of experimental system for recording mushroom body DAN activity during spontaneous locomotion and ingestion of sucrose reward (left). Cartoon of the mushroom body lobe anatomy within the Drosophila brain (right). (B) Schematic of compartmental organization of mushroom body lobes with DANs (top left) and Kenyon cell (KCs, top right) γ lobe innervation. Pixels in the γ lobe are color coded by K-means clustering analysis performed from recording sytGCaMP6s in DANs (bottom left) and dLight in KCs (bottom right) during periods of spontaneous locomotion demonstrating that correlated pixels align to the compartmentalized architecture of the lobe (γ2: blue, γ3: red, γ4: green, γ5: magenta). (C) Representative experiment overlaying the net motion (black) of a fly and DAN activity (colored) during spontaneous locomotion and ingestion of 1M sucrose (maroon bars). (D) Representative experiment overlaying the net motion (black) of a fly and KC dLight signaling (colored) during spontaneous locomotion and ingestion of 1M sucrose (maroon bars). (E) Overlay of DAN activity (γ4/5>jRGECO) and dopamine release (KC>dLight) during simultaneous recording aligned to net motion (top, black) during spontaneous locomotion and ingestion of 1M sucrose (maroon bars). (F) Relationships between γ4 (left) and γ5 (right) DAN and dLight activity. jRGECO and dLight signals normalized to trial minimum and maximum. Best fit line and Pearson correlation coefficient (r) indicated where relationship is statistically significant (p=10–20 with Bonferroni correction). N=5 animals, 17 trials.
Figure 2.
Figure 2.. Differential encoding of behavior by mushroom body DANs.
(A) Representative experiments showing the variable relationship between the net motion (black) of a fly and DAN activity (colored) during bouts of spontaneous locomotion. Traces from flies θ and ρ are denoted in (B). (B) Pearson correlation coefficient between change in DAN activity and net motion at the onset of sustained locomotion (≥3 sec) following a pause (≥2 sec). Each column depicts all the bouts of movement initiation from an individual fly. Flies are ordered by the average correlation coefficient for γ4 DAN activity-net motion. N=39 animals, 1043 movement initiations. (C) Probability that a logistic regression model generated from DAN activity can accurately predict the locomotor state of an animal. N=27 animals. One-way ANOVA followed by Tukey’s multiple comparison test. Data labeled with different letters are significantly different from each other (p < 0.0001). (D) Linear filters predicting DAN activity during bouts of continuous movement using forward velocity (Vf, top) or |angular velocity| (|Va|), bottom) centered on an 8 second window. Plots include a 95% confidence interval that is obscured by the thickness of the average line. N=66 animals, recorded for 119 five-minute trials. (E) Overlay of true DAN activity (colored) and predicted DAN activity (gray) generated from linear filters in (D). (F) Proportion of variance (R2adjusted) of γ DAN activity explained by forward velocity and |angular velocity|. Example traces in (E) denoted by opaque point. N=66 animals, 119 five-minute trials.
Figure 3.
Figure 3.. DAN activity during active odor tracking.
(A) Schematic of experimental paradigm (top) where a tethered fly’s heading is yoked to a motor controlling the position of an air tube rotating around the fly. Bottom: top-down view of a tethered fly showing the position of the air tube during upwind and crosswind movement. (B) Top: Representative experiment depicting the fictive 2D trajectory in response to 10 presentations of apple cider vinegar (ACV). Animals were presented with clean air for 30 sec (black) and ACV for 10 sec (orange). Hash mark indicates a ~20 sec break in recording. Bottom: 2D trajectories (top row), |heading| (2nd row), forward velocity (third row), and γ DAN ΔF/Fo (bottom row) for trials in B. (C) Upwind displacement during the odor trial plotted vs Δ|heading| (top) and Δforward velocity (bottom) averaged throughout the odor presentation. Best fit line and Pearson coefficient (r) indicated where relationship is statistically significant (p<.001, Bonferroni correction, see Supplementary Table 2). Fisher r-to-z transformation indicates significant differences in correlation coefficients for upwind displacement - Δforward velocity and upwind displacement - Δ|heading| relationships with z=8.38. N=26 flies, 143 odor presentations. (D) γ DAN ΔF/Fo for all odor presentations, aligned to odor onset. Thick lines indicate average γ DAN activity. Translucent lines represent individual odor presentations. N=26 flies, 143 odor presentations. (E) Linear filters predicting DAN activity using forward velocity (Vf, left) or |heading| (|h|, right) in the odor plume (colored lines) and in clean air (black lines) over a 4 second window (zero mark indicates odor onset). N=26 flies, 143 odor presentations. (F) Average γ DAN ΔF/Fo vs normalized upwind displacement (left), average Δ|heading| (middle), and average Δforward velocity (right) during odor. Best fit line and Pearson coefficient (r) indicated where relationship is significant (p<.001, Bonferroni correction, see Supplementary Table 2). Fisher r-to-z transformation indicates significant differences in correlation coefficients for γ4-Δ|heading| and γ4-Δforward velocity relationship with z=−6.03. N=26 flies, 143 odor presentations.
Figure 4.
Figure 4.. Mushroom body DAN activity - behavior correlations depend on a fly’s navigational strategy.
(A) Representative experiment showing DAN activity and behavior under high airflow conditions. Top: fictive 2D trajectory during a 5 min trial with a 60 sec presentation of apple cider vinegar (orange). Second row: expanded view of the above trajectory, 20 sec period centered at odor onset. |heading| (third row) forward velocity (fourth row) and γ DAN activity (bottom) during that same 20 sec period. (B) Upwind displacement plotted as a function of average Δ|heading| (top) and average Δforward velocity (bottom) during odor presentation. Pearson coefficient (r) indicated where relationship is significant (p<0.0001, Bonferroni correction, see Supplementary Table 2). Fisher r-to-z transformation indicates significant differences in correlation coefficients with z=−7.43. Fisher r-to-z transformation also indicates significant differences in correlation coefficients for upwind displacement - Δforward velocity across the high and low airflow contexts with z=−3.89 but no significant differences in the correlation coefficients for upwind displacement - Δ|heading|. N=22 flies, 52 odor presentations. Linear filters predicting DAN activity using forward velocity (Vf, left) or |heading| (|h|), right) in the odor plume (colored) and in clean air (black, dashed) over a 4 second window (zero mark indicates odor onset). N=22 flies, 52 odor presentations. (D) Average γ DAN ΔF/Fo plotted as a function of net upwind displacement (left), average Δ|heading| (middle) and average Δforward velocity (right) during odor presentation. Pearson coefficient (r) indicated where relationship is significant (p<.01 with Bonferroni correction, see Supplementary Table 2). Fisher r-to-z transformation indicates significant differences in correlation coefficients for γ4-Δ|heading| and γ4-Δforward velocity relationship with z=4.46. Fisher r-to-z transformation indicates significant differences in correlation coefficients for γ4-Δ|heading| and γ4-Δforward velocity relationships across the high and low airflow contexts with z=−1.77 and z=−3.42, respectively. N=22 flies, 52 odor presentations.
Figure 5.
Figure 5.. Analysis of dynamic DAN-motor correlations during odor pursuit.
(A) Schematic of analysis in which linear filters are applied to the experimental forward velocity or |heading| data to predict DAN activity over an odor trial (see methods for details). (B) Average predicted DAN activity plotted as a function of upwind displacement (left), |heading| (middle), and forward velocity (right) for each odor trial under low airflow conditions. Best fit line and Pearson correlation coefficient (r) indicated where relationship is statistically significant (p<.01 with Bonferroni correction, see Supplementary Table 2). N=26 flies, 143 odor presentations. (C) Average predicted DAN activity plotted as a function of experimentally determined upwind displacement (left), average |heading| (middle), and average forward velocity (right) for each odor trial under high airflow conditions. Best fit line and Pearson correlation coefficient (r) indicated where relationship is statistically significant (p<.05 with Bonferroni correction, see Supplementary Table 2). N=22 flies, 52 odor presentations. (D) γ4 DAN activity predicted by applying the high airflow filters to low airflow behavioral data, plotted as a function of experimentally-determined average |heading| (left) and average forward velocity (right) for each odor trial under low airflow conditions. Best fit line and Pearson correlation coefficient (r) indicated where relationship is statistically significant (p<.01 with Bonferroni correction, see Supplementary Table 2). N=26 flies, 143 odor presentations. (E) γ4 DAN activity predicted by applying the low airflow filters to high airflow behavioral data, plotted as a function of the experimentally-determined average |heading| (left) and average forward velocity (right) for each odor trial under high airflow conditions. Best fit line and Pearson correlation coefficient (r) indicated where relationship is statistically significant (p<.01 with Bonferroni correction, see Supplementary Table 2). N=22 flies, 52 odor presentations.
Figure 6.
Figure 6.. DAN responses and odor tracking behavior are altered by satiety state.
(A) Top: schematic depicting that DAN activity and behavior are measured in the same flies prior to (starved) and after consumption of a sucrose meal (fed). Middle: Representative experiment showing the 2D trajectory of a fly walking under low airflow conditions over a 5 min period in response to multiple presentations of apple cider vinegar (ACV, orange) prior to (starved, left) and after a sucrose meal (fed, right with inset zooming into behavior). Bottom: Comparison of indicated trajectories and γ DAN activity prior to and after feeding. (B) Behavioral responses to ACV are diminished once animals are fed. Upwind displacement (left), average |heading| (middle), and average forward velocity (left) of animals prior to (black, starved) and after (maroon, fed) a sucrose meal. Paired two-sided t-test with Bonferroni correction, p<0.05 (*), see Supplementary Table 2. N=10 flies, 102 odor presentations (49 before and 53 after feeding). (C) Average DAN responses to ACV are altered after feeding. Paired two-sided t-test with Bonferroni correction, p<0.05 (*), see Supplementary Table 2, N=10 flies, 102 odor presentations (49 before and 53 after sugar feeding). (D) The relationships between γ DAN activity and behavior in different satiety states. Average z score normalized DAN activity plotted as a function of average |heading| (left), and average forward velocity (right) during odor presentation prior to (black) and after (maroon) feeding. Fisher r-to-z transformation indicates no significant differences in correlation coefficients for γ4-|heading| relationship across starved and fed animals with z=−0.51. Pearson correlation coefficient (r) indicated where relationship is statistically significant (p<0.02 with Bonferroni correction, see Supplementary Table 2). N=10 flies, 49–53 odor presentations.
Figure 7.
Figure 7.. Optogenetic perturbations of DAN subsets acutely influences odor tracking.
(A) Left: Schematic of experimental chamber (left) in which 5–7 naïve flies in continuous laminar flow of clean air were presented with 10 1-sec trials of apple cider vinegar (ACV). On trial 5, the odor presentation was paired with optogenetic inhibition of indicated DAN subsets expressing GtACR1 or activation of DAN subsets expressing CsChrimson. Right: Representative experiment showing the trajectories of individual flies, aligned to common origin and wind direction. The average upwind displacement of all flies in the odor for each trial, measured as the change in center of mass along the axis of airflow is shown at left (magenta bars). (B) Upwind displacement of flies expressing GtACR in PAM DANs (MB042B driver). Thick dark line and circle marks indicate average behavior ± 95% confidence interval. Thin lines represent individual experiments. Trial where odor is paired with optogenetic inhibition is indicated by the green bar. N=63 experimental cohorts of 7 individual flies. (C) Average upwind displacement in the 4 odor presentations preceding optogenetic inhibition (−) and in the trial paired with optogenetic inhibition (+) for the indicated genotypes in starved animals. PAM DANs (MB042B driver)>GtACR1 (N=63, top left), PAM DANs (MB196B driver)>GtACR1 (N=49, top middle), PAM DANs MB042B-Gal4 parental controls (N=33, top right), PPL DANs (MB504B driver)>GtACR1 (N=30, bottom left), γ4 DANs (MB312B driver)>GtACR1 (N=54, bottom middle), UAS-GtACR1 parental controls (N=48, bottom right). Paired two-sided t-test with Bonferroni correction, p<10−10 (***), p<10−5 (**), p<10−4 (*), see Supplementary Table 2. (D) Top: as in (C) but flies are fed and DANs are optogenetically activated with CsChrimson. N=60 paired cohorts of PAM DANs (MB042B driver)>CsChrimson and UAS-CsChrimson parental control animals assayed together during a single experiment. Bottom: average upwind displacement of fed animals in clean air without optogenetic activation (−) and with optogenetic activation (+) for the indicated genotypes. N=44 paired cohorts of PAM DANs (MB042B driver)>CsChrimson and UAS-CsChrimson parental controls animals assayed together during a single experiment. Paired t-test, two-sided, Bonferroni correction, p<10−5 (**), see Supplementary Table 2.
Figure 8.
Figure 8.. A model depicting how dynamic DAN-motor correlations emerge over different timescales.
(A) Schematic model showing how an animal’s context, including whether it is walking spontaneously in clean air or engaged in active odor pursuit, the navigational strategy it employs, and its satiety state, shapes the moment-to-moment relationships between DAN activity and different behavioral variables (grey dial), giving rise to the longer timescale relationships in which DAN activity is preferentially tuned to the motor actions that subserve odor pursuit. An animal’s context also coordinately influences behavior (thick grey arrows). Acute manipulation of DAN activity alters behavior, highlighting how the mushroom body dopaminergic system is embedded within a larger feedback loop (grey dashed arrow). (B) Schematic depicting how the model in (A) produces the behavior and neural activity we observe in the low (left) and high (right) airflow contexts. Under low airflow conditions (left), the γ4-|heading| relationship is selectively strengthened. When a fly encounters the odor, it reorients and elevated γ4 DAN activity promotes upwind tracking towards the odor source. Conversely, under high airflow conditions (right), the γ4 DAN activity-forward velocity relationship is selectively strengthened. When a fly encounters the odor, increased γ4 DAN activity also promotes upwind tracking towards the odor source despite a fly using different actions for pursuit.

Similar articles

Cited by

References

    1. Bargmann CI & Marder E From the connectome to brain function. Nat. Methods 10, 483–490 (2013). - PubMed
    1. Schultz W, Dayan P, & Montague PR A neural substrate of prediction and reward. Science 275, 1593–1599 (1997). - PubMed
    1. Watabe-Uchida M, Eshel N & Uchida N Neural Circuitry of Reward Prediction Error. Annu. Rev. Neurosci 40, 373–394 (2017). - PMC - PubMed
    1. Waddell S Reinforcement signalling in Drosophila; dopamine does it all after all. Curr. Opin. Neurobiol 23, 324–329 (2013). - PMC - PubMed
    1. Da Silva JA, Tecuapetla F, Paixão V & Costa RM Dopamine neuron activity before action initiation gates and invigorates future movements. Nature 554, 244–248 (2018). - PubMed

Publication types

LinkOut - more resources