. 2021 Nov;3(11):1552-1568.
doi: 10.1038/s42255-021-00481-w. Epub 2021 Oct 25.

Sex-specific genetic regulation of adipose mitochondria and metabolic syndrome by Ndufv2

Affiliations

Sex-specific genetic regulation of adipose mitochondria and metabolic syndrome by Ndufv2

Karthickeyan Chella Krishnan et al. Nat Metab. 2021 Nov.

Abstract

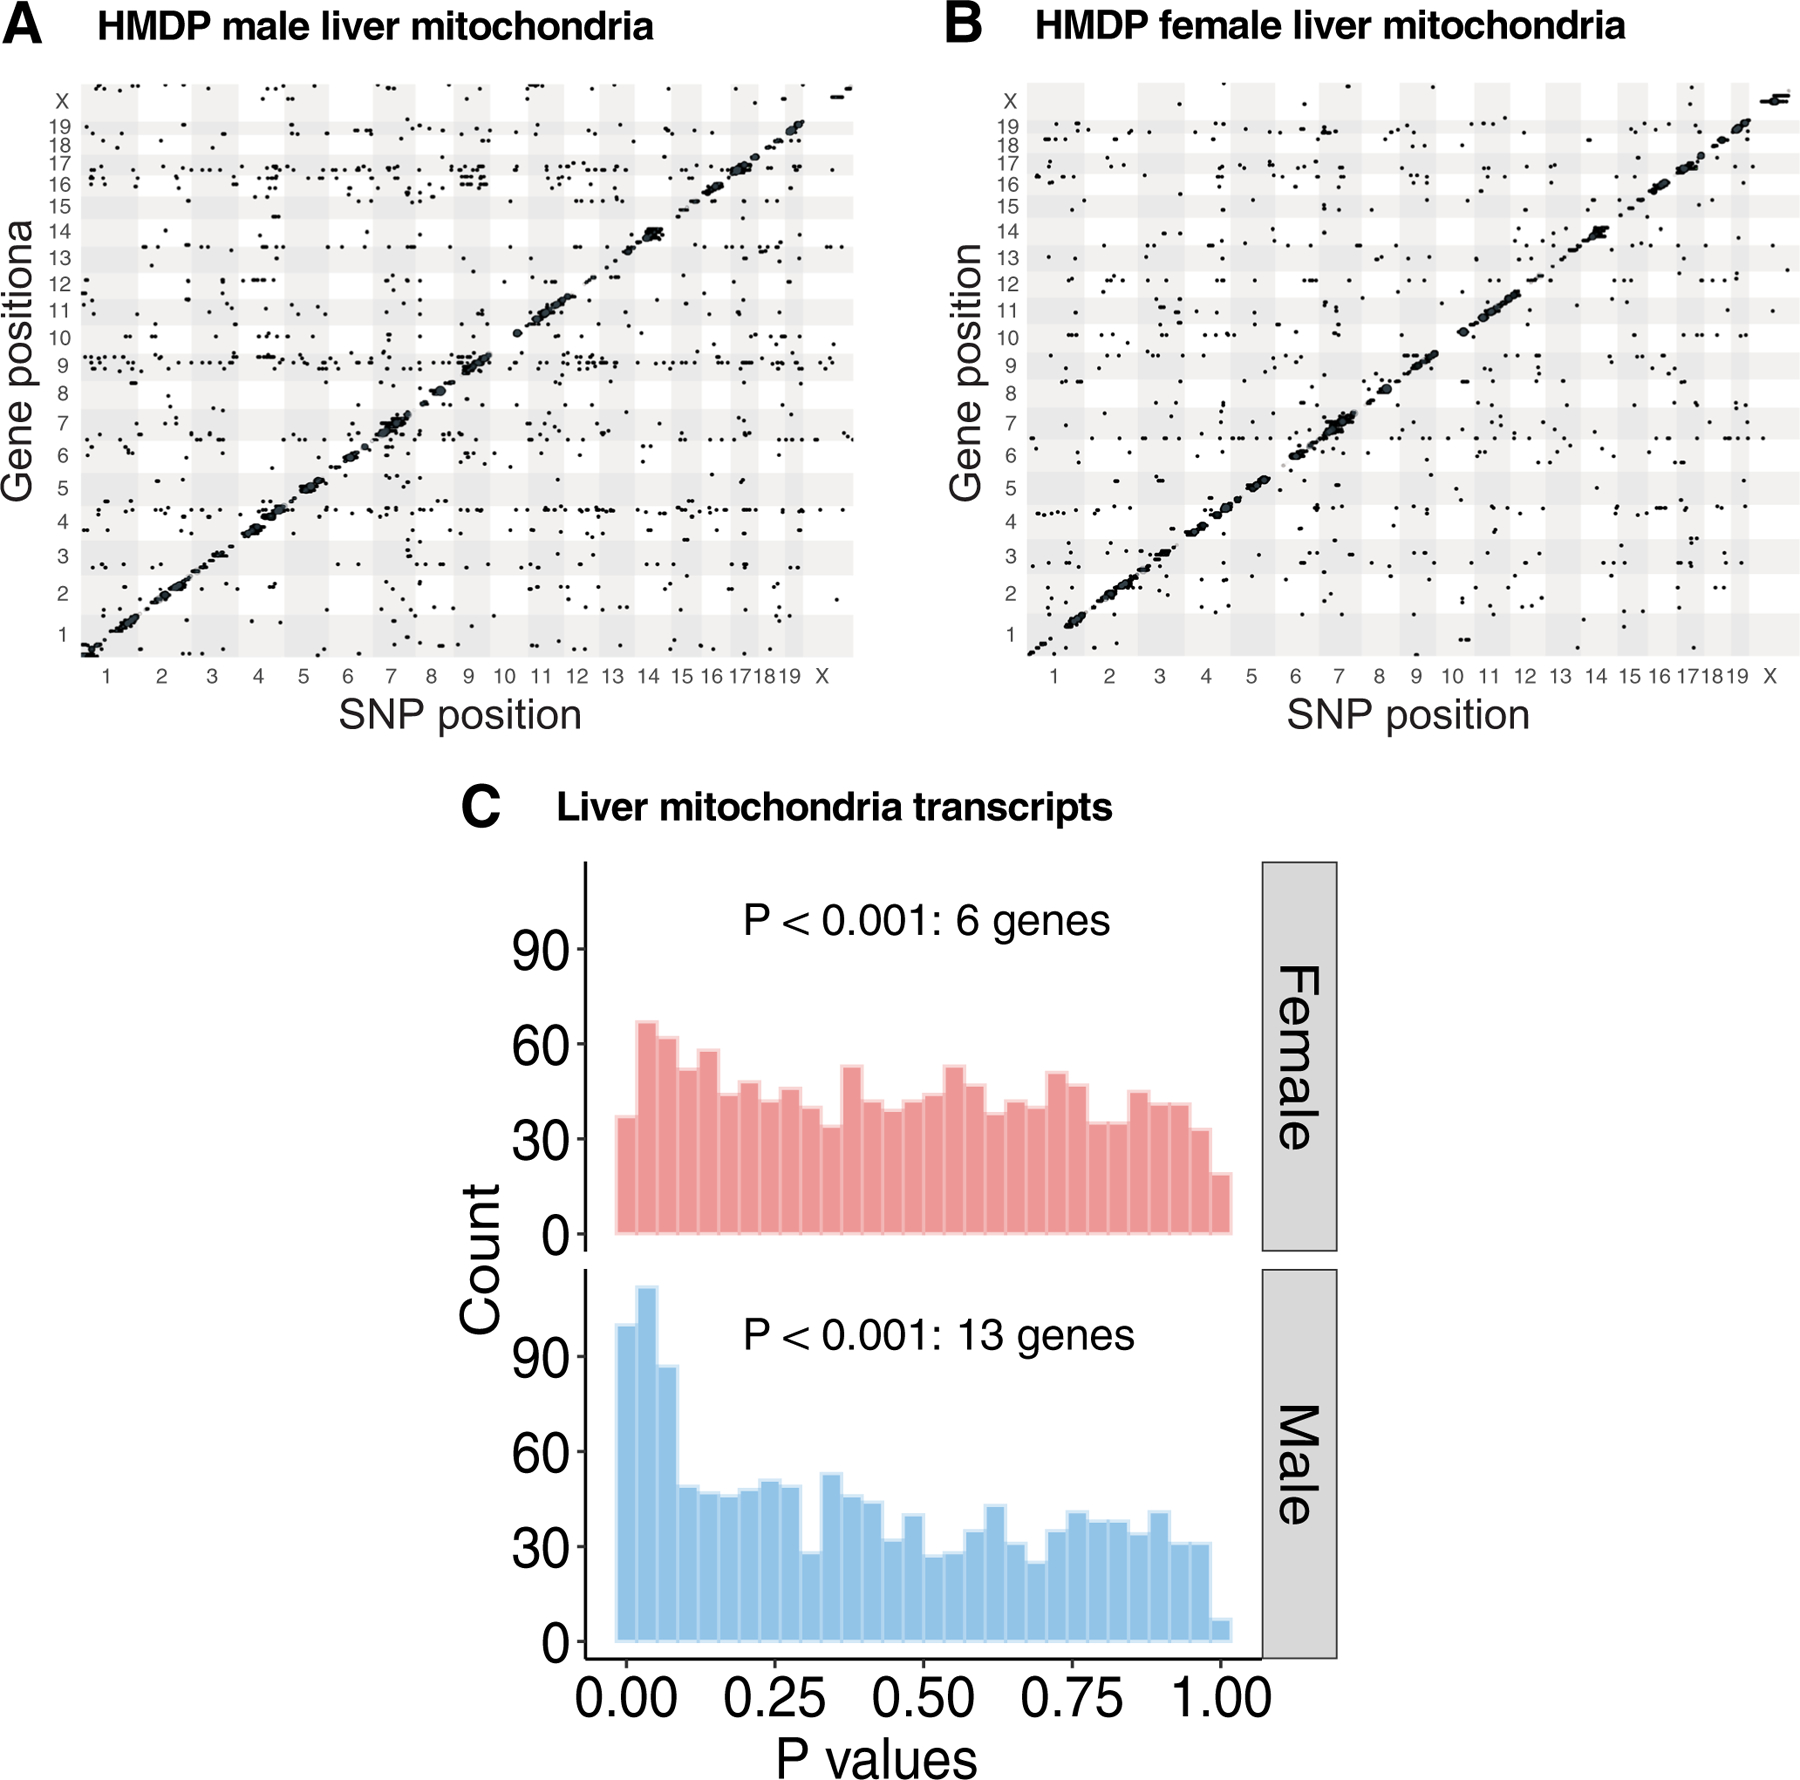
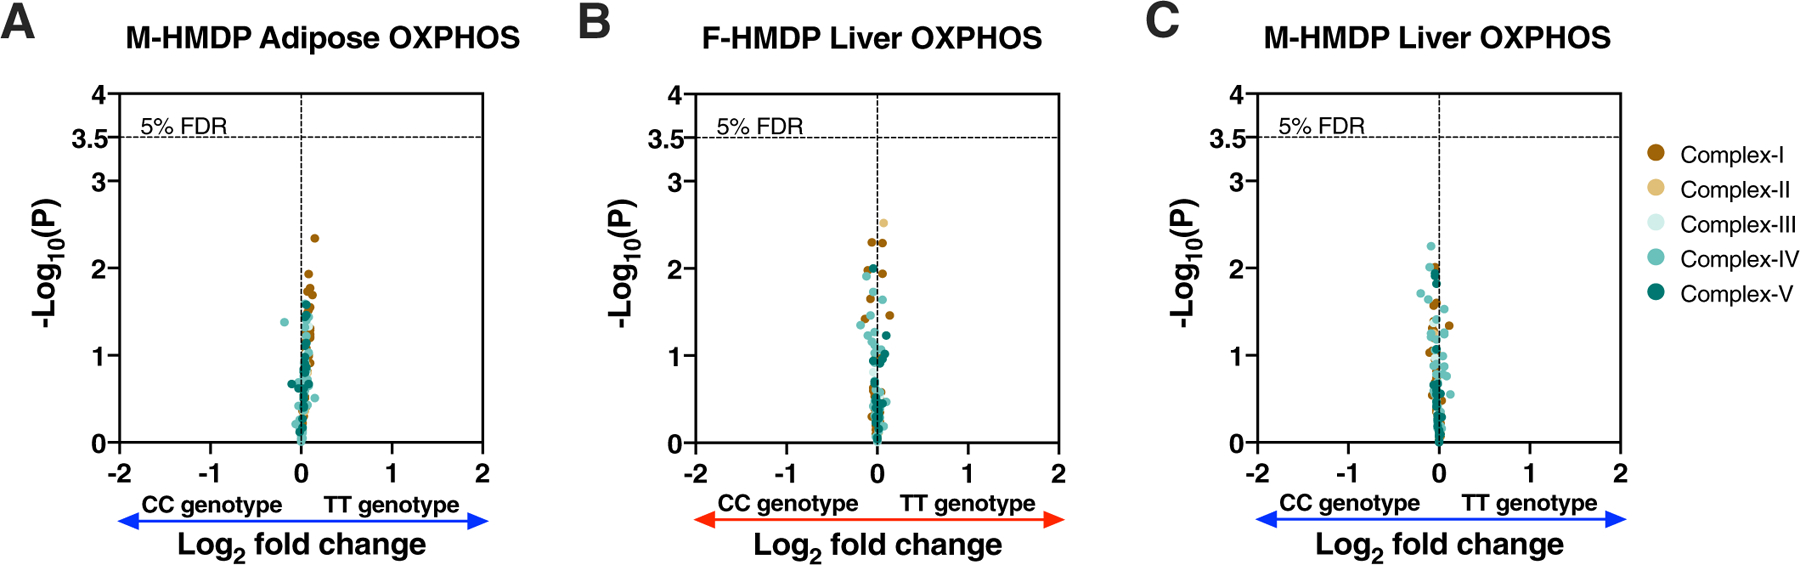
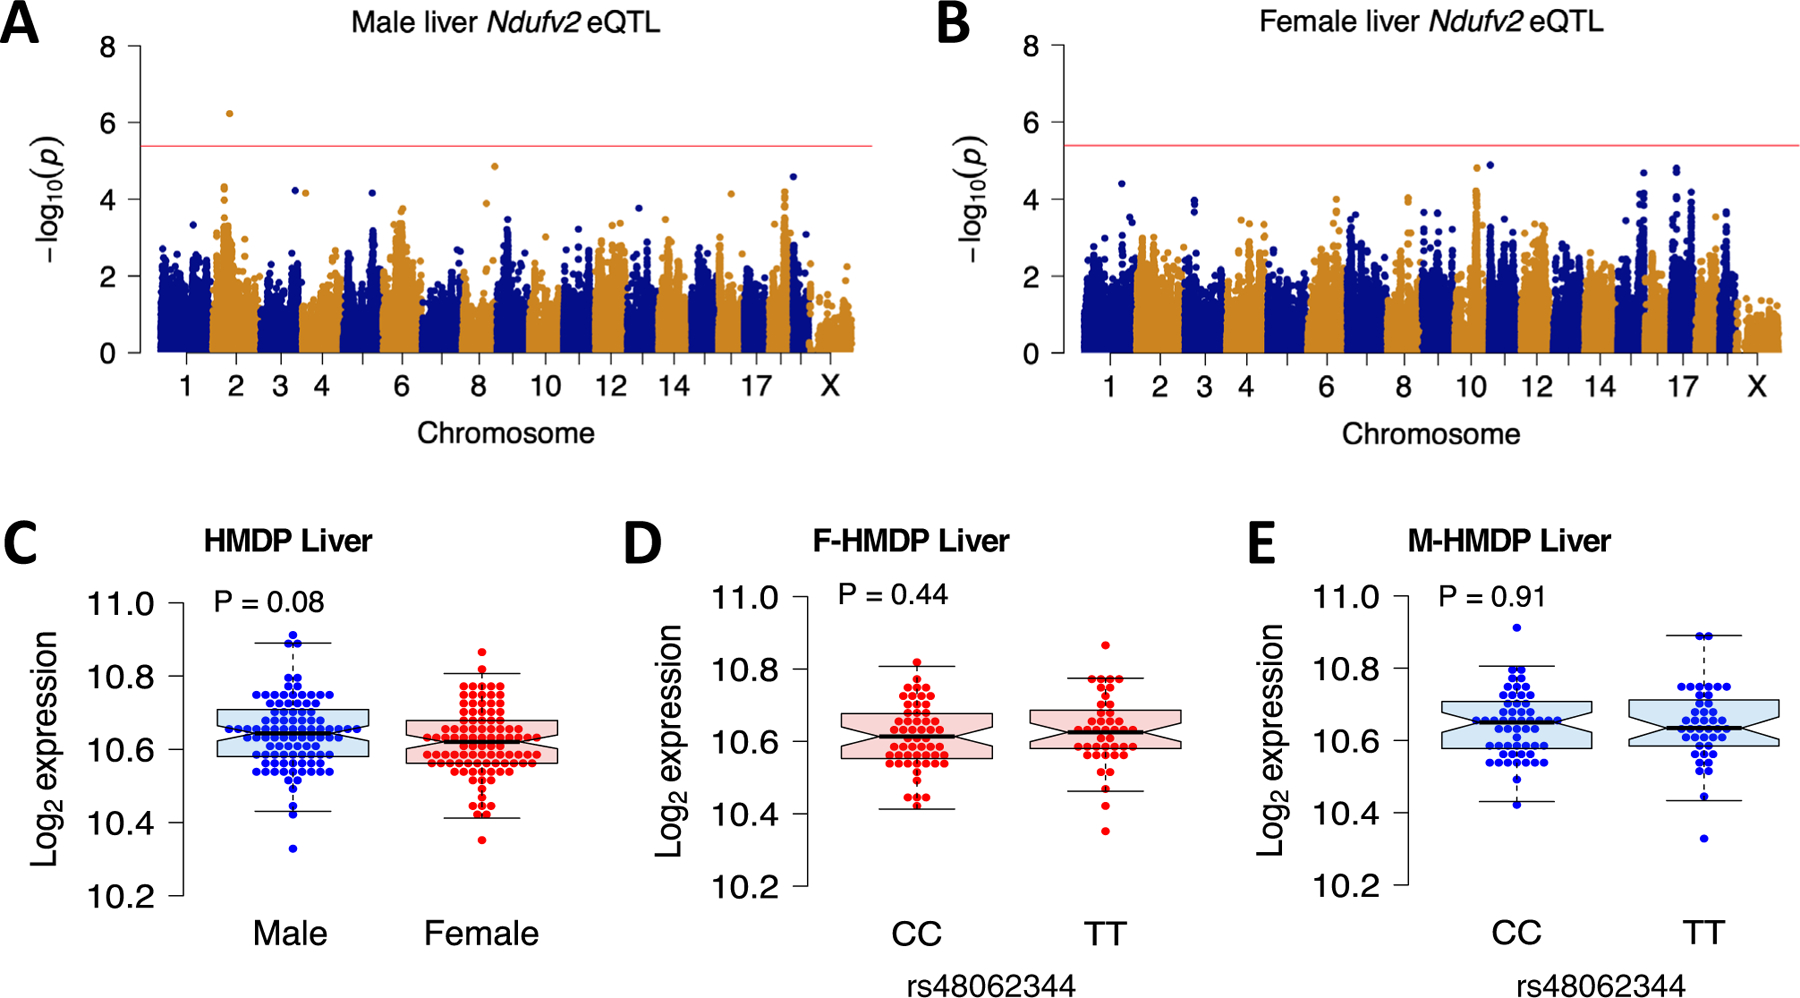
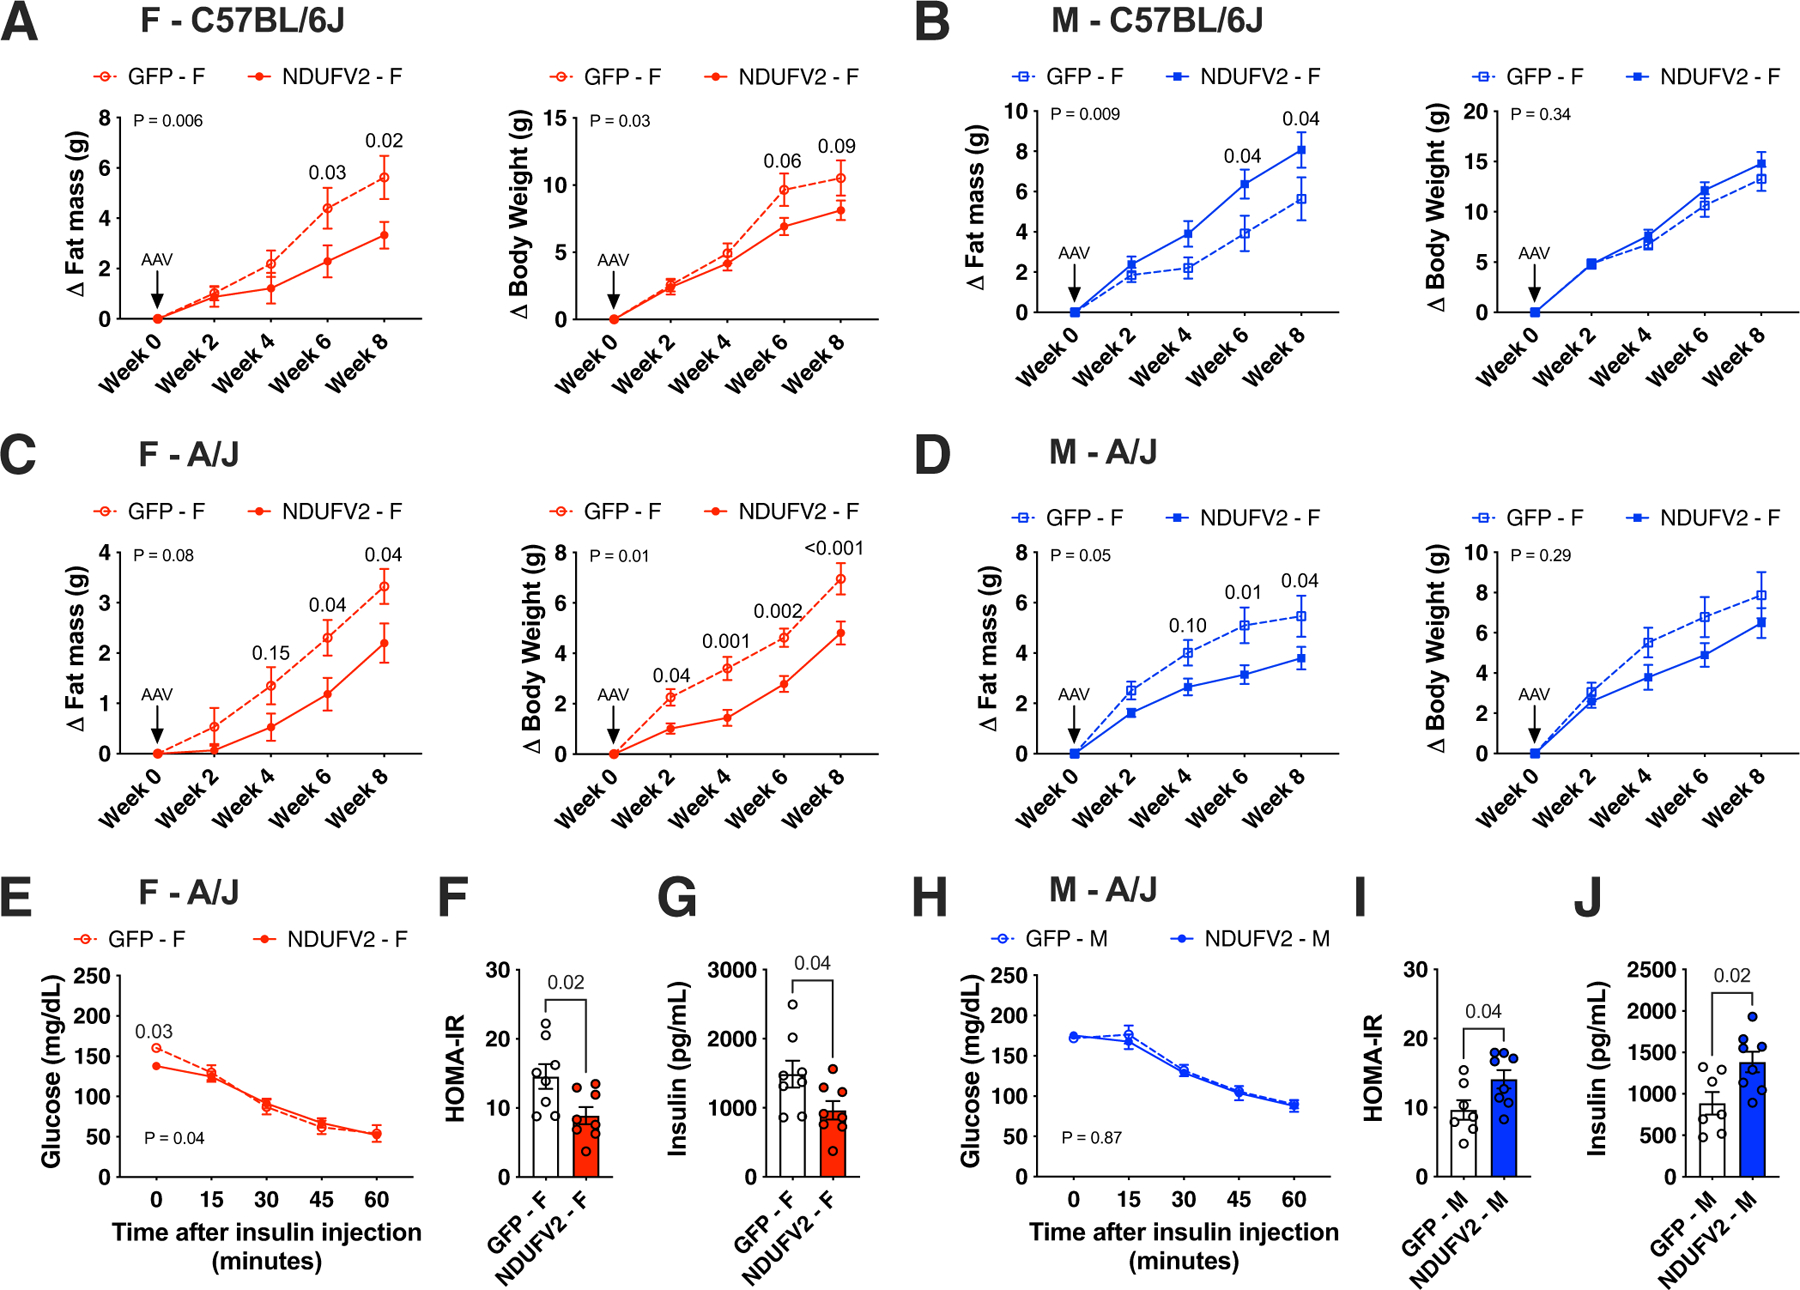
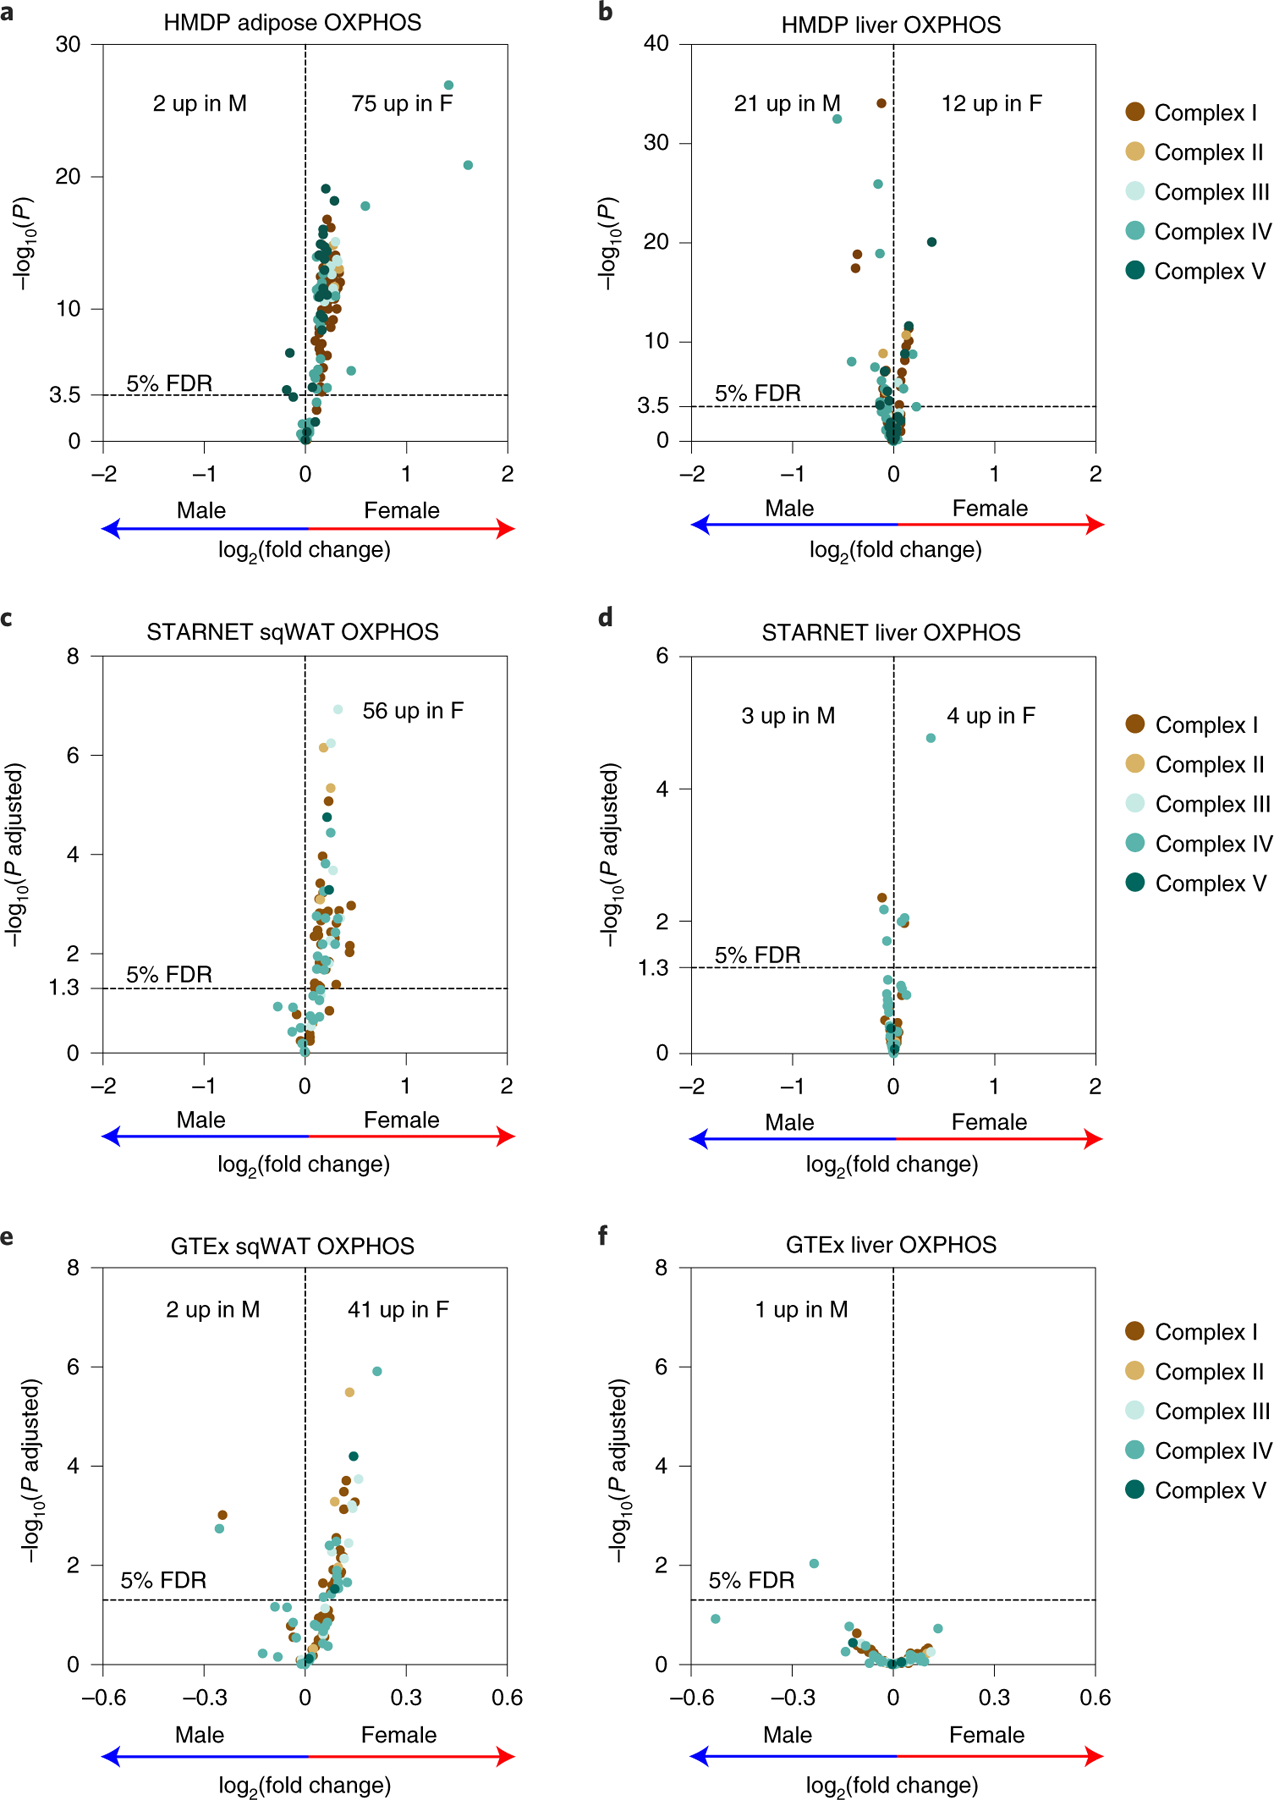
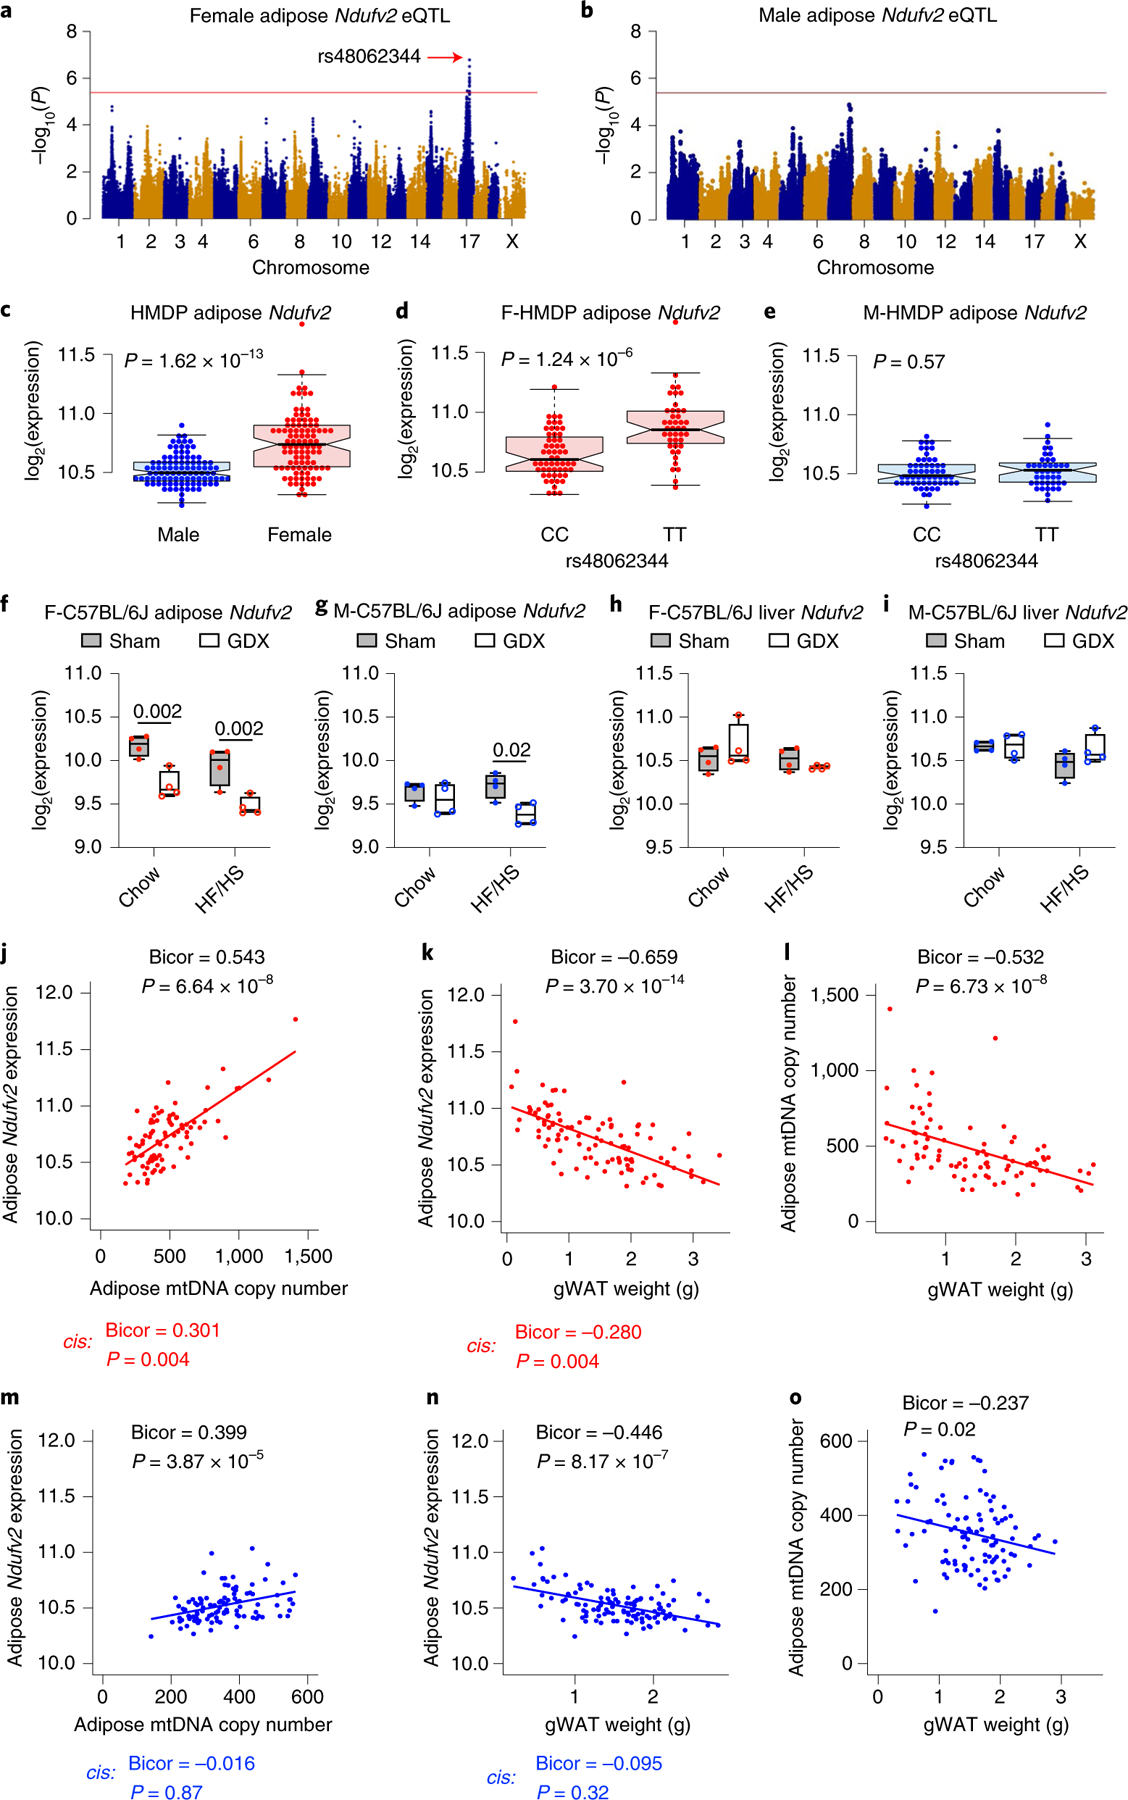
We have previously suggested a central role for mitochondria in the observed sex differences in metabolic traits. However, the mechanisms by which sex differences affect adipose mitochondrial function and metabolic syndrome are unclear. Here we show that in both mice and humans, adipose mitochondrial functions are elevated in females and are strongly associated with adiposity, insulin resistance and plasma lipids. Using a panel of diverse inbred strains of mice, we identify a genetic locus on mouse chromosome 17 that controls mitochondrial mass and function in adipose tissue in a sex- and tissue-specific manner. This locus contains Ndufv2 and regulates the expression of at least 89 mitochondrial genes in females, including oxidative phosphorylation genes and those related to mitochondrial DNA content. Overexpression studies indicate that Ndufv2 mediates these effects by regulating supercomplex assembly and elevating mitochondrial reactive oxygen species production, which generates a signal that increases mitochondrial biogenesis.


Conflict of interest statement

Competing interests

The authors declare no competing interests.

Figures

Extended Data Fig. 1 |
Extended Data Fig. 1 |. Chr17 locus is not associated with liver mitochondria.
Related to Fig. 3. High-resolution association mapping of 911 (1312 probes) mitochondrial gene abundance levels from (a) male and (b) female liver tissues isolated from ~100 HMDP strains to identify eQTL networks. The X- and Y- axis represent SNP and gene position on the mouse genome, respectively. Each dot represents a significant association. (c) Frequency distributions of P values of association between the chr17 trans-eQTL lead eSNP (rs48062344) and mitochondria-related transcripts in the male and female liver tissues. P values of association were calculated using (A – C) FaST-LMM that uses Likelihood-Ratio test.
Extended Data Fig. 2 |
Extended Data Fig. 2 |. Chr17 trans-eQTL do not affect the expression profiles of oXPHoS genes in male adipose or both sexes of liver tissues.
Related to Fig. 4. Volcano plots showing genetic (lead SNP of chr17 locus) differences in the expression profiles of OXPHOS genes in the (a) male adipose (n = 98 male strains; CC: 56 & TT: 42); (b) female and (c) male liver (n = 97 sex-matched strains; CC: 55 & TT: 42) isolated from HMDP. Genes corresponding to individual OXPHOS complexes are color-coded. Horizontal dotted lines represent 5% FDR-corrected significance threshold. Data are presented as log2 fold change between genotype. P values were calculated using (A – C) DESeq2 Bioconductor package that uses Wald test.
Extended Data Fig. 3 |
Extended Data Fig. 3 |. Association mapping of adipose mtDNA levels in HMDP.
Related to Fig. 4. Association mapping of mtDNA levels from (a) female and (b) male adipose in the HMDP cohort (n = 216 female and 260 male mice) Red line represents significance threshold (HMDP: P = 4.1E-06). P values of association were calculated using (A – B) FaST-LMM that uses Likelihood-Ratio test.
Extended Data Fig. 4 |
Extended Data Fig. 4 |. Liver Ndufv2 is unaffected by the chr17 trans-eQTL locus.
Related to Fig. 5. Association mapping of (a) male and (b) female liver Ndufv2 expression from HMDP. Red line represents significance threshold (P = 4.1E-06). (ce) Sex and genetic (lead SNP of chr17 locus) differences in the liver Ndufv2 expression from HMDP (n = 97 sex-matched strains; CC: 55 & TT: 42). Data are presented as median and interquartile range (boxplots). P values were calculated using (A – B) FaST-LMM that uses Likelihood-Ratio test; (C – E) Unpaired two-tailed Student’s t test.
Extended Data Fig. 5 |
Extended Data Fig. 5 |. Changes in body weight and insulin sensitivity mediated by adipose Ndufv2 overexpression.
Related to Fig. 6. Eight-week old females or males of (ab) C57BL/6 J or (cj) A/J mice were injected with AAV vectors expressing either GFP or NDUFV2 in an adipose-specific manner and fed a HF/HS diet for eight additional weeks. Changes in (A - D) fat mass and total body weight measured every two-weeks (females n = 7 per group; males n = 8 per group), (E and H) ITT, (F and I) end-point HOMA-IR and (G and J) fasting insulin levels (F – A/J n = 8 per group; M – A/J GFP n = 7, NDUFV2 n = 8) are shown. Data are presented as mean ± SEM. P values were calculated using (A – E and H) Repeated measures 2-factor ANOVA corrected by post-hoc ‘Holm-Sidak’s’ multiple comparisons test; (F, G, I and J) Unpaired two-tailed Student’s t test.
Extended Data Fig. 6 |
Extended Data Fig. 6 |. Adipose Ndufv2 overexpression regulated adiposity in a sex-by-strain manner.
Related to Fig. 6. Eight-week old males of (ae) C57BL/6 J or (fj) A/J mice were injected with AAV vectors expressing either GFP or NDUFV2 in an adipose-specific manner and fed a HF/HS diet for eight additional weeks. Metabolic traits such as (A and F) total mass and food intake; (B and G) fat and lean mass were monitored over eight weeks. Comparisons of (C and H) adipose Ndufv2 expression; (D and I) plasma free glycerol; (E and J) tissue weights from C57BL/6 J and A/J males, respectively. Data are presented as mean ± SEM (n = 8 per group). P values were calculated using (A and F) Repeated measures 2-factor or (B and G) 3-factor or (E and J) 2-factor ANOVA corrected by post-hoc ‘Holm-Sidak’s’ multiple comparisons test; (C, D, H and I) Unpaired two-tailed Student’s t test.
Extended Data Fig. 7 |
Extended Data Fig. 7 |. Adipose Ndufv2 overexpression regulated adipocyte size in a sex-by-strain manner.
Related to Fig. 7. Comparisons of adipocyte size distribution in the gonadal adipose tissues from females and males of (ab) C57BL/6 J or (cd) A/J mice overexpressing GFP or NDUFV2, respectively. Representative histological sections are shown for each group (scale: 100 µm). Red and blue shades (or bars) represent female and male NDUFV2 datapoints, while brown represents respective GFP datapoints, respectively. Data are presented as frequency distribution of adipocyte sizes or mean ± SEM (F – C57BL/6 J GFP n = 5064 cells from 7 mice, NDUFV2 n = 5249 cells from 7 mice; M – C57BL/6 J GFP n = 11721 cells from 8 mice, NDUFV2 n = 7290 cells from 7 mice; F – A/J GFP n = 5423 cells from 7 mice, NDUFV2 n = 4687 cells from 7 mice; M – A/J GFP n = 4084 cells from 8 mice, NDUFV2 n = 4863 cells from 8 mice). P values were calculated using Unpaired two-tailed Student’s t test.
Extended Data Fig. 8 |
Extended Data Fig. 8 |. Adipose Ndufv2 overexpression regulated mitochondrial respiration in a sex-by-strain manner.
Related to Fig. 7. Comparisons of mitochondrial RCR and coupling efficiency in the gonadal adipose tissues from males of (ab) C57BL/6 J or (cd) A/J mice overexpressing GFP or NDUFV2, respectively. Coupling assays of isolated gonadal adipose mitochondria from females and males of (ef) C57BL/6 J or (gh) A/J mice overexpressing GFP or NDUFV2, respectively. Data are presented as mean ± SEM (n = 4 per group). P values were calculated using 2-factor ANOVA.
Extended Data Fig. 9 |
Extended Data Fig. 9 |. Adipose Ndufv2-mediated mitochondrial regulation is not a consequence of body weight.
Related to Fig. 7. Eight-week old female C57BL/6 J mice were fed a HF/HS diet for the first six weeks without any intervention, after which were injected with AAV vectors expressing either GFP or NDUFV2 in an adipose-specific manner and diet continued for six additional weeks. Metabolic traits such as (a) total mass; (b) fat and lean mass were monitored over 12 weeks. Comparisons of (c) tissue weights; (d) adipose Ndufv2 expression; (e) mitochondrial RCR; (f) coupling efficiency and (g) coupling respiration rates between GFP and NDUFV2 animals, respectively. Data are presented as mean ± SEM (n = 6 per group). P values were calculated using (A) Repeated measures 2-factor or (B) 3-factor or (C and G) 2-factor ANOVA corrected by post-hoc ‘Holm-Sidak’s’ multiple comparisons test; (D – F) Unpaired two-tailed Student’s t test.
Extended Data Fig. 10 |
Extended Data Fig. 10 |. Ndufv2 overexpression regulated mitochondrial function in both AML12 (liver) and differentiated 3T3-L1 (adipose) cells.
Related to Fig. 8. Comparisons between GFP and NDUFV2 overexpressing AML12 (liver) cells in (a) relative normalized expression values of Ndufv2 (n = 9 per group); Coupling assays and RCR with all three complex I substrates (Pyruvate, Palmitoyl carnitine and Glutamate) either added (be) together (n = 5 per group) or (f - m) separately (n = 4 per group except Glutamate, n = 8 per group); and (N) relative normalized expression values of Ndufs4 (complex I), Sdhc (complex II), Atp5a1 (complex V) and Cpt1a (FAO) (n = 9 per group). Similarly, comparisons between control and NDUFV2 overexpressing differentiated 3T3-L1 cells in (O – R) coupling assays and RCR with different substrates (Pyruvate, Palmitoyl carnitine and Succinate) added separately (n = 6 per group). Data are presented as mean ± SEM. P values were calculated using (A and J – N) Unpaired two-tailed Student’s t test; (B – I and O – R) 2-factor ANOVA corrected by post-hoc ‘Holm-Sidak’s’ multiple comparisons test.
Fig. 1 |
Fig. 1 |. Sex and tissue-specific expression profiles of oXPHoS genes in both mice and humans.
af, Volcano plots showing sex differences in the expression profiles of OXPHOS genes in a, adipose (n = 98 sex-matched strains) and b, liver tissues (n = 97 sex-matched strains) isolated from HMDP. To check for translational relevance, we examined the sex differences in the expression profiles of OXPHOS genes in the c, subcutaneous adipose and d, liver tissues from the STARNET cohort (n = 600 patients) or e, subcutaneous adipose and f, liver tissues from the human GTEx cohort (n = 663 adipose or 226 liver donors), respectively. Genes corresponding to individual OXPHOS complexes are colour coded. Horizontal dotted lines represent 5% false discovery rate (FDR)-corrected significance threshold. Data are presented as log2(fold change) between sex. P values were calculated using DESeq2 Bioconductor
Fig. 2 |
Fig. 2 |. Adipose mitochondria levels strongly predict metabolic traits in both mice and humans.
a, Sex differences in the adipose mtDNA levels isolated from HMDP (n = 90 female and 104 male strains). Bicorrelation plots of female or male adipose mtDNA levels and b, body weight or c, HOMA-IR levels in HMDP. d, Distribution of mtDNA levels isolated from adipose (n = 483) and blood (n = 179) from the human Metabolic Syndrome in Men (METSIM) cohort. Bicorrelation plots of adipose or blood mtDNA levels and e, body mass index or f, HOMA-IR levels in METSIM. g, List of bicorrelations between adipose or blood mtDNA levels and multiple metabolic traits in the METSIM cohort. Red and blue dots represent female and male HMDP datapoints, respectively. Yellow and grey dots (or bars) represent adipose and blood from METSIM, respectively. Data are presented as median and interquartile range (boxplots). P values were calculated using (a) unpaired two-tailed Student’s t-test; (b, c, eg) BicorAndPvalue function of the WGCNA R-package that uses unpaired two-tailed Student’s t-test. See also Supplementary Tables 1 and 2.
Fig. 3 |
Fig. 3 |. Sex-specific genetic architecture of adipose mitochondrial gene expression.
High-resolution association mapping of 911 (1,312 probes) mitochondrial gene abundance levels from a, male and b, female adipose tissues isolated from ~100 HMDP strains to identify eQTL networks. The x and y axis represent SNP and gene position on the mouse genome, respectively. Each dot represents a significant association. Associations between gene expression and genetic variants located within 1 Mb of the respective gene location were considered as cis-eQTLs (P < 1 × 10⁻⁵) and are shown along the diagonal axis and the rest were considered as trans-eQTLs (P < 1 × 10⁻⁶). Based on these criteria, we uncovered a distinct female-specific trans-eQTL hotspot located on chr17 that significantly controls 89 adipose genes (red arrow). c, Frequency distributions of P values of association between the chr17 trans-eQTL lead eSNP (rs48062344) and mitochondria-related transcripts in the male and female adipose tissues. d, Circos plot representation of the female-specific chr17 trans-eQTL hotspot and the genomic location of 89 target adipose mitochondrial genes (P < 1 × 10⁻⁶). P values of association (ad) were calculated using factored spectrally transformed linear mixed models (FaST-LMM) that uses the likelihood ratio test. See also Extended Data Fig. 1.
Fig. 4 |
Fig. 4 |. Chr17 trans-eQTL controls metabolic syndrome traits in HMDP.
a, Volcano plots showing genetic (lead SNP of chr17 locus) differences in the expression profiles of OXPHOS genes in the female adipose (n = 98 female strains; CC: 56 and TT: 42). Genotype distribution plots of mtDNA levels in the b, female and c, male adipose at chr17 trans-eQTL lead SNP, respectively (n = 89 female (CC: 51 and TT: 38) and 104 male (CC: 57 and TT: 47) strains). d, Sex differences in the variance explained by the chr17 trans-eQTL lead SNP (rs48062344) for multiple metabolic traits in HMDP. Genotype distribution plots of gonadal white adipose tissue (gWAT) weights in the e, female and f, male HMDP at chr17 trans-eQTL lead SNP, respectively (n = 98 sex-matched strains; CC: 56 and TT: 42). g, The Ndufv2 gene locus is shown on mouse chromosome 17 from 66 to 68 Mb. Linkage disequilibrium (LD), calculated by R2 to gonadal gWAT s48062344 (green vertical line), which was the chr17 trans-eQTL lead SNP as well as peak cis-eQTL for Ndufv2, is shown in the upper triangular heatmap. Red pixels indicate complete LD between pairwise genomic segments. The LD block from 66 to 67.5 Mb was subjected to motif mutation analysis for the ERE motif and the top two variants, rs3713670 and rs46900561, whose reference (C57BL6/J) alleles decrease ERE motif scores are highlighted by red and yellow arrows, respectively. The ERE motif position weight matrix is shown beneath each sequence alignment. h, Genotype distribution plots of gWAT weights in the female and male HMDP at the top variant, rs3713670 (n = 102 female (AA: 49 and TT: 53) and 111 male (AA: 54 and GG: 57) strains). Red and blue dots (or bars) represent female and male HMDP datapoints (or associations), respectively. Data are presented as median and interquartile range (boxplots). P values were calculated using DESeq2 Bioconductor package that uses Wald test (a) or unpaired two-tailed Student’s t-test (b, c, e, f and h). See also Extended Data Figs. 2 and 3 and Supplementary Table 3.
Fig. 5 |
Fig. 5 |. Adipose Ndufv2 is the causal regulator of chr17 trans-eQTL locus.
Association mapping of a, female and b, male adipose Ndufv2 expression from HMDP. The red line represents the significance threshold (P = 4.1 × 10⁻⁶). Adipose Ndufv2 expression between c, sex or genotypes (lead SNP of chr17 locus) within d, female or e, male HMDP (n = 98 sex-matched strains; CC: 56 and TT: 42). Average Ndufv2 expression in f, female and g, male adipose or h, female and i, male liver isolated from intact or gonadectomized C57BL/6 J mice of both sexes (n = 4 per group). Bicorrelation plots between adipose Ndufv2 and j, mtDNA levels or k, gWAT weights, and l, between adipose mtDNA levels and gWAT weights from female HMDP (n = 86–103 female strains). Similarly, bicorrelation plots between adipose Ndufv2 and m, mtDNA levels or n, gWAT weights, and o, between adipose mtDNA levels and gWAT weights from male HMDP (n = 100–112 male strains). Red and blue dots represent female and male HMDP datapoints, respectively. Data are presented as median and interquartile range (boxplots). P values were calculated using FaST-LMM that uses the likelihood ratio test (a, b), unpaired two-tailed Student’s t-test (ce), two-factor analysis of variance (ANOVA) corrected by post-hoc Holm–Sidak’s multiple comparisons test (fi) or BicorAndPvalue function of the WGCNA R-package that uses unpaired two-tailed Student’s t-test (jo). See also Extended Data Fig. 4.
Fig. 6 |
Fig. 6 |. Adipose Ndufv2 overexpression regulated adiposity in a strain-by-sex manner.
Eight-week-old females of ae, C57BL/6 J or fj, A/J mice were injected with AAV vectors expressing either GFP or NDUFV2 in an adipose-specific manner and fed a HF/HS diet for 8 additional weeks. Metabolic traits such as a, total mass and food intake; b, fat and lean mass were monitored over 8 weeks. Comparisons of c, adipose Ndufv2 expression; d, plasma free glycerol; e, tissue weights from C57BL/6 J females overexpressing GFP or NDUFV2, respectively. Similarly, f, total mass and food intake; g, fat and lean mass; h, adipose Ndufv2 expression; i, plasma free glycerol and j, tissue weights were measured from A/J females overexpressing GFP or NDUFV2, respectively. Data are presented as mean ± s.e.m. (n = 7 per group). P values were calculated using repeated measures two-factor (a, f) or three-factor (b, g) or two-factor (e, j) ANOVA corrected by post-hoc Holm–Sidak’s multiple comparisons test, or unpaired two-tailed Student’s t-test (c, d, h, i). See also Extended Data Figs. 5– and 6 and Supplementary Fig. 1.
Fig. 7 |
Fig. 7 |. Adipose Ndufv2 overexpression regulated mitochondria in a strain-by-sex manner.
Relative normalized expression values of Ndufv2 (complex I), Sdhc (complex II), Atp5a1 (complex V) and Cpt1a (FAO) in gonadal adipose tissues from a, female and b, male C57BL/6 J or c, female and d, male A/J mice overexpressing GFP or NDUFV2, respectively (C57BL/6 J n = 5 per group; A/J n = 6 per group). e, Representative immunoblots probed for OXPHOS proteins (CI to CV) and vinculin as a loading control, and their corresponding quantifications (females n = 4 per group; males n = 3 per group). Comparisons of f, mitochondrial RCR and g, coupling efficiency in the gonadal adipose tissues from female C57BL/6 J mice overexpressing GFP or NDUFV2, respectively (n = 4 per group). Similarly, h, RCR and i, coupling efficiency were measured in the gonadal adipose tissues from female A/J mice overexpressing GFP or NDUFV2, respectively (n = 4 per group). Red and blue dots (or bars) represent female and male datapoints, respectively. Data are presented as mean ± s.e.m. P values were calculated using unpaired two-tailed Student’s t-test. See also Extended Data Figs. 7–9 and Supplementary Fig. 2.
Fig. 8 |
Fig. 8 |. Adipose Ndufv2 overexpression increased mitochondrial biogenesis and protein levels via RoS generation by altering supercomplex composition in a strain-by-sex manner.
Comparisons of a, MTDR staining of the mitochondria and b, frozen respirometry quantifications in frozen gonadal adipose homogenates between GFP and NDUFV2 overexpressing female A/J mice (GFP n = 6; NDUFV2 n = 8). Similarly, c, MTDR staining of the mitochondria and d, frozen respirometry quantifications were measured between GFP and NDUFV2 overexpressing male A/J mice (GFP n = 7; NDUFV2 n = 8). Likewise, e, frozen respirometry quantifications and f, immunoblot analyses of CPT1a, LCAD, UCP1 and vinculin (loading control) levels and their corresponding quantifications from female C57BL/6 J mice (n = 7 per group except UCP1 n = 4 per group) and g, frozen respirometry quantifications and h, immunoblot analyses of CPT1a, LCAD, UCP1 and vinculin (loading control) levels and their corresponding quantifications from male C57BL/6 J mice (n = 8 per group except UCP1 n = 4 per group), respectively, are shown. Finally, i, immunoblot staining of NDUFV2 overexpression; j, oxygen consumption rates before and after the addition of N-acetylcysteine (NAC) (n = 10 replicates per group), and k, blue native gel electrophoreses followed by immunoblotting for NDUFA9 (complex I), Core2 (complex III) and SDHA (complex II) for supercomplex visualization in stably transduced differentiated 3T3-L1 cells are shown. Data are presented as mean ± s.e.m. P values were calculated using two-factor ANOVA corrected by post-hoc Holm–Sidak’s multiple comparisons test (b, d, h, j) or unpaired two-tailed Student’s t-test (a, c, j). See also Extended Data Fig. 10 and Supplementary Fig. 3.

References

    1. Seldin M, Yang X & Lusis AJ Systems genetics applications in metabolism research. Nat. Metab 1, 1038–1050 (2019). - PMC - PubMed
    1. Bennett BJ et al. A high-resolution association mapping panel for the dissection of complex traits in mice. Genome Res 20, 281–290 (2010). - PMC - PubMed
    1. Parks BW et al. Genetic control of obesity and gut microbiota composition in response to high-fat, high-sucrose diet in mice. Cell Metab 17, 141–152 (2013). - PMC - PubMed
    1. Parks BW et al. Genetic architecture of insulin resistance in the mouse. Cell Metab 21, 334–347 (2015). - PMC - PubMed
    1. Chella Krishnan K et al. Sex-specific metabolic functions of adipose Lipocalin-2. Mol. Metab 30, 30–47 (2019). - PMC - PubMed

Publication types

MeSH terms