. 2021 Dec;16(12):1424-1434.
doi: 10.1038/s41565-021-00982-5. Epub 2021 Oct 25.

Nano-optogenetic engineering of CAR T cells for precision immunotherapy with enhanced safety

Affiliations

Nano-optogenetic engineering of CAR T cells for precision immunotherapy with enhanced safety

Nhung Thi Nguyen et al. Nat Nanotechnol. 2021 Dec.

Abstract

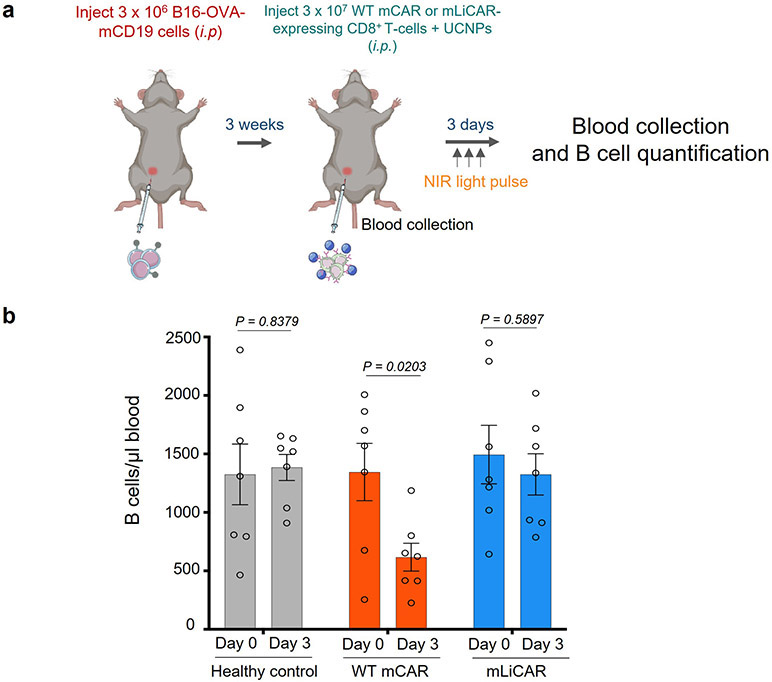
Chimeric antigen receptor (CAR) T cell-based immunotherapy, approved by the US Food and Drug Administration, has shown curative potential in patients with haematological malignancies. However, owing to the lack of control over the location and duration of the anti-tumour immune response, CAR T cell therapy still faces safety challenges arising from cytokine release syndrome and on-target, off-tumour toxicity. Herein, we present the design of light-switchable CAR (designated LiCAR) T cells that allow real-time phototunable activation of therapeutic T cells to precisely induce tumour cell killing. When coupled with imaging-guided, surgically removable upconversion nanoplates that have enhanced near-infrared-to-blue upconversion luminescence as miniature deep-tissue photon transducers, LiCAR T cells enable both spatial and temporal control over T cell-mediated anti-tumour therapeutic activity in vivo with greatly mitigated side effects. Our nano-optogenetic immunomodulation platform not only provides a unique approach to interrogate CAR-mediated anti-tumour immunity, but also sets the stage for developing precision medicine to deliver personalized anticancer therapy.


Figures

Extended Data Fig. 1
Extended Data Fig. 1. Design and screening of CRY2- and LOV2-based LiCARs.
a, Constructs used to screen and optimize the designed LiCARs (Components I+II). The inset showed confocal images of HeLa cells expressing the PM-embedded constructs A or C (without fluorescent tag) after non-permeabilized immunostaining with an anti-Myc antibody. When Component II was expressed as a cytosolic protein, we also monitored light-inducible cytosol-to- PM translocation to confirm the photo-responsiveness of the optical dimerizer. Scale bar, 5 μm. b-d, Confocal images of HeLa cells expressing the indicated components before and after light illumination. The introduction of ER trafficking/export signals in Component I significantly improved PM targeting; whereas the addition of NES to Component II substantially reduced nuclear accumulation (b/c vs d). Four images for each combination were taken. Scale bar, 5 μm. e-f, Confocal images of HeLa cells co-expressing constructs A+B3 or C+D4. Note that B3 and D4 contained the CD8 transmembrane domain (TM) and were thus embedded in the plasma membrane. Four images for each combination were taken. Scale bar, 5 μm.
Extended Data Fig. 2
Extended Data Fig. 2. Early T cell activation reported by cell surface expression of CD69
a, Quantification of the CD69 expression level in Jurkat T cells expressing WT CAR, defective LiCAR (C+D5 lacking the CD3 subunit), or LiCAR (C+D4) before (open box) and after light illumination (blue box; 20 min and then 10 h with the pulse of 10 s ON + 60 s OFF). Cells were co-incubated with hCD19- negative K562 cells (open box) or hCD19-positive Raji cells (red box). b, Quantification of CD69 expression in Jurkat T cells co-cultured with hCD19-negative K562 (open box) or hCD19-positive Raji cells (red box). n = 2 independent biological replicates (mean ± range).
Extended Data Fig. 3
Extended Data Fig. 3. Expression of engineered CARs in human primary CD8+ T cells
a, Evaluation of the purity of CD8+ T cells isolated from PBMCs of healthy donors. Isolated T cells were stained with anti-CD8-APC. Non-stained CD8+ T cells were used as negative control to aid the gating of cell populations. b, Quantification of WT CAR (GFP-tagged), LiCAR (C-GFP + D4-mCh) or defective LiCAR (C-GFP + D5-mCh) expression in human CD8+ T cells. GFP-positive (for the WT CAR group) or double positive cells (for the LiCAR and the defective LiCAR groups) were used for functional assays. c, Confocal images of human CD8+ T-cells transduced with WT CAR (green, top panel) or the indicated CAR components (C-GFP, green; or D4/D5-mCherry, red; middle and bottom panels). Three images per group were taken. Scale bar, 10 μm. d, Time-lapse imaging of tumor cells (Daudi) co-cultured with human CD8+ T cells (asterisk) expressing either WT CAR (GFP-tagged, top) in the dark or defective LiCAR (C-GFP+D5-mCh, bottom) exposed to blue light. Dying cells were indicated by SYTOX blue staining. Scale bar, 5 μm. Also see Supplementary Videos 3-4.
Extended Data Fig. 4
Extended Data Fig. 4. Optimization and characterization of synthesized UCNPs
a, Comparison of the the core/shell structures of synthesized UCNPs (top, β-NaYF4:30% Yb, 0.5% Tm@NaYF4; bottom, β-NaYbF4:0.5%Tm@NaYF4) and TEM images (right). Scale bar, 100 nm. b, TEM images and the size distribution (height denoted as “H” and diameter denoted as “D”) of the NaYbF4:0.5%Tm core nanoparticles (left), NaYbF4:0.5%Tm@NaYF4 core-shell nanoplates (middle), and silica-coated NaYbF4:0.5%Tm@NaYF4 core-shell nanoplates (right). c, Comparison of the upconversion luminescence spectra of synthesized UCNPs upon NIR light illumination at 980 nm (black, β-NaYF4:30%Yb,0.5%Tm@NaYF4; red, β- NaYbF4:0.5%Tm@NaYF4 nanoplates). Their luminescence intensities were compared at the same condition with the same amounts of total lanthanide ions. d, Blue light emitting from the leftmost cuvette containing UCNPs (β-NaYbF4:0.5%Tm@NaYF4) upon NIR illumination. The UCNP-containing cuvette (leftmost) was placed next to the indicated numbers of H2O-containing plastic cuvettes (labeled as 1, 2 and 3; top) or a cuvette containing dark ink (bottom). The NIR light source (980 nm) was placed on the right. Pictures were taken in a dark room except for the leftmost images. The light intensity was strong enough to illuminate the background after penetrating through cuvettes. e, UCNPs emitted bright blue light locally at the injection site in vivo upon NIR light stimulation (980 nm; 250 mW/cm2). Pictures were taken for the same mouse in the bright field without (left) or with NIR light (middle), or in the dark field with NIR light (right).
Extended Data Fig. 5
Extended Data Fig. 5. Effects of WT CAR T-cells and UCNPs on tumor growth
a, WT CAR-expressing CD8+ T-cells selectively destroy CD19-positive melanoma tumors without light stimulation. Left, C57BL/6J mice were intradermally inoculated with 2.5x10⁵ B16-OVA-hCD19 cells in the left flank (red circle) and 2.5x10⁵ B16-OVA cells (CD19-negative tumor as control; blue circle) in the right flank. Two representative mice are shown after treatment with WT CAR T-cells + UCNPs for 8 days. Middle, Tumor sizes at the indicated time points were measured by a digital caliper with the tumor areas calculated in mm2 (length x width). n = 4 biologically independent mice (mean ± s.e.m.). P values were calculated using two-sided unpaired Student’s t-tests. Right, isolated B16-OVA and B16-OVA-hCD19 tumors at day 18. b, The growth curves of B16-OVA-CD19/UCNPs and B16-OVA/UCNPs upon NIR light irradiation. Left, C57BL/6J mice were intradermally inoculated with 2.5x10⁵ B16-OVA-hCD19 cells in the left flank (red circle) and 2.5x10⁵ B16-OVA cells (CD19-negative tumor as control; blue circle) in the right flank. Two representative mice are shown after injection of UCNPs for 8 days without CAR T-cells under NIR treatment. Middle, Tumor sizes at the indicated time points were measured by a digital caliper with the tumor areas calculated in mm2 (length x width). No significant difference in tumor size were observed. P = 0.93 when compared to the B16-OVA group at day 16 (unpaired two-sided Student’s t-test; n = 3 biologically independent mice; mean ± s.e.m.). Right, isolated B16-OVA and B16-OVA-hCD19 tumors at day 16. c, UCNPs did not affect tumor growth. C57BL/6J mice were intradermally inoculated with 2.5x10⁵ B16-OVA cells to each flank. Four representative mice were shown after injection with UCNPs to the right flank tumor. Top right, isolated B16-OVA and B16-OVA-UCNPs tumors before and after UCNP removals at day 18. Bottom left and middle, tumor sizes before tumor surgery (measured from outside the skin) and after UCNP removal, respectively, at day 18 were measured by a digital caliper with the tumor areas calculated in mm2
Extended Data Fig. 6
Extended Data Fig. 6. Light-inducible selective killing of CD19+ solid tumors in vivo using LiCAR-expressing T cells
a, CD8+ LiCAR T-cells selectively destroy CD19-expressing melanoma in response to NIR light illumination. Left, C57BL/6J mice were intradermally inoculated with 2.5x10⁵ B16-OVA-hCD19 cells in the left flank and 2.5x10⁵ B16-OVA cells (CD19-negative tumor as control) in the right flank. Two representative mice with opened tumor areas are shown after treatment with LiCAR T-cells + UCNPs and exposure to NIR pulses for 9 days. Right, isolated B16-OVA/UCNPs and B16-OVA-hCD19/UCNPs tumors at day 19. Green arrow, tumor cells. Blue arrow, UCNPs injected to tumor sites. The tumor masses after UCNP removal were shown in Fig. 3g. b, LiCAR T-cells permit NIR light-inducible killing of B16-OVA-hCD19 melanoma in selected regions. Left, C57BL/6J mice were intradermally inoculated at both flanks with 3x10⁵ B16-OVA-hCD19 cells. After injection with the LiCAR T-cells + UCNP mixture, the left flank was exposed to NIR pulses for 8 days, while the right side was protected from NIR light using aluminum foil. Two representative mice with opened tumors are shown at day 18. Right, isolated B16-OVA-hCD19/UCNPs tumors with and without NIR at day 18. Green arrow, tumor cells. Blue arrow, UCNPs injected to tumor sites. The tumor masses after UCNP removal were shown in Fig. 3h.
Extended Data Fig. 7
Extended Data Fig. 7. UCNPs are well confined within the injection site
a, Visualizing UCNPs after s.c. injection into the tumor sites under the indicated conditions. Images were acquired in the same mouse under three conditions: bright field without NIR light (left), bright field with NIR light illumination (middle) at the injection site (red arrow), or in the dark room with NIR light (right). Top, in situ images; middle, the UCNP-containing skin tissues were surgically exposed; bottom, after surgical removal. The NIR excitation showed a pink color in the camera if blue emission was not detected. Zoomed-in view on the right (orange box): The UCNP-containing skin/tumor tissues (top) and well-confined UCNPs isolated from the tissue (bottom). b, UCNPs did not spread to other major organs within the experimental window. Major organs were isolated from the mouse shown in panel a and then subjected to NIR light illumination. Only pink color was noted without blue emission, suggesting the absence of UCNPs in these tissues.
Extended Data Fig. 8
Extended Data Fig. 8. Blue light did not induce statistically significant changes in tumor killing
a, Cartoon illustrating the experimental setup. C57BL/6J mice were intradermally inoculated in the left flank with 3x10⁵ B16-OVA-hCD19 cells. After injection with the LiCAR T-cells + UCNP mixture, mice were either exposed to blue light (470 nm; 40 mW/cm2, 2 hours per day) for 8 days, or kept in the dark. b, Three representative mice from each group. The lower panel showed mice with opened tumors at day 18. Green arrow, tumor injection sites. Blue arrow, UCNPs in the tumor sites. c, Measurements of tumor sizes at the indicated time points by a digital caliper. Tumor areas were calculated in mm2 (length x width). n = 4 (dark group), n = 3 (light group) biologically independent mice (mean ± s.e.m.). P values were calculated using two-sided unpaired Student’s t-tests. P = 0.25 when compared to the dark group at day 18. d, Representative images of isolated B16-OVA-hCD19 tumors (shown in panel b) with and without blue light at day 18.
Extended Data Fig. 9
Extended Data Fig. 9. Biotinylated LiCAR T-cells remain fully functional and can be coupled with UCNPs that are surface coated with streptavidin (Stv-UCNPs)
a, Schematic illustration of surface biotinylation of engineered CAR T-cells and coupling with our previously-described UCNPs coated with streptavidin (Stv). b, Flow cytometry analysis of biotinylation efficiency of Jurkat T cells expressing WT CAR and LiCAR. Engineered T cells were biotinylated with a high efficiency of over 98%. c, Biotinylation did not affect engineered CAR T-cell activation. Quantification of NFAT-dependent luciferase (NFAT-Luc) reporter activity in engineered Jurkat T cells. LiCAR-transduced T cells engaged tumor cells bearing cognate antigen (hCD19+ Raji cells) under dark (open box) or lit conditions (blue box). Blue light (40 mW/cm2 at 470 nm) was applied for 20 min and then in pulsed cycles of 30 sec ON + 100 sec OFF for 8 h. n = 5 independent biological replicates (mean ± s.e.m.). P values were calculated using two-sided unpaired Student’s t-tests.
Extended Data Fig. 10
Extended Data Fig. 10. Intraperitoneal injection of mLiCAR T-cells to reduce “on-target off-tumor” side effects in a syngeneic mouse model of melanoma
a, Schematic illustration of the mouse model used to evaluate “on-target off-tumor” effects by intraperitoneal (i.p.) injection of B16-OVA-mCD19 tumor cells (3x10⁶). After tumor growth for 3 weeks, WT CAR T cells/UCNPs or LiCAR-T/UCNPs cells that could engage mCD19-B16-OVA cells were subsequently injected into the tumor sites. LiCAR (combination of C + D4.1) T-cells treated mice were subjected to pulsed NIR light stimulation for 3 days (980 nm at a power density of 250 mW/cm2; pulses of 20 sec ON, 5 minutes OFF; 2 h/day). On day 0 and day 3, blood was collected from the retro-orbital sinus by glass capillary from anesthetized mice for B cell quantification. b, On-target off-tumor effects of mWT CAR and mLiCAR T-cells evaluated by the degree of B cell aplasia. Peripheral blood B cells from the WT mCAR or mLiCAR T-cell treated groups were counted and compared on day 0 and day 3. B cells from peripheral blood of healthy mice were used as control. n = 7 biologically independent mice (mean ± s.e.m.). P values were calculated using two-sided unpaired Student’s t-tests.
Figure 1 ∣
Figure 1 ∣. Design of light-inducible split CAR (LiCAR) T-cells.
a, Design of photoactivatable CARs that are dually gated by tumor antigen (CD19) and light. Engineered CAR T-cells can only be switched on in the presence of light when engaged with cognate tumor cells. b, Optimized constructs used in the study (see Extended Data Fig. 1 for the full list). Modular domains within a typical CAR were split into two polypeptides (constructs A+B or C+D), the functional assembly of which can only be achieved upon light-induced interaction using two optical dimerizers (CRY2 + CIBN or LOV2-ssrA + sspB [or iLID]). Weaker versions of iLID (mutations R73Q or A58V in sspB; constructs D4.1-4.4) were used to reduce the degrees of LiCAR T-cell pre-activation. T cell activation was assessed using two independent assays: (i) NFAT-dependent luciferase (NFAT-Luc) reporter gene expression; and (ii) IL-2 production upon incubation with cognate antigen-bearing tumor cells (CD19+ Raji or Daudi lymphoma cells). The degree of activation was indicated by the darkness of the box on the right. c-h, Representative confocal images (four images per each combination were taken), showing reversible recruitment of cytosolic Construct B or D (mCherry-tagged; magenta) toward the PM-resident Construct A (GFP-tagged; green; c) or Construct C (d-e) in response to two dark-light cycles (40 mW/cm2; 470 nm) in Hela cells. (f-h) The activation and deactivation kinetics were indicated. n = 4 biologically independent cells (panel f); n = 36 biologically independent cells (panel g); n= 11 biologically independent cells (panel h; mean ± s.e.m.). Scale bar, 5 μm. Also see Supplementary Videos 1-2. i, Quantification of NFAT-dependent luciferase (NFAT-Luc) reporter activity in Jurkat T cells expressing WT CAR, LiCAR, or defective LiCAR. Engineered T cells were co-cultured with tumor cells without (open box; human CD19-negative K562 cells) or with the CD19 antigen (red box; hCD19+ Raji cells) under dark (open box) or lit conditions (blue box). Blue light (40 mW/cm2 at 470 nm) was applied for 20 min and then in pulsed cycles of 30 sec ON + 100 sec OFF for 8 h. Defective LiCAR lacking the CD3ζ-ITAM domain was used as negative control. n = 3 independent biological replicates (mean ± s.e.m.). P values were calculated using two-sided unpaired Student’s t-tests.
Figure 2 ∣
Figure 2 ∣. Photo-tunable immune response enabled by LiCAR T-cells.
a, Human Jurkat T cells were virally transduced to express WT CAR, LiCAR, or defective LiCAR, followed by functional assays to determine their therapeutic responses. b-c, Light-tunable responses of engineered CAR T-cells examined by (b) photo-inducible NFAT-dependent luciferase reporter activity and (c) IL-2 production in Jurkat T cells. ON time of constant photostimulation was indicated. n = 3 independent biological replicates (mean ± s.e.m.). P values were calculated using two-sided unpaired Student’s t-tests. d-e, Determination of early T cell activation as reflected by upregulated CD69 expression on cell surface. Jurkat T cells transduced with conventional CAR, defective LiCAR, and LiCAR were engaged with hCD19+ Daudi or hCD19 K562 cells under dark or lit conditions. n = 3 independent biological replicates (mean ± s.e.m.). P values were calculated using two-sided unpaired Student’s t-tests. f, Primary human CD8+ T cells isolated from the peripheral blood of healthy donors were transduced to express WT CAR, LiCAR, or defective LiCAR, followed by functional assays (SYTOX Blue dead cell staining) to determine the tumor cell killing efficacy. The tumor killing results, quantified by SYTOX staining, were shown in the bar graph below the cartoon. n = 2 independent biological replicates. g-h, Light-induced tumor cell killing assessed by flow cytometry (g) and time-lapse confocal imaging (h). Transduced human CD8+ T cells were engaged with hCD19 K562 or hCD19+ Daudi lymphoma cells and kept in the dark or exposed to blue light. SYTOX blue was used to stain dying tumor cells with compromised plasma membranes. Shown in panel h are overlaid images of LiCAR-expressing human CD8+ T cells (green, C-GFP; red, D4-mCherry) engaged with Daudi cells (indicated by numbers; also see Supplementary Videos 3-6). Red arrowheads, dying Daudi cells with positive SYTOX blue staining. Cells were either kept in the dark or exposed to blue light (470 nm; 40 mW/cm2; 5 h). Scale bar, 5 μm.
Figure 3 ∣
Figure 3 ∣. A nano-optogenetic strategy for precise destruction of melanoma using LiCAR T-cells.
a, Quantification of IFN-γ produced by engineered mouse CD8+ T cells expressing LiCAR or defective LiCAR after co-culturing with melanoma cells (B16-OVA cells expressing human CD19 [B16-OVA-hCD19] or B16-OVA [as control]) at different effector: target (E:T) ratios. n = 3 independent biological replicates (mean ± s.e.m.). P values were calculated using two-sided unpaired Student’s t-tests. b, B16-OVA-hCD19 cell killing efficacy of mouse CD8+ T cells expressing WT CAR, LiCAR, or defective LiCAR at the indicated effector: target (E:T) ratios. n = 4 independent biological replicates (mean ± s.e.m.). P values were calculated using two-sided unpaired Student’s t-tests. c, Schematic of the core/shell structure of silica-coated upconversion nanoplates (UCNPs; βNaYbF4: 0.5%Tm@NaYF4). d, Size measurement of silica coated β-NaYbF4:0.5%Tm@NaYF4 core-shell UCNPs by dynamic light scattering. The inset shows a representative transmission electron micrograph. Scale bar, 100 nm. e, The upconversion luminescence spectrum of synthesized UCNPs upon NIR light stimulation at 980 nm. f, Schematic of the in vivo experimental setup. 2x10⁶ mouse CD8+ T cells expressing LiCAR and 150 μg of UCNPs were adoptively transferred into each tumor site of C57BL/6J mice 9 days after melanoma inoculation (B16-OVA or B16-OVA-hCD19). Mice were subjected to pulsed NIR light stimulation for 8-9 days (980 nm at a power density of 250 mW/cm2; pulse of 20 sec ON, 5 minutes OFF; 2 h/day). At day 18 or 19, mice were euthanized for tumor isolation and phenotypic analyses. g, LiCAR CD8+ T-cells selectively destruct CD19-expressing melanoma in response to NIR light illumination. Left, C57BL/6J mice were intradermally inoculated with 2.5x10⁵ B16-OVA-hCD19 in the left flank (red circle) and 2.5x10⁵ B16-OVA cells (CD19-negative tumor as control; blue circle) in the right flank. Two representative mice are shown after treatment with 2x10⁶ LiCAR T-cells + 150 μg UCNPs and exposed to NIR pulses for 9 days. Middle, tumor sizes at the indicated time points were measured by a digital caliper with the tumor areas calculated in mm2 (length x width). n = 5 biologically independent mice (mean ± s.e.m.). P values were calculated using two-sided unpaired Student’s t-tests. Right, isolated B16-OVA and B16-OVA-hCD19 tumors at day 19. Also see Extended Data Figure 6a. h, LiCAR T-cells permit NIR light-inducible killing of B16-OVA-hCD19 melanoma in selected regions. Left, C57BL/6J mice were intradermally inoculated at both flanks with 3x10⁵ B16-OVA-hCD19 cells. After injection with the 2x10⁶ LiCAR T-cells + 150 μg UCNP mixture, the left flank (red circle) was exposed to NIR pulses for 8 days, while the right side (blue circle) was protected from NIR light using aluminum foil. Two representative mice are shown at day 18. Middle, tumor sizes measured at the indicated time points. Right, isolated B16-OVA-hCD19 tumors with and without exposure to NIR light at day 18. n = 5 biologically independent mice (mean ± s.e.m.). P values were calculated using two-sided unpaired Student’s t-tests. Note that more melanoma cells were injected so that we could collect sufficient tumor masses (without clearance as seen in panel h) for FACS analysis. Also see Extended Data Figure 6b.
Figure 4 ∣
Figure 4 ∣. Systemic injection of LiCAR T-cells with UCNPs for NIR light-inducible lymphoma killing.
a, Schematic of the experimental setup for systemic injection of engineered CAR T-cells. 1.5x10⁵ Raji cells were subcutaneously (s.c.) inoculated to both flanks of SCID-Beige mice. After 6 days, 150 μg of UCNPs or PBS (control) were intratumorally (i.t.) injected into each tumor. Subsequently, 1 x 10⁷ LiCAR-hCD8+ T cells were systematically injected via tail vein injection (i.v.) at the indicated time points. Mice were subjected to pulsed NIR light stimulation for 13 days (980 nm at a power density of 250 mW/cm2; 20 sec ON + 5 minutes OFF; 2 h/day). At day 20, mice were euthanized for tumor isolation and phenotypic analyses. b, LiCAR T-cells (i.v.) coupled with UCNPs (i.t.) enable NIR light-inducible suppression of Raji lymphoma. Left, representative images of isolated lymphoma tumors with and without exposure to NIR light from the mice treated with either LiCAR + UCNPs or LiCAR only at day 20. Right, quantification of the tumor weight at the endpoint. n = 7 biologically independent mice (mean ± s.e.m.). P values were calculated using two-sided unpaired Student’s t-tests. c, Schematic of the experimental setup. 1.5x10⁵ Raji cells were inoculated to each flank of SCID-Beige mice. After 7 days, the mice were intravenously treated with 1 x 10⁷ streptavidin-UCNP-coupled LiCAR-hCD8+ T-cells (Stv-UCNP-LiCAR) at the indicated time points. Mice were subjected to pulsed NIR light stimulation from day 7 to day 21 as mentioned above. On day 21, mice were euthanized for tumor isolation and phenotypic analyses. d, Stv-UCNP-LiCAR T-cells selectively suppress Raji lymphoma with NIR light stimulation. Left, SCID-beige mice were intradermally inoculated at both flanks with 1.5x10⁵ Raji cells in the form of Matrigel mixture, with the left flank shielded and the right flank exposed to pulsed NIR light illumination. Middle, two representative mice from each group were shown at day 21. Right, images of isolated lymphoma tumors with and without exposure to NIR light from xenograft mice treated with either UCNPs-conjugated LiCAR or LiCAR only at day 21. e, Quantification of the tumor weight at the endpoint. n = 7 biologically independent mice (mean ± s.e.m.). P values were calculated using two-sided unpaired Student’s t-tests. f, Tumor growth curves for the indicated groups. Tumor sizes at the indicated time points were measured by a digital caliper with the tumor areas calculated in mm2 (length x width). n = 7 biologically independent mice (mean ± s.e.m.). P values were calculated using two-sided unpaired Student’s t-tests.
Figure 5 ∣
Figure 5 ∣. mLiCAR T-cells reduce “on-target off-tumor” effects in a syngeneic mouse model of melanoma.
a, Design of constructs to recognize mouse CD19 (mCD19) antigen overexpressed in B16 murine melanoma cells. The mCD19-recognizing scFv in WT mCAR or mLiCAR was derived a mouse mAb (clone 1D3). b, The engagement of 1D3 scFv to mCD19 antigen was quantified by NFAT-dependent luciferase (NFAT-Luc) reporter activity in Jurkat T cells. Jurkat T cells transduced with human CD19 (hCD19)-recognizing (WT hCAR) or mouse mCD19 antigen-recognizing constructs (WT mCAR, mLiCAR, or defective mLiCAR) were engaged with the corresponding tumor cells bearing noncognate (open box; B16-OVA cells) or the cognate antigens (B16-OVA-hCD19 for hCAR or B16-OVA-mCD19 for mCAR, mLiCAR, or defective mLiCAR groups) under dark (open box) or lit conditions (blue box). Blue light (40 mW/cm2 at 470 nm) was applied for 20 min and then in pulsed cycles of 30 sec ON + 100 sec OFF for 8 h. n = 4 biologically independent mice (mean ± s.e.m.). P values were calculated using two-sided unpaired Student’s t-tests. c-d, WT mCAR- (c) or mLiCAR-expressing (d) murine CD8+ T-cells selectively destroy mCD19-expressing melanoma cells in vivo. mLiCAR T-cells exhibit NIR-light dependent killing of B16-OVA-mCD19 tumor cells. Left, C57BL/6J mice were intradermally inoculated with 2.5x10⁵ B16-OVA cells in the left flank (as control without mCD19 overexpression, blue circle) and 2.5x10⁵ B16-OVA-mCD19 cells (red circle) in the right flank. Mice were treated with WT mCAR T-cells + 150 μg UCNPs for 10 days (panel c), or 2x10⁶ mLiCAR T-cells + 150 μg UCNPs with subsequent exposure to NIR pulses for 10 days (panel d). Middle, Quantification of the tumor sizes. Tumor sizes at the endpoint after UCNP removal were measured by a digital caliper with the tumor areas calculated in mm2 (length x width). n = 4 biologically independent mice for panel c and n = 3 biologically independent mice for panel d (mean ± s.e.m.). P values were calculated using two-sided unpaired Student’s t-tests. Right, Representative images of isolated B16-OVA and B16-OVA-mCD19 tumors with UCNPs at day 19. e, On-target off-tumor effects of mWT CAR and mLiCAR T-cells evaluated by the degree of B cell aplasia. Peripheral blood B cells from the WT mCAR or mLiCAR T-cell treated groups (as in panels c-d) inoculated with tumor cells were counted and compared on day 0 and day 3. B cells from peripheral blood of healthy mice were used as control. n = 4 biologically independent mice (mean ± s.e.m.). P values were calculated using two-sided unpaired Student’s t-tests. f, Representative H&E staining images of major organs isolated from mLiCAR T-cells/UCNP/NIR treated mice bearing tumors or healthy mice subcutaneously administered with 100 μl PBS. The experiments were independently repeated four times. Scale bar, 100 μm.
Figure 6 ∣
Figure 6 ∣. LiCAR T-cells mitigate cytokine release syndrome (CRS).
a, Schematic of the CRS experimental setup. Raji tumor cells (3x10⁶) were injected (i.p.) into SCID-beige mice. After tumor growth for 3 weeks, WT CAR T cells/UCNPs or LiCAR T/UCNPs cells that could engage hCD19-expressing Raji cells were subsequently implanted to the tumor cell-injection sites. LiCAR (combination of C + D4.1)-treated mice were subjected to pulsed NIR light stimulation for 3 days (980 nm at a power density of 250 mW/cm2 pulses of 20 sec ON, 5 minutes OFF; 2 h/day). Weight change was monitored daily. On day 0 (pre-CAR) and day 3, blood/serum was collected from the retro-orbital sinus by glass capillary from anesthetized mice. b, Weight change of WT CAR T-cells/UCNPs or LiCAR T-cells/UCNPs/NIR-treated mice bearing Raji tumors. Weight of each mouse was normalized to the starting point before CAR T-cell implantation. n = 3 biologically independent mice (mean ± s.e.m.). P values were calculated using two-sided unpaired Student’s t-tests. c, ELISA measurements of the serum levels of mIL-6 at 72h after WT CAR T-cells/UCNPs or LiCAR T-cells/UCNPs/NIR treatment or before CAR T cell injection (Pre-CAR) into the SCID-beige mice. n = 3 independent biological replicates. (mean ± s.e.m.). P values were calculated using one-way ANOVA multiple comparisons.

References

    1. June CH, O'Connor RS, Kawalekar OU, Ghassemi S & Milone MC CAR T cell immunotherapy for human cancer. Science 359, 1361–1365, doi:10.1126/science.aar6711 (2018). - DOI - PubMed
    1. Chmielewski M, Hombach AA & Abken H Antigen-Specific T-Cell Activation Independently of the MHC: Chimeric Antigen Receptor-Redirected T Cells. Front Immunol 4, 371, doi:10.3389/fimmu.2013.00371 (2013). - DOI - PMC - PubMed
    1. Grupp SA et al. Chimeric antigen receptor-modified T cells for acute lymphoid leukemia. N Engl J Med 368, 1509–1518, doi:10.1056/NEJMoa1215134 (2013). - DOI - PMC - PubMed
    1. Maude SL et al. Tisagenlecleucel in Children and Young Adults with B-Cell Lymphoblastic Leukemia. N Engl J Med 378, 439–448, doi:10.1056/NEJMoa1709866 (2018). - DOI - PMC - PubMed
    1. Sadelain M, Brentjens R & Riviere I The basic principles of chimeric antigen receptor design. Cancer Discov 3, 388–398, doi:10.1158/2159-8290.CD-12-0548 (2013). - DOI - PMC - PubMed

Publication types

Substances