. 2021 Oct 15:2021:8274936.
doi: 10.1155/2021/8274936. eCollection 2021.

Hyperosmotic Stress Induces a Specific Pattern for Stress Granule Formation in Human-Induced Pluripotent Stem Cells

Affiliations

Hyperosmotic Stress Induces a Specific Pattern for Stress Granule Formation in Human-Induced Pluripotent Stem Cells

Salam Salloum-Asfar et al. Stem Cells Int. .

Abstract

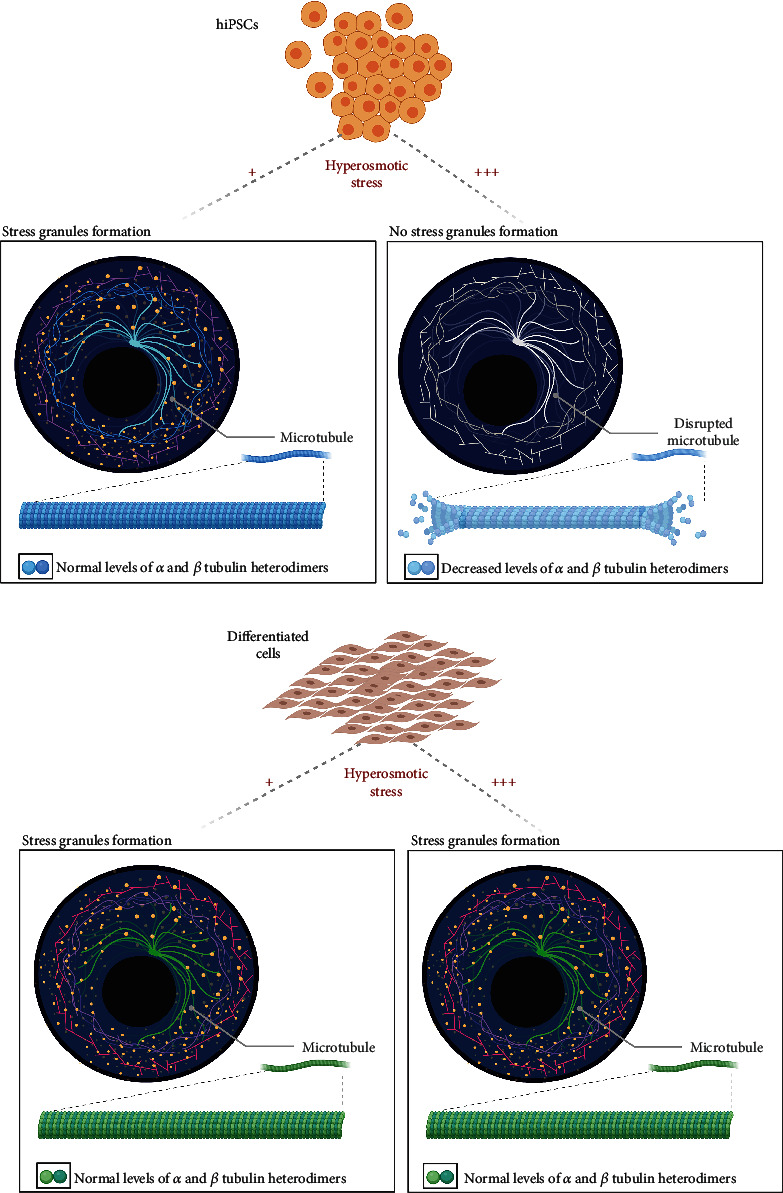
Stress granules (SGs) are assemblies of selective messenger RNAs (mRNAs), translation factors, and RNA-binding proteins in small untranslated messenger ribonucleoprotein (mRNP) complexes in the cytoplasm. Evidence indicates that different types of cells have shown different mechanisms to respond to stress and the formation of SGs. In the present work, we investigated how human-induced pluripotent stem cells (hiPSCs/IMR90-1) overcome hyperosmotic stress compared to a cell line that does not harbor pluripotent characteristics (SH-SY5Y cell line). Gradient concentrations of NaCl showed a different pattern of SG formation between hiPSCs/IMR90-1 and the nonpluripotent cell line SH-SY5Y. Other pluripotent stem cell lines (hiPSCs/CRTD5 and hESCs/H9 (human embryonic stem cell line)) as well as nonpluripotent cell lines (BHK-21 and MCF-7) were used to confirm this phenomenon. Moreover, the formation of hyperosmotic SGs in hiPSCs/IMR90-1 was independent of eIF2α phosphorylation and was associated with low apoptosis levels. In addition, a comprehensive proteomics analysis was performed to identify proteins involved in regulating this specific pattern of hyperosmotic SG formation in hiPSCs/IMR90-1. We found possible implications of microtubule organization on the response to hyperosmotic stress in hiPSCs/IMR90-1. We have also unveiled a reduced expression of tubulin that may protect cells against hyperosmolarity stress while inhibiting SG formation without affecting stem cell self-renewal and pluripotency. Our observations may provide a possible cellular mechanism to better understand SG dynamics in pluripotent stem cells.


Conflict of interest statement

The authors declare that they have no conflicts of interest with the contents of this article.

Figures

Figure 1
Figure 1
SG assembly in hiPSCs/IMR90-1 and SH-SY5Y under hyperosmolarity stress. (a) Representative fluorescence microscopy images showing nontreated hiPSCs/IMR90-1 and SH-SY5Y cells treated with 50, 100, 200, 300, and 400 mM of sodium chloride stained with the robust SG marker (G3BP (green)). LIN28 is an RNA-binding protein involved in promoting pluripotency. Nucleus is stained in blue (Hoechst). Insets show magnified views of SGs. White arrows indicate SGs. Scale bar indicates 20 μm. (b) Percentage of hiPSCs/IMR90-1 with G3BP-positive SGs after 1 h treatment with the indicated concentrations of sodium chloride (50, 100, 200, 300, and 400 mM). The average percentage of cells with SGs is shown. Error bars indicate the ±standard deviation from 3 independent experiments. Approximately, 1000 cells were counted (distributed over 20 different fields within each coverslip).
Figure 2
Figure 2
Time-course experiments to ensure that SG assembly in hiPSCs/IMR90-1 and SH-SY5Y is time independent. (a) Representative fluorescence microscopy images showing IMR90-1/hiPSCs and SH-SY5Y treated with 200 and 400 mM of sodium chloride stained with the robust SG marker (G3BP (green)). Nucleus is stained in blue (Hoechst). Insets show magnified views of SGs. White arrows indicate SGs. Scale bar indicates 20 μm. (b) Percentage of hiPSCs/IMR90-1 with G3BP-positive SGs during the time-course treatment with the indicated concentrations of sodium chloride (0, 200, and 400 mM). The average percentage of cells with SGs is shown. Error bars indicate the ±standard deviation from 3 independent experiments. Approximately, 1000 cells were counted (distributed over 20 different fields within each coverslip).
Figure 3
Figure 3
The flow cytometric (FACS) analysis diagram of NaCl for hiPSCs/IMR90-1 and SH-SY5Y. (a) Representative flow cytometric multicolor gating of cells used to analyze the number of live/dead cells and representative profiles of FACS analysis after 1-hour treatment with NaCl. Cells were collected after 1-hour treatment with different concentrations of NaCl, stained with Annexin V and PI, and analyzed by FACS. Cells without NaCl treatment were used as negative controls (n = 4 in each group). The diagram can be divided into four regions that are defined as follows: the percentage of necrotic cells (Q1; PI/FITC +/−), the percentage of late apoptotic cells (Q2; PI/FITC +/+), the percentage of viable cells (Q3; PI/FITC −/−), and the percentage of early apoptotic cells (Q4; PI/FITC −/+). (b) Percentages of viable, early, and late apoptosis are presented in the graphs for both types of cells. Results represent four independent experiments with similar results.
Figure 4
Figure 4
Clustering and functional overrepresentation analysis of differential proteomic data. (a) Fuzzy c-means clustering identifies distinct patterns in protein levels upon NaCl treatment in hiPSCs/IMR90-1 and SH-SY5Y cells. Clustering into 5 clusters was performed to standardized changes in protein levels when compared to untreated cells (p < 0.05). Profile plots of the clusters indicate the following general states: 1 and 2, strongly increased expression in 400 mM in hiPSCs/IMR90-1; 3, moderate increase expression in 400 mM in hiPSCs/IMR90-1; and 4 and 5, decreased expressions in 400 mM in hiPSCs/IMR90-1. (b) Heatmap showing Gene Ontology (GO) terms which are statistically overrepresented within clusters as indicated by a high −log10p value. (c) Selected subtype markers across selected cluster 3 in hiPSCs/IMR90-1 and SH-SY5Y. Selected subtype markers exhibit the subtype-expected pattern (for each pairwise comparison, we used Student t-test, FDR < 0.05). Microtubule proteins, TBCA, TUBB, STMN1, TUBA1B, TUBB4B, PKBP4, DYNC1H1, MAPRE1, and DPYSL2 were significantly lower in hiPSCs/IMR90-1 under 400 mM of NaCl treatment. NT: no treatment; ns: not significant compared to NT; FDR: adjusted p value less than 0.05 compared to NT; ∗∗FDR: adjusted p value less than 0.01 compared to NT.
Figure 5
Figure 5
IPA network in hiPSCs/IMR90-1 and SH-SY5Y cells. (a) The top scoring IPA protein network for hiPSCs/IMR90-1 is “cell-to-cell signaling and interaction, cellular assembly and organization” and (b) in SH-SY5Y is “cellular assembly and organization, cell-to-cell signaling and interaction, reproductive system development and function,” both are depicted under the 400 mM NaCl treatment condition. The shapes represent the molecular classes of the proteins. Red represents upregulation, green represents downregulation, and color intensity represents the relative magnitude of change in protein expression. Interactions are indicated by solid lines. The protein interaction networks were generated through the use of IPA software.
Figure 6
Figure 6
Downregulation of NaCl treatment alters tubulin expression and tubulin network of hiPSCs/IMR90-1. (a) Cells were treated with NaCl for 1 h and then lysed with RIPA buffer. The lysates were separated with SDS-PAGE, transferred onto PVDF membranes, and probed with anti-α-tubulin, anti-β-tubulin, and anti-β-actin antibodies. A representative immunoblot analysis in IMR90/iPSCs and SH-Y5Y cells is shown. (b) Intensity of each band of the immunoblot was measured by the NIH ImageJ program, and the ratios of tubulin and β-actin in each treatment was calculated. (c, d) Representative fluorescence microscopy images showing nontreated hiPSCs/IMR90-1 and SH-SY5Y, cells treated with 200 and 400 mM of sodium chloride stained with the robust SG marker (G3BP (green)), β-tubulin (c) and α-tubulin (d) (red), the largest of the cytoskeletal polymers forming microtubules. Nucleus is stained in blue (Hoechst). Insets show magnified views of SGs and microtubule filaments. Scale bar indicates 5 μm. ns: not significant compared to NT; ∗∗p value less than 0.01 compared to NT.
Figure 7
Figure 7
The summary figure of the study. This summarizes a cellular mechanism that controls the assembly and disassembly of SGs induced by hyperosmotic stress in hiPSCs/IMR90-1. Upon gradient concentrations of hyperosmolarity treatment, the effect of increased cell osmolarity differs from one type of cell to another. Under 200 mM of NaCl, hiPSCs/IMR90-1 and SH-SY5Y showed SG formation. However, with a higher concentration, 400 mM, SGs disappeared in hiPSCs/IMR90-1. Reduced expression of tubulin may protect cells against hyperosmolarity stress while inhibiting SG formation without affecting stem cell self-renewal and pluripotency. Possible implications of microtubule organization, dynamic structural cellular components, on the response to hypertonic stress in hiPSCs were found.

References

    1. Kedersha N. L., Gupta M., Li W., Miller I., Anderson P. RNA-binding proteins TIA-1 and TIAR link the phosphorylation of eIF-2α to the assembly of mammalian stress granules. The Journal of Cell Biology . 1999;147(7):1431–1442. doi: 10.1083/jcb.147.7.1431. - DOI - PMC - PubMed
    1. Anderson P., Kedersha N. Stressful initiations. Journal of Cell Science . 2002;115(16):3227–3234. doi: 10.1242/jcs.115.16.3227. - DOI - PubMed
    1. Kedersha N., Cho M. R., Li W., et al. Dynamic shuttling of TIA-1 accompanies the recruitment of mRNA to mammalian stress granules. The Journal of Cell Biology . 2000;151(6):1257–1268. doi: 10.1083/jcb.151.6.1257. - DOI - PMC - PubMed
    1. Raught B., Peiretti F., Gingras A. C., et al. Phosphorylation of eucaryotic translation initiation factor 4B Ser422 is modulated by S6 kinases. The EMBO Journal . 2004;23(8):1761–1769. doi: 10.1038/sj.emboj.7600193. - DOI - PMC - PubMed
    1. Slaine P. D., Kleer M., Smith N., Khaperskyy D., McCormick C. Stress granule-inducing eukaryotic translation initiation factor 4A inhibitors block influenza A virus replication. Viruses . 2017;9(12):p. 388. doi: 10.3390/v9120388. - DOI - PMC - PubMed

LinkOut - more resources