A high-resolution temporal and geospatial content analysis of Twitter posts related to the COVID-19 pandemic
- PMID: 34697602
- PMCID: PMC8528186
- DOI: 10.1007/s42001-021-00150-8
A high-resolution temporal and geospatial content analysis of Twitter posts related to the COVID-19 pandemic
Abstract
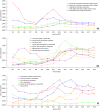
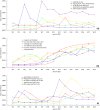
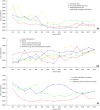
The COVID-19 pandemic has deeply impacted all aspects of social, professional, and financial life, with concerns and responses being readily published in online social media worldwide. This study employs probabilistic text mining techniques for a large-scale, high-resolution, temporal, and geospatial content analysis of Twitter related discussions. Analysis considered 20,230,833 English language original COVID-19-related tweets with global origin retrieved between January 25, 2020 and April 30, 2020. Fine grain topic analysis identified 91 meaningful topics. Most of the topics showed a temporal evolution with local maxima, underlining the short-lived character of discussions in Twitter. When compared to real-world events, temporal popularity curves showed a good correlation with and quick response to real-world triggers. Geospatial analysis of topics showed that approximately 30% of original English language tweets were contributed by USA-based users, while overall more than 60% of the English language tweets were contributed by users from countries with an official language other than English. High-resolution temporal and geospatial analysis of Twitter content shows potential for political, economic, and social monitoring on a global and national level.
Keywords: COVID-19; Geospatial analysis; Latent Dirichlet Allocation; Social media analysis; Topic modeling; Twitter.
© The Author(s), under exclusive licence to Springer Nature Singapore Pte Ltd. 2021.
Conflict of interest statement
Conflict of interestThe authors declare that they have no conflict of interest.
Figures


Similar articles
-
Top Concerns of Tweeters During the COVID-19 Pandemic: Infoveillance Study.J Med Internet Res. 2020 Apr 21;22(4):e19016. doi: 10.2196/19016. J Med Internet Res. 2020. PMID: 32287039 Free PMC article.
-
Topics, Trends, and Sentiments of Tweets About the COVID-19 Pandemic: Temporal Infoveillance Study.J Med Internet Res. 2020 Oct 23;22(10):e22624. doi: 10.2196/22624. J Med Internet Res. 2020. PMID: 33006937 Free PMC article.
-
Detection of Hate Speech in COVID-19-Related Tweets in the Arab Region: Deep Learning and Topic Modeling Approach.J Med Internet Res. 2020 Dec 8;22(12):e22609. doi: 10.2196/22609. J Med Internet Res. 2020. PMID: 33207310 Free PMC article.
-
The State of Mind of Health Care Professionals in Light of the COVID-19 Pandemic: Text Analysis Study of Twitter Discourses.J Med Internet Res. 2021 Oct 22;23(10):e30217. doi: 10.2196/30217. J Med Internet Res. 2021. PMID: 34550899 Free PMC article.
-
Public Perception of the COVID-19 Pandemic on Twitter: Sentiment Analysis and Topic Modeling Study.JMIR Public Health Surveill. 2020 Nov 11;6(4):e21978. doi: 10.2196/21978. JMIR Public Health Surveill. 2020. PMID: 33108310 Free PMC article.
Cited by
-
Analysis of Pharmaceutical Companies' Social Media Activity during the COVID-19 Pandemic and Its Impact on the Public.Behav Sci (Basel). 2024 Feb 9;14(2):128. doi: 10.3390/bs14020128. Behav Sci (Basel). 2024. PMID: 38392481 Free PMC article.
-
Machine Learning-based Analysis of Publications Funded by the National Institutes of Health's Initial COVID-19 Pandemic Response.Open Forum Infect Dis. 2024 Apr 24;11(4):ofae156. doi: 10.1093/ofid/ofae156. eCollection 2024 Apr. Open Forum Infect Dis. 2024. PMID: 38659624 Free PMC article.
-
Temporal Variations and Spatial Disparities in Public Sentiment Toward COVID-19 and Preventive Practices in the United States: Infodemiology Study of Tweets.JMIR Infodemiology. 2021 Dec 30;1(1):e31671. doi: 10.2196/31671. eCollection 2021 Jan-Dec. JMIR Infodemiology. 2021. PMID: 35013722 Free PMC article.
-
Efficient and Reliable Geocoding of German Twitter Data to Enable Spatial Data Linkage to Official Statistics and Other Data Sources.Front Sociol. 2022 Jun 9;7:910111. doi: 10.3389/fsoc.2022.910111. eCollection 2022. Front Sociol. 2022. PMID: 35755485 Free PMC article.
-
Enhanced sentiment analysis regarding COVID-19 news from global channels.J Comput Soc Sci. 2023;6(1):19-57. doi: 10.1007/s42001-022-00189-1. Epub 2022 Nov 27. J Comput Soc Sci. 2023. PMID: 36465148 Free PMC article.
References
-
- Iqbal, M. (2020). Twitter revenue and usage statistics (2020). Business of Apps. Retrieved January 5, 2021, from https://www.businessofapps.com/data/twitter-statistics/
LinkOut - more resources
Full Text Sources
Miscellaneous
