. 2021 Oct 21;1(7):100093.
doi: 10.1016/j.crmeth.2021.100093. eCollection 2021 Nov 22.

Unlocking SARS-CoV-2 detection in low- and middle-income countries

Affiliations

Unlocking SARS-CoV-2 detection in low- and middle-income countries

Roberto Alcántara et al. Cell Rep Methods. .

Abstract

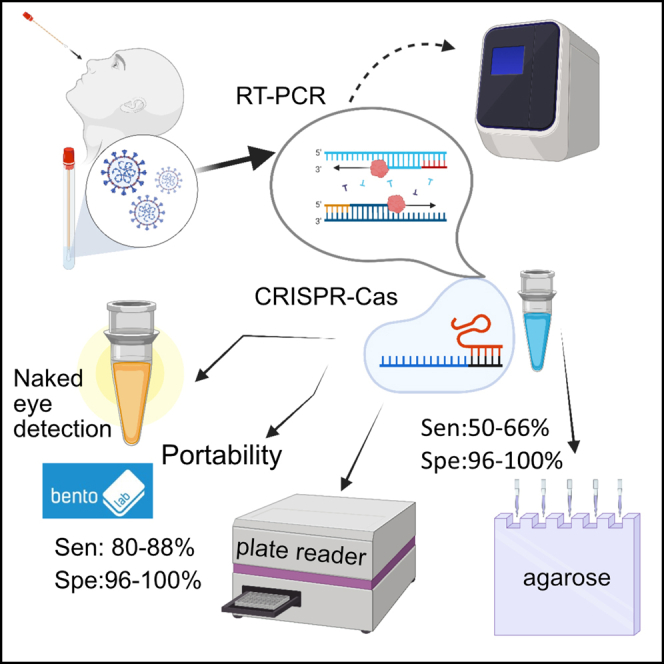
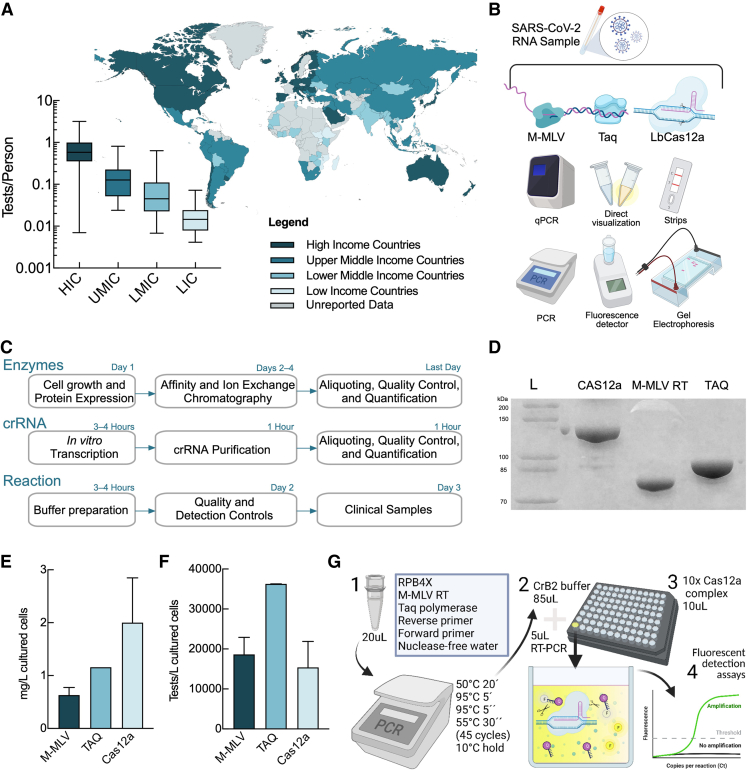
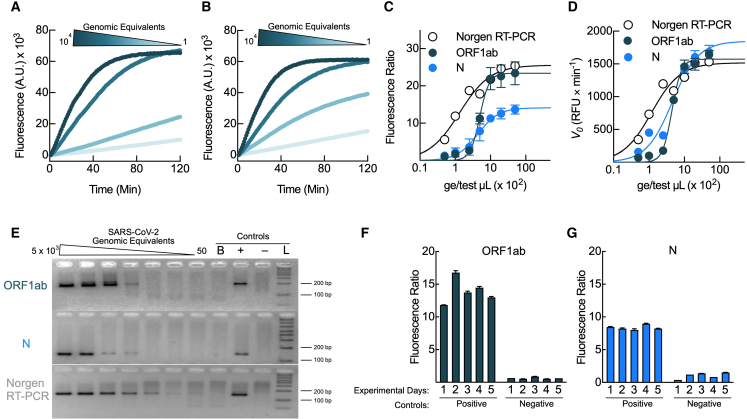
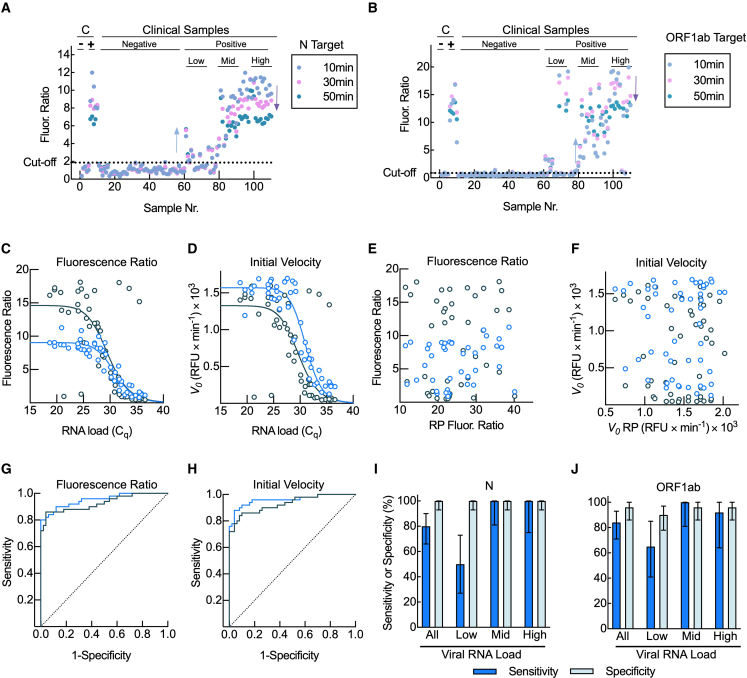
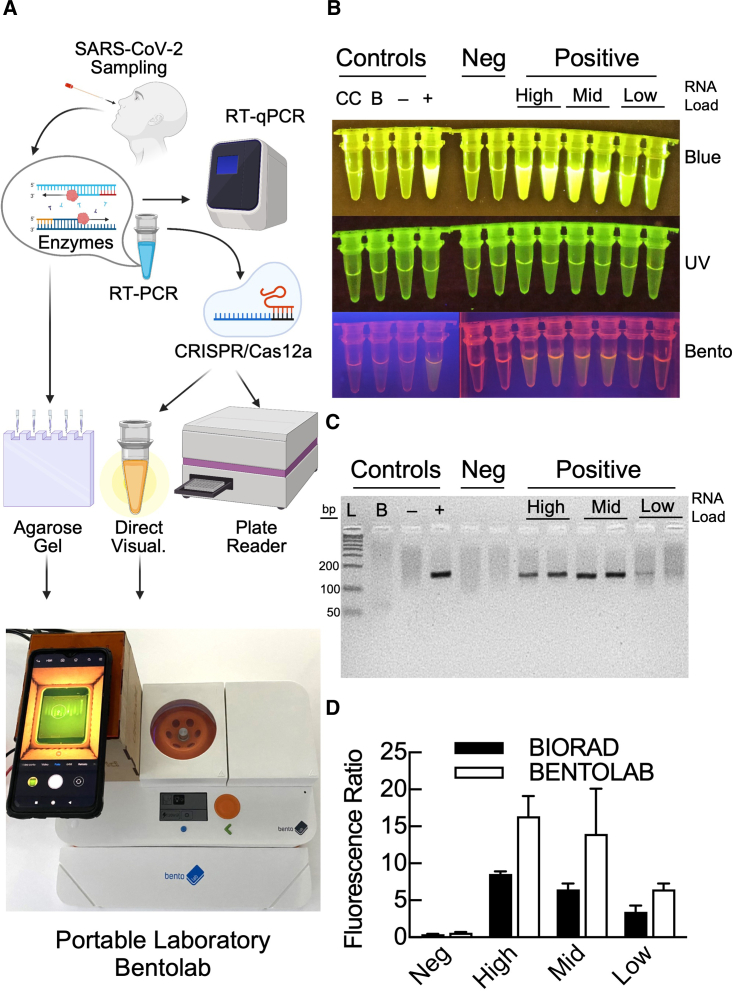
Low- and middle-income countries (LMICs) are significantly affected by SARS-CoV-2, partially due to their limited capacity for local production and implementation of molecular testing. Here, we provide detailed methods and validation of a molecular toolkit that can be readily produced and deployed using laboratory equipment available in LMICs. Our results show that lab-scale production of enzymes and nucleic acids can supply over 50,000 tests per production batch. The optimized one-step RT-PCR coupled to CRISPR-Cas12a-mediated detection showed a limit of detection of 102 ge/μL in a turnaround time of 2 h. The clinical validation indicated an overall sensitivity of 80%-88%, while for middle and high viral load samples (Cq ≤ 31) the sensitivity was 92%-100%. The specificity was 96%-100% regardless of viral load. Furthermore, we show that the toolkit can be used with the mobile laboratory Bento Lab, potentially enabling LMICs to implement detection services in unattended remote regions.

Keywords: COVID-19; CRISPR; LMICs; RT-PCR; SARS-CoV-2; fluorescence; molecular testing.


Conflict of interest statement

The authors declare no competing interests.

Figures

None
Graphical abstract
Figure 1
Figure 1
SARS-CoV-2 testing availability, inequality, and local production of reagents (A) Molecular testing availability as a function of income classification of countries by the World Bank. Total tests per thousand inhabitants were obtained from OurWorldInData.org (Hasell et al., 2020). The country classification map was done using mapchart.net. (B) Current molecular diagnostic platforms for detection of SARS-CoV-2. (C) Production scheme for recombinant DNA polymerases Taq and M-MLV, LbCas12a nuclease, and crRNAs. (D) Recombinant enzyme visualization and purity evaluation by SDS-PAGE 10%. (E) Comparison of enzyme yield expressed as milligrams of pure protein produced in 1 L of bacterial cell culture. (F) Estimated total test (reverse transcription, PCR, or CRISPR-Cas12a) reactions achievable in 1 L of bacterial cell culture producing recombinant enzymes M-MLV reverse transcriptase (RT), Taq DNA polymerase, or LbCas12a, respectively, out of E. coli. (G) Schematics and optimized conditions for the method presented here. The viral RNA is amplified by RT-PCR (step 1) and used for CRISPR-Cas12a-mediated detection (steps 2 to 4). Cas12a, upon recognition of the amplified target DNA, activates its collateral activity for ssDNA cleavage. The reaction mixture contains a dual-labeled ssDNA reporter probe, with fluorescein and a quencher. Upon Cas12a-dependent cleavage, the fluorescence of the fluorophore increases due to quencher diffusion (step 3). Error bars in (E) and (F) show the standard error, while in (A) they indicate the minimum and maximum.
Figure 2
Figure 2
Optimization of SARS-CoV-2 loci amplification by RT-PCR and CRISPR-Cas-mediated detection (A) Schematic representation of the SARS-CoV-2 genome and primer localization for ORF1ab and N target genes. Sequences matched by the crRNAs are highlighted (violet box) in the schematic representations of the amplified regions, for the ORF1ab (nucleotide positions 2,190–2,210) and N (nucleotide positions 29,195–29,214) targets. (B) Example fluorescence time course of CRISPR-Cas12a-mediated recognition of ORF1ab using primer set 3. (C) Fluorescence ratios comparing five primer combinations for ORF1ab. Colors for the primer combinations are as in (A). (D) Same as (B) for the N detection locus. (E) Comparison of five primer combinations for the N detection region. (F–H) Heatmaps displaying the CRISPR-Cas12a reaction components that were optimized, namely LbCas12a (F), crRNA (G), and magnesium (H), for both viral detection loci and the human RNaseP sample control. Reaction fluorescence ratios are depicted with continuous color shading. The concentrations of Cas12a, crRNA, and magnesium were 10 nM, 15 nM, and 10 mM, respectively, unless it was the variable under study. Fluorescence ratio is defined as the fluorescence of the test sample over that of the RT-PCR non-template control (blank) at a given time. Error bars represent the standard deviation of at least three independent measurements.
Figure 3
Figure 3
Analytical validation of SARS-CoV-2 RNA detection (A) Time courses of the CRISPR-Cas12a-mediated detection of ORF1ab at increasing genome equivalents of SARS-CoV-2 RNA. Selected time traces are colored in shades of green for genome equivalents decreasing by a factor of 10 from 104 (dark green) to 102 (light green) per reaction in addition to the blank control (lightest). (B) As in (A), for the N locus. (C) Comparison of the fluorescence ratio as a function of input genome equivalents of SARS-CoV-2 RNA in the RT-PCR for ORF1ab and N loci and the commercial 2X One-Step RT-PCR Master Mix from Norgen. (D) Initial velocity (V0) dependency on genome equivalents. (E) Gel electrophoresis analysis of RT-PCR products with varying genome equivalents for ORF1ab and N, and using the Norgen BioTek commercial one-step kit. (F) and (G) show day-to-day reproducibility assays for ORF1ab and N loci, respectively. Error bars represent the standard deviation of at least three independent measurements.
Figure 4
Figure 4
Test performance with clinical samples (A) Distribution of fluorescence ratios for positive and negative controls (n = 10) and unknown samples (n = 100) for the N target. The dashed line indicates the threshold as calculated by the ROC analysis. (B) As in (A), for the ORF1ab locus. (C) Fluorescence ratio as a function of viral RNA load (Cq values) for both SARS-CoV-2 targets, N (blue) and ORF1ab (green). (D–H) (D) Same as in (C), but using the initial velocity (V0). Fluorescence ratio (E) and initial velocity (F) dependence for ORF1ab and N as a function of the sample control RNaseP target. Colors are as in (C). ROC curve based on fluorescence ratio (G) or initial velocity (H). ROC curves were obtained independently for each evaluated SARS-CoV-2 target; colors are as in (C). (I) N target detection sensitivity and specificity with 95% CI (error bars) for all samples and by viral RNA load, namely high (Cq<25), medium (Cq=25–31), and low (Cq>31). (J) As in (I), for the ORF1ab target.
Figure 5
Figure 5
Alternative readouts and portability of molecular detection with Bento Lab. (A) Scheme of the different analytical options for the method reported here. (B–D) Two clinical samples of each viral RNA load group (low, medium, and high) and two negative samples were analyzed using the N target. (B) Fluorescent signals visualized in tubes using three different transilluminators: blue light (470 nm) (top), UV (middle), and Bento Lab (bottom). Controls included the CRISPR control (i.e., Cas12a reaction without amplified target DNA) for assessing background fluorescence (CC), the RT-PCR non-template control (blank, B), and pools of negative (−) or positive (+) samples. (C) Agarose gel (5%) electrophoresis of conventional RT-PCR-amplified products. L, DNA ladder; B, a PCR blank reaction (no template); plus and minus signs indicate positive and negative controls, respectively. (D) Ratio of CRISPR-Cas12a fluorescent signals of the test sample relative to the RT-PCR non-template control. Error bars indicate standard errors obtained from duplicate experiments.

Comment in

Similar articles

Cited by

References

    1. Abbott S., Hellewell J., Thompson R.N., Sherratt K., Gibbs H.P., Bosse N.I., Munday J.D., Meakin S., Doughty E.L., Chun J.Y., et al. Estimating the time-varying reproduction number of SARS-CoV-2 using national and subnational case counts. Wellcome Open Res. 2020;5:112.
    1. Adepoju P. Africa’s struggle with inadequate COVID-19 testing. Lancet Microbe. 2020;1:e12. - PMC - PubMed
    1. Alekseenko A., Barrett D., Pareja-Sanchez Y., Howard R.J., Strandback E., Ampah-Korsah H., Rovšnik U., Zuniga-Veliz S., Klenov A., Malloo J., et al. Direct detection of SARS-CoV-2 using non-commercial RT-LAMP reagents on heat-inactivated samples. Sci. Rep. UK. 2021;11:1820. - PMC - PubMed
    1. Ali Z., Aman R., Mahas A., Rao G.S., Tehseen M., Marsic T., Salunke R., Subudhi A.K., Hala S.M., Hamdan S.M., et al. iSCAN: an RT-LAMP-coupled CRISPR-Cas12 module for rapid, sensitive detection of SARS-CoV-2. Virus Res. 2020;288:198129. - PMC - PubMed
    1. Aslanzadeh J. Preventing PCR amplification carryover contamination in a clinical laboratory. Ann. Clin. Lab. Sci. 2004;34:389–396. - PubMed

Publication types