Genome and gene evolution of seahorse species revealed by the chromosome-level genome of Hippocampus abdominalis
- PMID: 34698429
- PMCID: PMC9298228
- DOI: 10.1111/1755-0998.13541
Genome and gene evolution of seahorse species revealed by the chromosome-level genome of Hippocampus abdominalis
Abstract
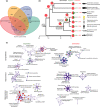
Seahorses belong to the teleost family Syngnathidae that evolved a distinct body plan and unique male pregnancy compared to other teleosts. As a classic model for studying evolution of viviparity and sexual selection of teleosts, seahorse species still lack a publicly available high-quality reference genome. Here, we generated the genome assembly of the big-belly seahorse, Hippocampus abdominalis with long-read and Hi-C technologies. We managed to place over 99% of the total length of 444.7 Mb of assembled genome into 21 linkage groups with almost no gaps. We reconstructed a phylogenomic tree with the big-belly seahorse genome and other representative Syngnathidae and teleost species. We also reconstructed the historical population dynamics of four representative Syngnathidae species. We found the gene families that underwent expansion or contraction in the Syngnathidae ancestor were enriched for immune-related or ion transporter gene ontology terms. Many of these genes were also reported to show a dynamic expression pattern during the pregnancy stages of H. abdominalis. We also identified putative positively selected genes in the Syngnathidae ancestor or in H. abdominalis, whose mouse mutants are enriched for abnormal craniofacial and limb morphological phenotypes. Overall, our study provides an important genome resource for evolutionary and developmental studies of seahorse species, and candidate genes for future experimental works.
Keywords: Hi-C; Seahorse; chromosome-level genome; male brood pouch.
© 2021 The Authors. Molecular Ecology Resources published by John Wiley & Sons Ltd.
Figures


Similar articles
-
The complete mitochondrial genome of the big-belly seahorse, Hippocampus abdominalis (Lesson 1827).Mitochondrial DNA A DNA Mapp Seq Anal. 2016 Nov;27(6):4605-4606. doi: 10.3109/19401736.2015.1101578. Epub 2015 Dec 28. Mitochondrial DNA A DNA Mapp Seq Anal. 2016. PMID: 26707598
-
Seahorse Brood Pouch Transcriptome Reveals Common Genes Associated with Vertebrate Pregnancy.Mol Biol Evol. 2015 Dec;32(12):3114-31. doi: 10.1093/molbev/msv177. Epub 2015 Sep 1. Mol Biol Evol. 2015. PMID: 26330546
-
Androgens and androgen receptor directly induce the thickening, folding, and vascularization of the seahorse abdominal dermal layer into a placenta-like structure responsible for male pregnancy via multiple signaling pathways.Int J Biol Macromol. 2024 Nov;279(Pt 1):135039. doi: 10.1016/j.ijbiomac.2024.135039. Epub 2024 Aug 27. Int J Biol Macromol. 2024. PMID: 39197609
-
Seahorse Male Pregnancy as a Model System to Study Pregnancy, Immune Adaptations, and Environmental Effects.Int J Mol Sci. 2023 Jun 3;24(11):9712. doi: 10.3390/ijms24119712. Int J Mol Sci. 2023. PMID: 37298663 Free PMC article. Review.
-
Sperm transport and male pregnancy in seahorses: An unusual model for reproductive science.Anim Reprod Sci. 2022 Nov;246:106854. doi: 10.1016/j.anireprosci.2021.106854. Epub 2021 Sep 20. Anim Reprod Sci. 2022. PMID: 34579988 Review.
Cited by
-
Independent Evolution of Sex Chromosomes and Male Pregnancy-Related Genes in Two Seahorse Species.Mol Biol Evol. 2023 Jan 4;40(1):msac279. doi: 10.1093/molbev/msac279. Mol Biol Evol. 2023. PMID: 36578180 Free PMC article.
-
Near chromosome-level and highly repetitive genome assembly of the snake pipefish Entelurus aequoreus (Syngnathiformes: Syngnathidae).GigaByte. 2024 Jan 11;2024:gigabyte105. doi: 10.46471/gigabyte.105. eCollection 2024. GigaByte. 2024. PMID: 38239770 Free PMC article.
-
The genetic basis of the leafy seadragon's unique camouflage morphology and avenues for its efficient conservation derived from habitat modeling.Sci China Life Sci. 2023 Jun;66(6):1213-1230. doi: 10.1007/s11427-022-2317-6. Epub 2023 May 12. Sci China Life Sci. 2023. PMID: 37204606
-
Chromosome-scale genome assembly of three-spotted seahorse (Hippocampus trimaculatus) with a unique karyotype.Sci Data. 2025 Jan 11;12(1):49. doi: 10.1038/s41597-024-04349-y. Sci Data. 2025. PMID: 39799130 Free PMC article.
-
Sexual Antagonism and Sex Determination in Three Syngnathid Species Alongside a Male Pregnancy Gradient.Genome Biol Evol. 2025 Jul 3;17(7):evaf103. doi: 10.1093/gbe/evaf103. Genome Biol Evol. 2025. PMID: 40619149 Free PMC article.
References
-
- Bellwood, D. R. (1996). The Eocene fishes of Monte Bolca: The earliest coral reef fish assemblage. Coral Reefs, 15(1), 11–19. 10.1007/bf01626074 - DOI
-
- Boecke, A. , Sieger, D. , Neacsu, C. D. , Kashkar, H. , & Krönke, M. (2012). Factor associated with neutral sphingomyelinase activity mediates navigational capacity of leukocytes responding to wounds and infection: Live imaging studies in zebrafish larvae. The Journal of Immunology, 189(4), 1559–1566. 10.4049/jimmunol.1102207 - DOI - PMC - PubMed
MeSH terms
Grants and funding
LinkOut - more resources
Full Text Sources
Research Materials
Miscellaneous

