
Coronavirus Disease Contact Tracing Outcomes and Cost, Salt Lake County, Utah, USA, March-May 2020

Victoria L Fields et al. Emerg Infect Dis. 2021 Dec.

Abstract

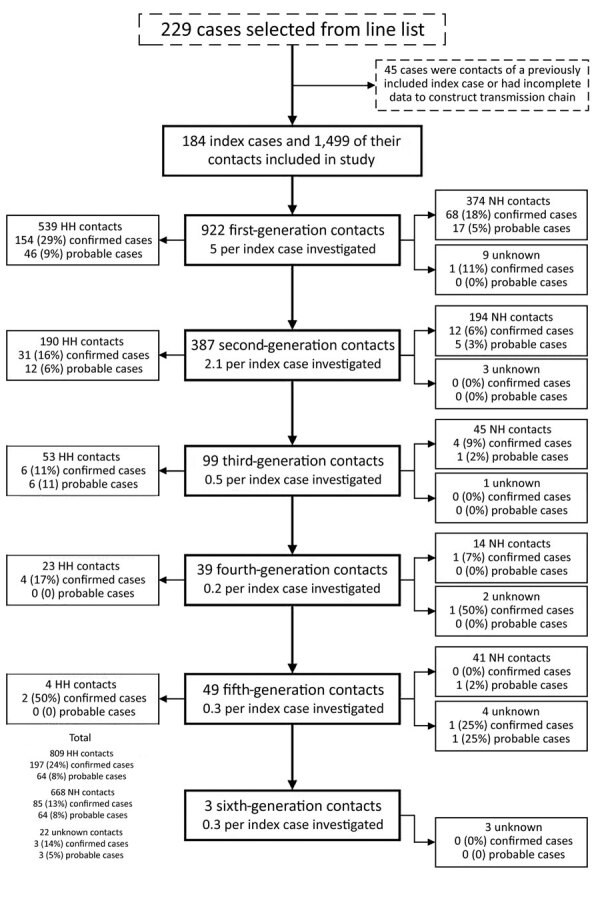
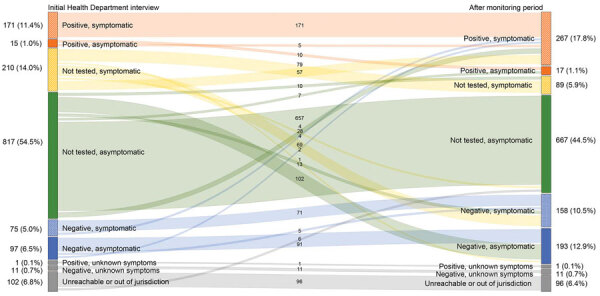
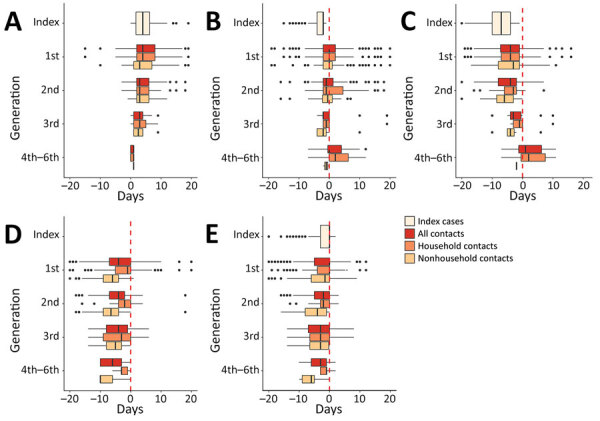
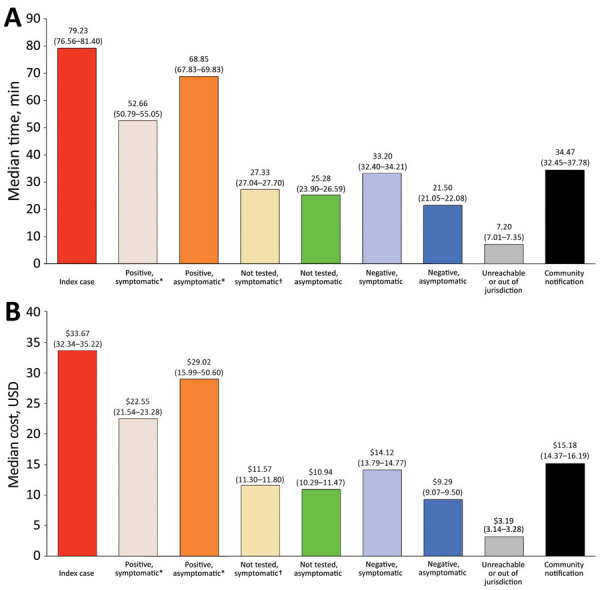
Outcomes and costs of coronavirus disease (COVID-19) contact tracing are limited. During March-May 2020, we constructed transmission chains from 184 index cases and 1,499 contacts in Salt Lake County, Utah, USA, to assess outcomes and estimate staff time and salaries. We estimated 1,102 staff hours and $29,234 spent investigating index cases and contacts. Among contacts, 374 (25%) had COVID-19; secondary case detection rate was ≈31% among first-generation contacts, ≈16% among second- and third-generation contacts, and ≈12% among fourth-, fifth-, and sixth-generation contacts. At initial interview, 51% (187/370) of contacts were COVID-19-positive; 35% (98/277) became positive during 14-day quarantine. Median time from symptom onset to investigation was 7 days for index cases and 4 days for first-generation contacts. Contact tracing reduced the number of cases between contact generations and time between symptom onset and investigation but required substantial resources. Our findings can help jurisdictions allocate resources for contact tracing.

Keywords: COVID-19; SARS; SARS-CoV-2; contact tracing; coronavirus; coronavirus disease; respiratory infections; severe acute respiratory syndrome coronavirus 2; viruses; zoonoses.


Figures

Figure 1
Figure 1
Flowchart of index case-patients and their contacts identified during coronavirus disease contact tracing, Salt Lake County, Utah, USA, March–May 2020. Confirmed cases comprised disease categories positive symptomatic, positive asymptomatic, and positive unknown symptoms. Probable cases comprised contacts in the not tested symptomatic disease category. Twenty-three HH contacts and 13 NH contacts were symptomatic on the same day or before the index case; contacts with an earlier symptom onset date were not reclassified. HH, household contacts; NH, nonhousehold contacts.
Figure 2
Figure 2
Coronavirus disease status at initial health department interaction and after 14-day monitoring period, Salt Lake County, Utah, USA, March–May 2020. Numbers in the center signify the change in status from initial interaction by health department after the monitoring period. Numbers on left and right represent total (%) of cases in each group. The median monitoring period was the time from initial health department interview to 14 days after the last exposure to the index case. Colors represent disease status classification category.
Figure 3
Figure 3
Box-and-whisker plots showing time from key coronavirus disease contact tracing–associated dates to other key dates, Salt Lake County, Utah, USA, March–May 2020. A) Days from symptom onset to PCR testing; B) days from PCR testing to initial interaction with Salt Lake County Health Department (SLCoHD); C) days from symptom onset to initial interaction with SLCoHD; D) days from last day of exposure to a confirmed or probable case to initial interaction with SLCoHD; E) days from monitoring start date to initial interaction with SLCoHD. The all contacts category includes contacts with an unknown relationship to a confirmed or probable case. Dotted red lines represent when the Salt Lake County Health Department had initial interactions with cases or contacts. Vertical lines within boxes indicate the median, left and right box edges indicate the interquartile range (IQR), and whiskers indicate the lower extreme and upper extreme quartiles; black dots indicate outliers. Negative values along the x-axis indicate that the second event happened before the first event.
Figure 4
Figure 4
Estimated median time and cost spent educating, interviewing, and charting index cases and their contacts by final coronavirus disease status, Salt Lake County, Utah, USA, March–May 2020. Community notifications consisted of notifying businesses or persons that might have been exposed to the confirmed case such as in a workplace, at a wedding, or in a church. Asterisk (*) indicates case; dagger (†) indicates probable case. A) Median time in minutes and 95% CIs are reported above each bar. B) Median cost in USD and 95% CIs are reported above each bar.

References

    1. Bing.com. COVID-19 tracker [cited 2021 Feb 19]. https://bing.com/covid/local/unitedstates
    1. Park YJ, Choe YJ, Park O, Park SY, Kim YM, Kim J, et al.; COVID-19 National Emergency Response Center, Epidemiology and Case Management Team. Contact tracing during coronavirus disease outbreak, South Korea, 2020. Emerg Infect Dis. 2020;26:2465–8. 10.3201/eid2610.201315 - DOI - PMC - PubMed
    1. World Health Organization. Contact tracing in the context of Covid-19. Interim guidance [cited 2020 Sep 24]. https://apps.who.int/iris/bitstream/handle/10665/332049/WHO-2019-nCoV-Co...
    1. Salathé M, Althaus CL, Neher R, Stringhini S, Hodcroft E, Fellay J, et al. COVID-19 epidemic in Switzerland: on the importance of testing, contact tracing and isolation. Swiss Med Wkly. 2020;150:w20225. 10.4414/smw.2020.20225 - DOI - PubMed
    1. Zou L, Ruan F, Huang M, Liang L, Huang H, Hong Z, et al. SARS-CoV-2 viral load in upper respiratory specimens of infected patients. N Engl J Med. 2020;382:1177–9. 10.1056/NEJMc2001737 - DOI - PMC - PubMed

LinkOut - more resources