. 2021 Nov 15;148(22):dev199584.
doi: 10.1242/dev.199584. Epub 2021 Nov 15.

Live imaging of retinotectal mapping reveals topographic map dynamics and a previously undescribed role for Contactin 2 in map sharpening

Affiliations

Live imaging of retinotectal mapping reveals topographic map dynamics and a previously undescribed role for Contactin 2 in map sharpening

Olivia Spead et al. Development. .

Abstract

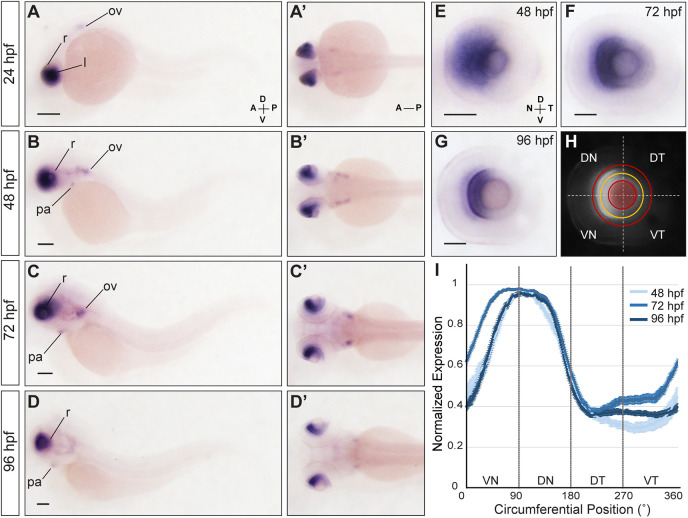
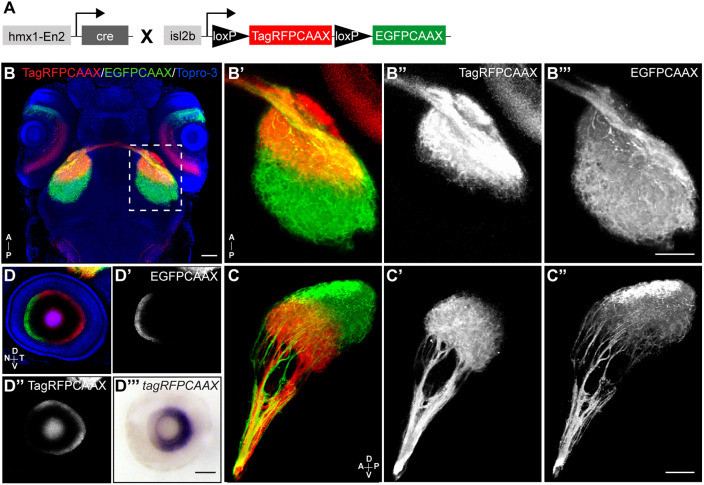
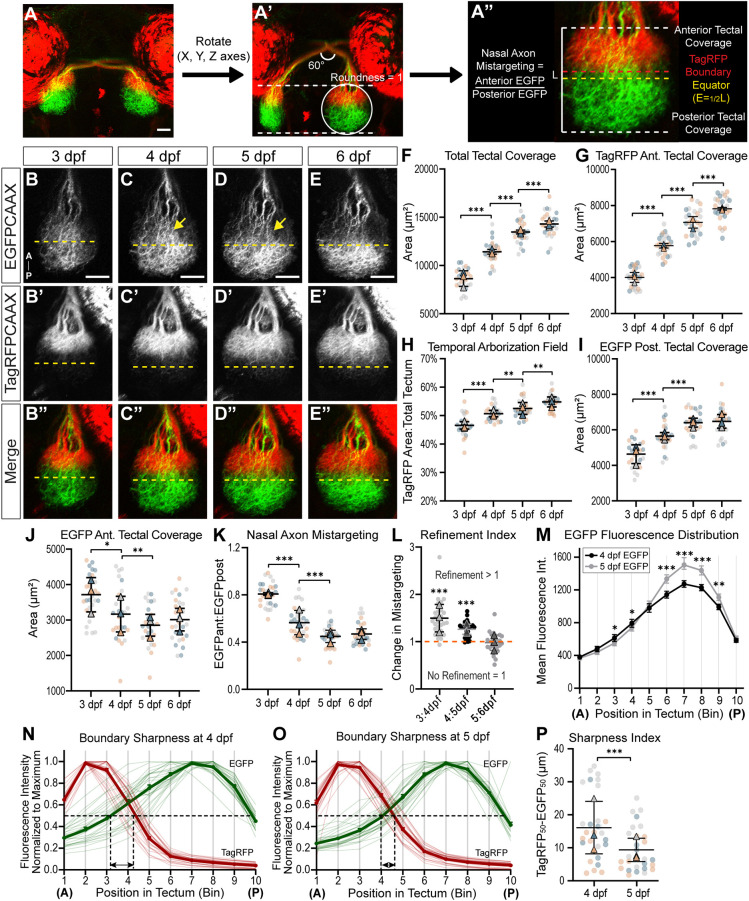
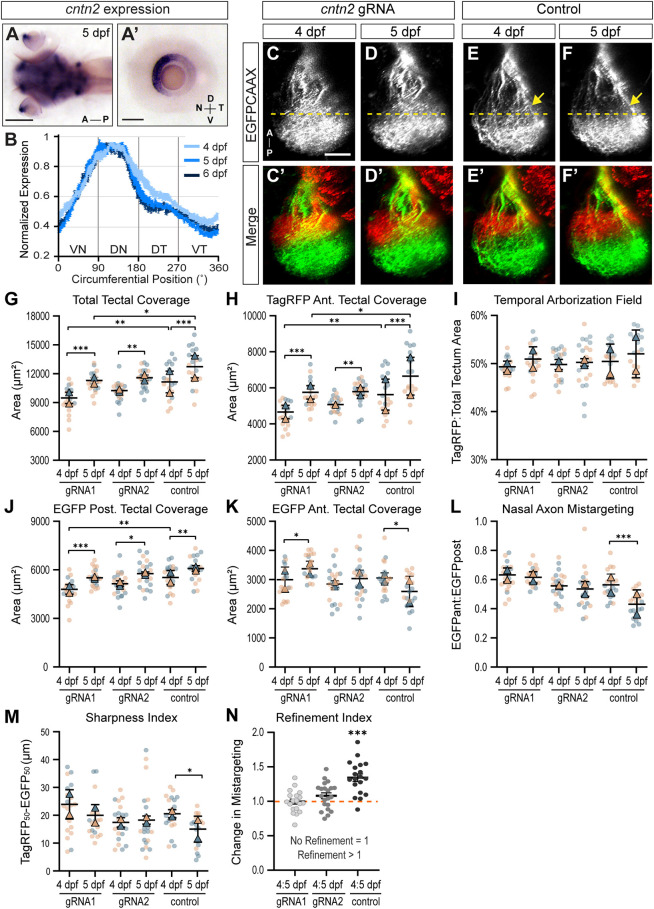
Organization of neuronal connections into topographic maps is essential for processing information. Yet, our understanding of topographic mapping has remained limited by our inability to observe maps forming and refining directly in vivo. Here, we used Cre-mediated recombination of a new colorswitch reporter in zebrafish to generate the first transgenic model allowing the dynamic analysis of retinotectal mapping in vivo. We found that the antero-posterior retinotopic map forms early but remains dynamic, with nasal and temporal retinal axons expanding their projection domains over time. Nasal projections initially arborize in the anterior tectum but progressively refine their projection domain to the posterior tectum, leading to the sharpening of the retinotopic map along the antero-posterior axis. Finally, using a CRISPR-mediated mutagenesis approach, we demonstrate that the refinement of nasal retinal projections requires the adhesion molecule Contactin 2. Altogether, our study provides the first analysis of a topographic map maturing in real time in a live animal and opens new strategies for dissecting the molecular mechanisms underlying precise topographic mapping in vertebrates.

Keywords: Adhesion molecule; Axon guidance; Refinement; Visual system; Zebrafish.


Conflict of interest statement

Competing interests The authors declare no competing or financial interests.

Figures

Fig. 1.
Fig. 1.
Hmx1 is expressed in the nasal RGC layer throughout development. (A-D′) Lateral (A-D) and dorsal (A′-D′) views of embryos stained for hmx1 by ISH. Hmx1 is detected in the nasal retina (r), lens (l), otic vesicle (ov) and pharyngeal arches (pa) at 24 hpf (A,A′), 48 hpf (B,B′), 72 hpf (C,C′) and 96 hpf (D,D′). (E-G) Dissected eyes stained for hmx1. Hmx1 is detected in the nasal half of the retina at 48 hpf (E) and becomes restricted to the nasal RGC and inner nuclear layers at 72 and 96 hpf (F,G). (H) Hmx1 expression signal intensity was measured along a 360° trajectory line (yellow) drawn half-way between the lens and RGC layer periphery (red lines). (I) Hmx1 expression is restricted to the nasal RGC layer. Data are mean±s.e.m. DN, dorso-nasal; DT, dorso-temporal; VN, ventro-nasal; VT, ventro-temporal. Scale bars: 200 µm (A-D′); 50 µm (E-G).
Fig. 2.
Fig. 2.
Hmx1 enhancers recapitulate hmx1 endogenous expression. (A) Schematic of the hmx1/hmx4 locus on chromosome 1 (Zv9 assembly, UCSC Genome browser; Kent et al., 2002). The distribution of H3K27ac, H3K4me1, and H3K4me3 modifications at 48 hpf is shown (tracks from Bogdanovic et al., 2012). Four putative regulatory regions named hmx1-En1, hmx1-En2, hmx1-En2s and hmx1-En3 were tested for enhancer activity in stable transgenic larvae. (B,B′) Hmx1-En1 drives EGFPCAAX expression in the pharyngeal arches (pa) and lip (lp) region at 96 hpf. (C,C′) Hmx1-En2 drives expression in the nasal retina (arrow), lens (l), midbrain (mb), pa, inferior lip (ilp) and pericardic (pc) region at 96 hpf. Epifluorescence microscopy, scale bar: 200 µm.
Fig. 3.
Fig. 3.
Hmx1-En2 drives expression in the nasal retina throughout development. (A-F′) Epifluorescence microscopy (A-F) and corresponding bright-field images (A′-F′) showing EGFPCAAX expression in Tg[hmx1-En2:EGFPCAAX] transgenic embryos (A,C,E) and dissected eyes (B,D,F) at 24, 48 and 96 hpf. Fluorescence is detected in the nasal but not temporal retina (arrows) at all stages. (G-H′) Confocal microscopy showing lateral (G,G′) and dorsal (H,H′) views of a double transgenic larvae expressing EGFPCAAX driven by hmx1-En2 and TagRFP in RGCs at 96 hpf. EGFPCAAX is observed in nasal RGCs (arrows) and corresponding axons projecting to the posterior tectum (arrowheads). Scale bars: 200 µm (A,C,E); 50 µm (B,D,F); 100 µm (G,H).
Fig. 4.
Fig. 4.
Hmx1:cre-mediated recombination of an RGC:colorswitch reporter enables the visualization of the A/P retinotopic map in vivo. (A) Schematic of the hmx1-En2:cre and isl2b:loxP-TagRFPCAAX-loxP-EGFPCAAX (RGC:colorswitch) transgenes expressed in double transgenic larvae. (B) Confocal microscopy with 3D rendering showing dorsal view of a transgenic larva immunolabeled for TagRFP and EGFP at 4 dpf. To-Pro-3 was used as a nuclear counterstain to delineate the tectal neuropil. (B′-B‴) TagRFP-positive temporal axons project specifically to the anterior tectal half (B″), whereas EGFP-positive nasal axons project through the anterior to the posterior tectum (B‴). (C-C″) Nasal and temporal axons intermingle in the optic tract but project to distinct tectal halves. (D-D″) EGFP-positive and TagRFP-positive RGCs are restricted to the nasal and temporal retina, respectively. (D‴) Eye of a transgenic larva stained for tagRFP by ISH at 4 dpf. TagRFP expression remains restricted to the temporal retina. Scale bars: 50 µm (B-D‴).
Fig. 5.
Fig. 5.
Nasal axons refine their tectal projection domain between 4 and 5 dpf. (A-A″) Summarized quantification method to analyze retinotopic mapping (see details in Fig. S3). (A″) The anterior tectal boundary was defined as the rostral limit of the tectum (white dashed line), the posterior boundary, as the caudal end of the tectum (white dashed line), the TagRFP boundary (red dashed line) as the caudal limit of the TagRFP signal, and the equator (E; yellow dashed line) as half of the total tectum length (L) measured between the rostral and caudal tectal boundaries. The tectal area rostral to the equator was defined as the anterior tectal half, the area caudal to the equator as the posterior half. (B-E″) Confocal microscopy showing the development of the A/P retinotopic map from 3 to 6 dpf. (B-E) EGFP-positive nasal axons progressively refine their targeting domain to the posterior tectal half. Axons mistargeting the anterior tectal half appear to disappear between 4 and 5 dpf (arrows). (B′-E′) TagRFP-positive temporal axons target the anterior tectal half. (B″-E″) The A/P topographic map is established early and maintained as retinal axons continue to innervate the tectum. The temporal retinal arborization field expands to fill the anterior tectal half, reaching the equator position by 6 dpf. (F) The total tectal area covered by TagRFP-positive and EGFP-positive axons significantly increases from 3 to 6 dpf. (G) The anterior area of the tectum covered by temporal axons also steadily increases from 3 dpf and 6 dpf. (H) The temporal arborization field, defined as the ratio of the TagRFP area of coverage to the total tectal area, progressively expands from 3 to 6 dpf. (I) EGFP-positive nasal axons terminating in the posterior tectal half cover a significantly larger area between 3 and 4 dpf, and 4 and 5 dpf, before the area of coverage stabilizes between 5 and 6 dpf. (J) The anterior tectal area covered by EGFP nasal axons significantly decreases between 4 and 5 dpf, indicating a refinement of the nasal projection domain. (K) The nasal axon mistargeting index (NAMI), defined as the ratio between the anterior and posterior tectal areas covered by EGFP-positive nasal axons, significantly decreases between 3 and 4 dpf as well as between 4 and 5 dpf. (L) The refinement index corresponding to the change in the NAMI between two consecutive days is greater than 1 between 3 and 4 dpf, and 4 and 5 dpf, indicating a refinement of nasal projections. It averages a value of 1 between 5 and 6 dpf, indicating no refinement during that period. (M) The mean EGFP fluorescence intensity was measured in 10 bins distributed along the A/P axis of the tectum at 4 and 5 dpf. It significantly decreases in anterior bins 3 and 4 from 4 to 5 dpf while increasing in posterior bins 6-9. (N,O) Normalized fluorescence intensities of EGFP and TagRFP were plotted along the A/P axis of the tectum. The distance from the anterior tectal boundary at which EGFP and TagRFP intensities reached 50% of their maximal value is marked by dashed lines. It decreases between 4 and 5 dpf (double arrows), indicating a sharpening of the boundary between EGFP and TagRFP projection domains. (P) The boundary sharpness index corresponding to the distance between EGFP50% and TagRFP50% (double arrows in N and O) significantly decreases between 4 and 5 dpf. Data are mean±s.e.m. *P<0.05, **P<0.01, ***P<0.001 [one-way ANOVA with Tukey's multiple comparisons post-hoc test (F-K); two-tailed, paired t-test (L,M,P)]. n=27 larvae. Circles represent individual larvae; triangles represent mean. Scale bars: 50 µm.
Fig. 6.
Fig. 6.
Cntn2 is required for the refinement of nasal projections and map sharpening. (A,A′) Larva and dissected eye stained for cntn2 by ISH at 5 dpf. Cntn2 is strongly expressed in the nasal RGC layer. (B) Cntn2 expression is restricted to the nasal RGC layer at 4, 5 and 6 dpf. (C-F′) Confocal microscopy showing the development of the A/P retinotopic map in cntn2 gRNA-injected larvae (C-D′) and Cas9-injected control larvae (E-F′) from 4 to 5 dpf. The anterior tectal area covered by EGFP-positive nasal axons does not change between 4 and 5 dpf in cntn2 crispants, whereas it appears to decrease in control larvae (E-F, arrows). (G) The total tectal area significantly increases in crispants injected with gRNA1 or gRNA2 and in control larvae between 4 and 5 dpf. (H) The anterior area of the tectum covered by temporal axons significantly increases between 4 and 5 dpf in both crispants and controls. (I) The temporal arborization field is similar between cntn2 crispants and controls. (J) The area covered by nasal axons in the posterior half of the tectum significantly increases in cntn2 crispants and controls. (K) The area covered by nasal axons in the anterior tectal half significantly decreases between 4 and 5 dpf in controls but not in crispants, indicating an absence of refinement in crispants. (L) The nasal axon mistargeting index decreases in controls but remains unchanged in crispants. (M) The boundary sharpness index remains constant in cntn2 crispants, indicating that the boundary between EGFP and TagRFP projection domains does not refine over time (see also Fig. S5). (N) The refinement index is greater than 1 in controls but averages 1 in crispants, confirming the absence of refinement of the nasal projection domain. Data are mean±s.e.m. *P<0.05, **P<0.01, ***P<0.001 (mixed effects one-way ANOVA followed by Tukey's multiple comparisons post-hoc test). n=19 gRNA1 crispants, 21 gRNA2 crispants, 19 controls. Circles represent individual larvae; triangles represent mean. Scale bars: 100 µm (A); 50 µm (A′,C-F′).

Similar articles

Cited by

References

    1. Adamska, M., Wolff, A., Kreusler, M., Wittbrodt, J., Braun, T. and Bober, E. (2001). Five Nkx5 genes show differential expression patterns in anlagen of sensory organs in medaka: insight into the evolution of the gene family. Dev. Genes Evol. 211, 338-349. 10.1007/s004270100162 - DOI - PubMed
    1. Alsina, B., Vu, T. and Cohen-Cory, S. (2001). Visualizing synapse formation in arborizing optic axons in vivo: dynamics and modulation by BDNF. Nat. Neurosci. 4, 1093-1101. 10.1038/nn735 - DOI - PubMed
    1. Baeriswyl, T. and Stoeckli, E. T. (2008). Axonin-1/TAG-1 is required for pathfinding of granule cell axons in the developing cerebellum. Neural Dev. 3, 7. 10.1186/1749-8104-3-7 - DOI - PMC - PubMed
    1. Baier, H., Klostermann, S., Trowe, T., Karlstrom, R. O., Nüsslein-Volhard, C. and Bonhoeffer, F. (1996). Genetic dissection of the retinotectal projection. Development 123, 415-425. 10.1242/dev.123.1.415 - DOI - PubMed
    1. Ben Fredj, N., Hammond, S., Otsuna, H., Chien, C. B., Burrone, J. and Meyer, M. P. (2010). Synaptic activity and activity-dependent competition regulates axon arbor maturation, growth arrest, and territory in the retinotectal projection. J. Neurosci. 30, 10939-10951. 10.1523/JNEUROSCI.1556-10.2010 - DOI - PMC - PubMed

Publication types

MeSH terms

LinkOut - more resources