. 2021 Dec 6;218(12):e20211872.
doi: 10.1084/jem.20211872. Epub 2021 Oct 26.

Dnmt3a-mutated clonal hematopoiesis promotes osteoporosis

Affiliations

Dnmt3a-mutated clonal hematopoiesis promotes osteoporosis

Peter Geon Kim et al. J Exp Med. .

Abstract

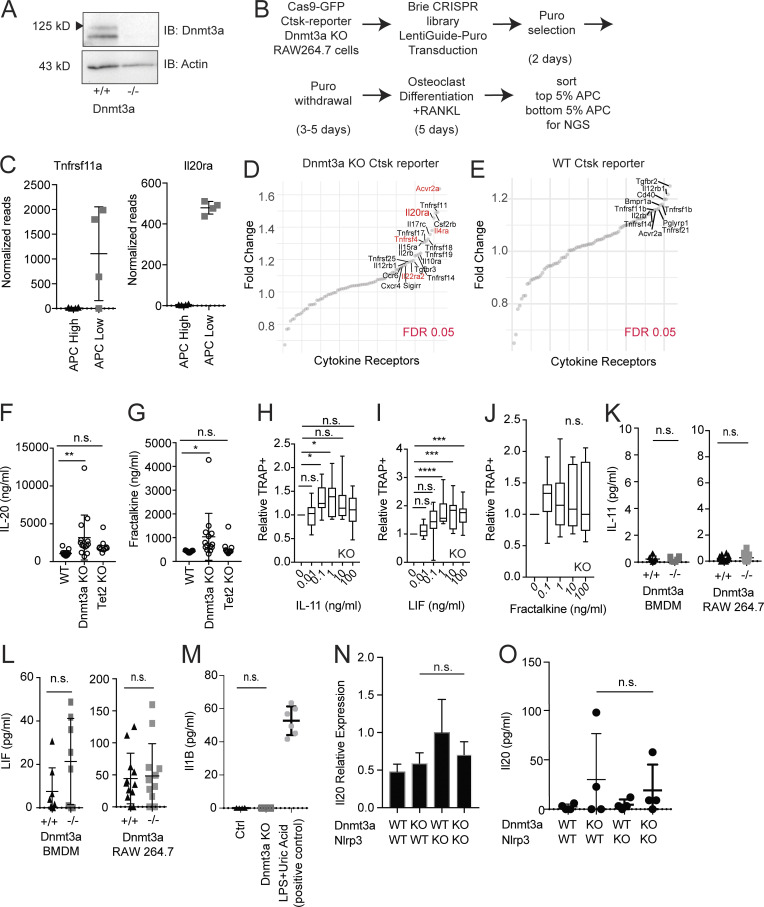
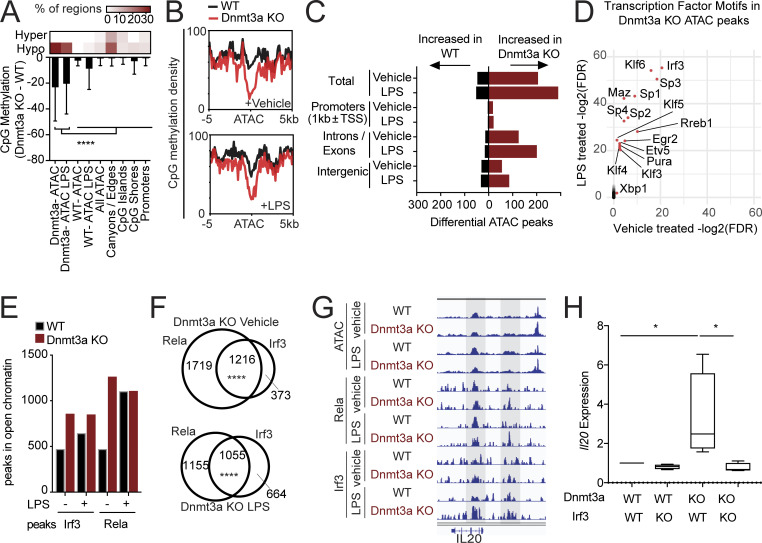
Osteoporosis is caused by an imbalance of osteoclasts and osteoblasts, occurring in close proximity to hematopoietic cells in the bone marrow. Recurrent somatic mutations that lead to an expanded population of mutant blood cells is termed clonal hematopoiesis of indeterminate potential (CHIP). Analyzing exome sequencing data from the UK Biobank, we found CHIP to be associated with increased incident osteoporosis diagnoses and decreased bone mineral density. In murine models, hematopoietic-specific mutations in Dnmt3a, the most commonly mutated gene in CHIP, decreased bone mass via increased osteoclastogenesis. Dnmt3a-/- demethylation opened chromatin and altered activity of inflammatory transcription factors. Bone loss was driven by proinflammatory cytokines, including Irf3-NF-κB-mediated IL-20 expression from Dnmt3a mutant macrophages. Increased osteoclastogenesis due to the Dnmt3a mutations was ameliorated by alendronate or IL-20 neutralization. These results demonstrate a novel source of osteoporosis-inducing inflammation.


Conflict of interest statement

Disclosures: A. Niroula reported grants from the Knut and Alice Wallenberg Foundation outside the submitted work. A. Bick reported personal fees from Foresite Labs outside the submitted work. J. Pirruccello reported personal fees from Maze Therapeutics outside the submitted work. M. Agrawal reported personal fees from German Accelerator Life Sciences outside the submitted work, and is the co-founder of and holds equity in iuvando Health. None of these are related to the submitted work. D.P. Kiel reported grants from Amgen, Radius Health, and Solarea Bio; and "other" from Solarea Bio, Pfizer, and Wolters Kluwer outside the submitted work. J.B. Richards reported personal fees from GlaxoSmithKline and Deerfield Capital; grants from Biogen and Eli Lilly; and non-financial support from 5 Prime Sciences outside the submitted work. J.B. Richards has served as an advisor to GlaxoSmithKline and Deerfield Capital. His institution has received investigator-initiated grant funding from Eli Lilly, GlaxoSmithKline and Biogen for projects unrelated to this research. He is the founder of 5 Prime Sciences. M.N. Wein reported grants from Radius Health and Galapagos NV, and "other" from Relation Therapeutics outside the submitted work. S. Jaiswal reported personal fees from AVRO Bio, Novartis, Genentech, and Foresite Labs outside the submitted work. P. Natarajan reported grants from Apple, AstraZeneca, Boston Scientific, and Novartis; personal fees from Apple, AstraZeneca, Genentech, Novartis, Blackstone Life Sciences, and Foresite Labs; and "other" from Vertex outside the submitted work. B.L. Ebert reported grants from Celgene, Novartis, Deerfield, and Calico; and personal fees from Exo Therapeutics, Skyhawk Therapeutics, Neomorph Therapeutics, and TenSixteen Bio outside the submitted work. No other disclosures were reported.

Figures

Figure S1.
Figure S1.
UK Biobank cohort and mouse models of CHIP. (A) Cohort selection and exclusion criteria from 200,000 individuals from the UK Biobank who had whole-exome sequencing performed. (B) Forest plot of the β-estimates for eBMD generated from multivariate linear regression model using CHIP mutations stratified by VAF ≥10% or <10%, and adjusted for age ≥65 yr, sex, BMI <18.5 kg/m2 (underweight), BMI >30 kg/m2 (obese), prior or current smoking status, self-reported history of steroid use, and rheumatoid arthritis diagnosis. The horizontal lines represent Wald 95% CIs. (C) Analysis of cells reconstituted after BM transplantation. BM from mouse with constitutive expression of GFP under a CAG promoter (JAX 024858) was transplanted into WT recipient mice. BM was analyzed at 8 wk after transplantation for CD45+ and GFP+. Most of the GFP positivity is retained in the CD45+ hematopoietic population. On the right is a quantification of GFP percentage in the hematopoietic (CD45+) and nonhematopoietic (CD45) populations. n = 5. (D) Influence of Dnmt3a KO on bone mass in a nontransplant setting. Female WT (Vav1-Cre) or Dnmt3a KO (Dnmt3afl/flVav1-Cre) mice were aged 33–34 wk and analyzed on µCT for the femoral mid-shaft Ct Ar. n = 3–7. (E and F) Tibias of transplanted WT or Dnmt3a R878H mice were stained with Goldener’s Trichrome stain 20 wk after transplantation. n = 6. Samples were analyzed in a blinded fashion for Ob.N/BS (E) and Ob.S/BS (F) by the Center for Skeletal Research at Massachusetts General Hospital. (G) Procollagen 1 N-terminal propeptide (P1NP) serum levels in mice transplanted with WT or Dnmt3a KO BM into 8– to 10-wk-old Ldlr KO mice fed an HFD. ELISA analysis of serum obtained at 4 mo after transplantation. n = 11–14. (H) Representative images of F-actin rings marking osteoclasts shown by phalloidin immunofluorescence staining. White bar represents 100 µm. Green represents Alex Fluor 488–phalloidin. Blue represents DAPI staining. (I) Quantification of osteoclast differentiation from whole BM of 12-wk-old Dnmt3a KO and WT female mice. n = 5. (J) Correlation between TRAP quantification for osteoclasts and F-actin ring staining with simultaneous staining for TRAP and F-actin rings. (K) Immunoblot (IB) for Dnmt3a in RAW264.7 cells with heterozygous (+/−) or homozygous (−/−) frame-shift mutations in Dnmt3a. (L and M) Quantification of number of osteoclast-like cells from osteoclast differentiation of Dnmt3a +/+, +/−, −/− RAW264.7 cells. (L and M) Osteoclast differentiation was performed using vehicle treatment (L; n = 7) or LPS (M; 0.1 ng/ml; n = 6). (N and O) Quantitative hydroxyapatite resorption assay using osteoclast differentiation of Dnmt3a +/+, +/−, and −/− RAW264.7 cells. Osteoclast differentiation was performed using vehicle treatment (N; n = 7) or LPS (O; 0.1 ng/ml; n = 7). Resorbed areas were distinguished by image thresholding using ImageJ software. Each data plot represents average resorbed areas across all nonoverlapping images taken in a well on day 7 of differentiation. Error bars represent SEM. (P) Quantification of donor CD11b+ in the Dnmt3a KO and WT BM of transplants into Ldlr−/− recipient mice fed a HFD. n = 10–14. (Q) Quantification of donor CD11b+ in the Dnmt3a KO and WT BM of transplants into WT mice fed a ND. n = 7–10. (R) Quantification of donor CD11b+ in the Dnmt3a R878H and WT BM of transplants into WT mice fed a ND. n = 10–15. (S) Quantification of CD11b−/lowCD115+Ly6Chi osteoclast precursors in the Dnmt3a KO and WT BM of transplants into WT mice fed a ND. n = 7–19. (T) Quantification of CD11b−/lowCD115+Ly6Chi osteoclast precursors in the Dnmt3a R878H and WT BM of transplants into WT mice fed a ND. n = 10–15. (U–W) RNA sequencing of unstimulated BMDMs derived from WT or Dnmt3a−/− mice. n = 4. (U) Differentially expressed genes from all genes. (V) Cytokine pathway enrichment analysis using gene set variation analysis (Hänzelmann et al., 2013). Highlighted pathways indicate FDR < 0.05. (W) Significant differentially expressed cytokines/chemokines genes. *, P < 0.05; **, P < 0.01; ***, P < 0.001; ****, P < 0.0001. All error bars represent SD unless specified. Source data are available for this figure: SourceData FS1.
Figure 1.
Figure 1.
Increased risk for osteoporosis in humans and murine models with CHIP. (A) Cumulative incidence of osteoporosis diagnoses by ICD based on CHIP status. Individuals were censored at the time of osteoporosis diagnosis, the end of follow up, or at the time of death or malignant neoplasm diagnosis as competing risks. (B) Forest plot of hazard ratios (HR) for the association between incident ICD osteoporosis diagnoses and the presence of CHIP stratified by VAF ≥10% or <10% in the Cox proportional hazard model, adjusted for age ≥65 yr, sex, BMI <18.5 kg/m2 (underweight), BMI >30 kg/m2 (obesity), history of smoking, oral corticosteroid use, and rheumatoid arthritis. The horizontal lines represent Wald 95% CIs. (C) Forest plot of the β-estimates for eBMD generated from multivariate linear regression model using CHIP or DNMT3A mutations stratified by VAF ≥10% or <10% and osteoporosis risk covariates as above. The horizontal lines represent Wald 95% CIs. (D–G) Tet2fl/flVav1-Cre (Tet2−/−), Dnmt3afl/flVav1-Cre (Dnmt3a−/−), and Vav1-Cre (WT) BM transplants into WT male mice and sacrificed at 20 wk after transplantation for blinded µCT analysis. To assess statistical significance, one-way ANOVA was used against WT, and P values were adjusted for multiple comparisons using the two-stage linear step-up procedure of BY. Error bars represent SD. (D and E) BM transplants into WT recipient mice fed a ND. µCT analysis for Tb BV/TV (D) and femoral mid-shaft Ct Ar (E). n = 10–14. (F and G) BM transplants into Ldlr−/− recipient mice fed HFD 4-wk after transplantation. µCT analysis for F) Tb BV/TV and G) Ct Ar. n = 9–19. (H) Representative sagittal µCT images of the distal femur in Tet2−/−, Dnmt3a−/−, and WT BM transplants into Ldlr−/− recipients fed a HFD (top row) or WT recipients fed a ND (bottom row). Scale bar (bottom right), 1 mm. *, P < 0.05; **, P < 0.01; ***, P < 0.001; ****, P < 0.0001.
Figure 2.
Figure 2.
Dnmt3a-mutated myeloid cells increase osteoclastogenesis. (A) Representative sections of the distal femur in WT or Dnmt3a−/− BM transplants into Ldlr−/− recipients fed an HFD. For A–D, mice were sacrificed at 20 wk after transplantation, and sections were stained for TRAP (red). Scale bar (bottom right), 200 µm. (B and C) Quantification of N. Oc/BS in the distal femur in BM transplants with Ldlr−/− recipients fed a HFD (B; n = 13–14) and WT recipients fed an ND (C; n = 9–19). (D) Quantification of N. Oc/BS in the tibias of WT recipients fed an ND with WT or Dnmt3aR878H BM transplants (n = 6). (E and F) Rescue of decline in cortical bone mass in Dnmt3aR878H mice with alendronate. Dnmt3aR878H or WT BM transplants into WT recipients fed an ND. Mice were treated with subcutaneous injections of alendronate or vehicle twice a week for 7 wk starting 14 wk after transplantation. Mice were sacrificed 20 wk after transplantation for µCT analysis of the femur for Ct Ar (E) and ultimate moment using mechanical testing (F). Changes in Tb BV/TV of the femoral metaphysis were not significant between WT and Dnmt3aR878H transplants. n = 10–15. P values were determined via comparison to vehicle-treated Dnmt3aR878H and adjusted for multiple comparisons using BY. P = 0.08 for comparison between WT and Dnmt3a R878H on mechanical testing. (G) Osteoclast differentiation ex vivo using whole BM cells from 12–to 15-wk-old male mice from Dnmt3a+/+Vav1-Cre (WT), Dnmt3afl/+Vav1-Cre (+/−), and Dnmt3afl/flVav1-Cre (−/−) backgrounds (n = 7). Osteoclast differentiation was performed in the presence of vehicle or LPS (0.1 ng/ml). Statistical significance was determined via two-way ANOVA (P < 0.0001 for genotype-specific effect), and P values were adjusted for multiple comparisons using BY. Error bars represent SEM. (H) BM-sorted 500 CD11b−/lowCD115+Ly6Chi osteoclast precursors differentiated from WT and Dnmt3a−/− BM were quantified via TRAP staining on day 6 of culture. Osteoclast precursors were plated in 10 ng/ml M-CSF and increasing concentrations of RANKL (n = 7), 10 ng/ml RANKL and increasing concentrations of M-CSF (n = 8), or RANKL and M-CSF at 10 ng/ml with increasing concentrations of LPS. Statistical significance was assessed by two-way ANOVA. No significance differences are observed between WT and Dnmt3a−/−. (I) Osteoclast differentiation from 200 WT osteoclast precursors in the Transwell assays in the presence of 20,000 WT or Dnmt3a KO cells in the upper compartment. Osteoclasts are assessed by phalloidin-FITC for F-actin rings. Statistical significance was determined via two-way ANOVA (P < 0.0001 for genotype-specific effect), and P values were adjusted for multiple comparisons using BY. *, P < 0.05; **, P < 0.01; ***, P < 0.001; ****, P < 0.0001. All error bars represent SD unless specified.
Figure 3.
Figure 3.
CRISPR screen and cytokine array reveal increased IL-20 expression. (A) Generation of RAW264.7 Ctsk-T2A-R647 reporter cell line stably expressing SpCas9-P2A-GFP, and analysis of Ctsk expression in the APC channel by flow cytometry on day 5 of osteoclast differentiation. The percentage of the APC+ population is calculated from the total GFP+ population and shown as boxplots. n = 16. (B) CRISPR screen for genes regulating osteoclast differentiation in the Dnmt3a KO Ctsk reporter. sgRNA-targeted genes ranked (x axis) by log2-fold change of read counts (y axis). The top right indicates genes enriched in the population with lower Ctsk reporter expression (bottom APC 5%) over higher Ctsk reporter expression (top APC 5%). These genes potentially enhance or are required for osteoclast differentiation. FDR < 0.05 (red). Cytokine receptors identified in the higher APC-expressing populations (bottom left) are not shown to due to cell fusion occurring during osteoclast differentiation. (C) Cytokine array of Dnmt3a−/− versus WT serum. n = 13–14. Statistical significance via Wilcoxon rank sum test. FDR < 0.05 is denoted by a horizontal dotted line. (D) ELISA quantification of IL-20 from WT or Dnmt3a−/− BMDMs (n = 10) or RAW264.7 cells (n = 12) cultured at a density of 50,000/cm2 for 4 d. Error bars represent SD. *, P < 0.05; ***, P < 0.001.
Figure S2.
Figure S2.
CRISPR screen and identification of IL-20 as a target. (A) Immunoblot confirmation of Dnmt3a KO in the Ctsk-T2A-R647 reporter line expressing Cas9. (B) Experimental schema for the genome-wide CRISPR screen using the Brie library. (C) Normalized read counts for Tnfrsf11a and Il20ra. (D and E) Limited receptor-based screen in Dnmt3a KO (D) or WT (E) in the Ctsk-T2A-R647 reporter line. Red indicates genes with FDR < 0.05. The screen could not be performed with WT cells due to the low rate of baseline differentiation toward osteoclasts in the WT. (F and G) Serum levels of IL-20 (F) and fractalkine (G) in mice transplanted with WT, Dnmt3a KO, and Tet2 KO cells. (H–J) Effect of increasing concentrations of IL-11 (H), Lif (I), or fractalkine (J) on osteoclast differentiation from 200 CD11b−/lowCD115+Ly6Chi osteoclast precursors sorted from the BM of 12-wk-old Dnmt3a KO (n = 11), shown as boxplots. Data are normalized by the number of TRAP+ cells from the control arm. (K and L) ELISA quantification of IL-11 (K) or Lif (L) from unstimulated WT or Dnmt3a KO BMDMs or RAW264.7 cells cultured at a density of 50,000/cm2 for 4 d. n = 8 for BMDMs and n = 12 for RAW264.7 cells. (M) ELISA quantification of IL-1β from WT or Dnmt3a KO BMDMs cultured at a density of 50,000/cm2 for 4 d. A positive control using LPS and uric acid treatment is shown. n = 6–8. (O and P) Il20 expression in the context of Nlrp3fl/flVav1-Cre (referred to as Nlrp3 KO). (N) Il20 expression quantified by quantitative PCR. BMDMs were stimulated with 10 ng/ml LPS for 10 h. n = 4. Error bars represent SEM. (O) ELISA quantification of IL-20 of unstimulated BMDMs cultured for 5 d. n = 4. Error bars represent SD unless otherwise noted. Source data are available for this figure: SourceData FS2.
Figure S3.
Figure S3.
Chromatin analysis and investigation of DNMT3A rs6722613 SNP. (A) RRBS analysis of Dnmt3a−/− and WT BMDMs using cutoffs of FDR < 0.05 and differential methylation >20%. n = 5. Volcano density plot showing changes in CpG methylation (x axis) across all detected CpGs versus statistical significance (y axis). (B) Volcano plot showing changes in CpG methylation (x axis) in the gene body, promoter, and associated 5-kb flanking regions in all cytokine and chemokine ligands with statistical significance (y axis). CpG distribution across regions (right bar graph). (C) Methylation and gene expression changes. For each cytokine or chemokine gene, methylation analysis was performed over all CpGs in the gene body and 1-kb promoter region around transcriptional start sites (TSS). The top panel shows the percentage of significant hypomethylated gene-associated CpGs, the middle panel shows average changes in methylation across all gene-associated CpGs, and the bottom panel shows gene expression changes on mRNA sequencing. Filled bars show significant gene expression changes based on FDR < 0.05 regardless of fold change difference. Of all the cytokines/chemokines, only ones with CpG changes are shown. (D) KEGG pathway analysis for genes within 20 kb of LPS-treated Dnmt3a KO–specific ATAC peaks. This could not be performed for vehicle-treated Dnmt3a KO due to a lack of genes. (E) Venn diagram of peaks specific to LPS-treated Dnmt3a KO or vehicle-treated Dnmt3a, and peaks with genes annotated in Gene Ontology biological process or KEGG pathways are shown. Bold highlighted genes in Dnmt3a KO LPS are genes part of the TNF signaling pathway group in KEGG. P value indicates P value of overlap, as assessed by hypergeometric test. (F) ATAC peaks specific to Dnmt3a KO plus LPS were ranked by fold change relative to WT plus LPS. Peaks with proximal genes (within 20 kb) and log2(fold change [FC]) > 1 were included. Corresponding genes from RNA-seq analysis were included on the right, with significant genes FDR < 0.05 highlighted in red and labeled. (G) ATAC peaks specific to Dnmt3a KO plus vehicle versus WT plus vehicle were ranked in the same order as F. Corresponding genes from RNA-seq analysis were included on the right, with significant genes FDR < 0.05 highlighted in red and labeled. (H and I) ChIP-seq for Irf3 and Rela. (H) Venn diagrams of Irf3 and Rela ChIP-seq peaks with and without LPS administration (10 ng/ml). (I) Peak occupancy plots, sorted by Irf3 occupancy on the left. Rela peaks are displayed in the same order on the right. (J) KEGG pathway enrichment analysis for genes within 10 kb of Dnmt3a KO–specific peaks. Rela binding accounted for all inflammatory signaling pathway enrichment. (K) RNA-seq differential expression analysis of genes identified in J. Genes with FDR < 0.05 are highlighted with an asterisk. (L) ChIP PCR of Irf3 binding in the Il20 locus. n = 4–6. Statistical significance via Wilcoxon rank sum test. Error bars represent SEM. (M) Analysis of rs6722613 SNP across three large population studies. B, β; EA, effect allele; EAF, effect allele frequency; NEA, noneffect allele. *, P < 0.05; ****, P < 0.0001.
Figure 4.
Figure 4.
Dnmt3a-mediated increase in Irf3-Rela binding regulates Il20 expression. (A) RRBS analysis of Dnmt3a−/− and WT BMDMs. n = 5. Heatmap on top reveals CpG regions proportionally affected by hypo- or hypermethylation. Bar graph quantifies change in CpG methylation (y axis) at the defined loci (x axis). To assess statistical significance, one-way ANOVA was used against Dnmt3a ATAC or Dnmt3a ATAC with LPS, and P values were adjusted for multiple comparisons using BY. Error bars represent SD. (B) CpG methylation density plot at the ATAC sites increased in Dnmt3a−/− compared with WT BMDMs in vehicle-treated (top) or LPS-treated (bottom) samples. (C) ATAC-sequencing analysis of Dnmt3a−/− and WT BMDMs. n = 2. (D) TF binding site motif analysis. Statistical significance was assessed using hypergeometric test of overlap using all ATAC sites as the atlas. Log2(FDR) of LPS-treated samples (y axis) is plotted against that of vehicle-treated samples (x axis). (E) ChIP-seq of Irf3 and Rela, an NF-κB subunit. Bar graph of binding sites overlapped with ATAC sites globally. (F) Venn diagram of Irf3 and Rela-specific peaks and their overlap. Significance of overlap was assessed by a hypergeometric test. (G) Irf3 and Rela binding at the open chromatin regions in the Il20 locus. Shaded areas represent significant TF peaks detected. n = 3. Read densities are normalized to a million reads. (H) Il20 expression in RAW264.7 cells with Dnmt3a−/−, Irf3−/−, or both assessed 2 d after LPS treatment (10 ng/ml). n = 4. One-way ANOVA was used, and P values were adjusted for multiple comparisons using BY. *, P < 0.05; ****, P < 0.0001.
Figure 5.
Figure 5.
IL-20 regulates Dnmt3a-mediated osteoclastogenesis. (A) Effect of increasing concentrations of IL-20 on osteoclast differentiation from 200 CD11b−/lowCD115+Ly6Chi osteoclast precursors sorted from the BM of 12-wk-old Dnmt3a−/− mice, shown as boxplots. n = 11. (B) Co-culture experiments of 200 CD11b−/lowCD115+Ly6Chi osteoclast precursors from WT or Dnmt3a−/− mice and 2,000 BMDMs from respective sources in the presence of IL-20 neutralizing antibody 7E or isotype IgG during osteoclast differentiation. Boxplot representation of TRAP+ cells at day 6 of differentiation. n = 8. (C) Expression of the Ctsk reporter (APC+) as a percentage of GFP+ cells using Ctsk-T2A-R647 reporter cell line expressing Cas9-GFP in the presence WT or Dnmt3a−/−, and IL-20 neutralizing antibody 7E or isotype antibody during osteoclast differentiation. n = 8. (D) WT or Dnmt3a−/− BM transplants into WT male mice treated with isotype antibody or IL-20 neutralizing antibody 7E at a dose of 6 μg/kg every 3 d intraperitoneally starting at 8 wk after transplantation for 4 wk. Serum was collected at 12 wk and analyzed for CTX-I, a marker of bone resorption. Statistical significance via Wilcoxon rank sum test and adjusted by FDR. n = 7–14. For A–C, one-way ANOVA was used, and P values were adjusted for multiple comparisons using BY. *, P < 0.05; **, P < 0.01. Error bars otherwise note SD.

Comment in

  • Bone marrow runs the (bone) show.
    Karsenty G. Karsenty G. J Exp Med. 2021 Dec 6;218(12):e20211996. doi: 10.1084/jem.20211996. Epub 2021 Oct 27. J Exp Med. 2021. PMID: 34705037 Free PMC article.
  • Somatic mutations linked to osteoporosis.
    Clarke J. Clarke J. Nat Rev Rheumatol. 2022 Jan;18(1):4. doi: 10.1038/s41584-021-00727-7. Nat Rev Rheumatol. 2022. PMID: 34837067 No abstract available.

References

    1. Akalin, A., Kormaksson M., Li S., Garrett-Bakelman F.E., Figueroa M.E., Melnick A., and Mason C.E.. 2012. methylKit: a comprehensive R package for the analysis of genome-wide DNA methylation profiles. Genome Biol. 13:R87. 10.1186/gb-2012-13-10-r87 - DOI - PMC - PubMed
    1. Ambrosi, T.H., Scialdone A., Graja A., Gohlke S., Jank A.M., Bocian C., Woelk L., Fan H., Logan D.W., Schürmann A., et al. . 2017. Adipocyte Accumulation in the Bone Marrow during Obesity and Aging Impairs Stem Cell-Based Hematopoietic and Bone Regeneration. Cell Stem Cell. 20:771–784.e6. 10.1016/j.stem.2017.02.009 - DOI - PMC - PubMed
    1. Benjamin, D., Sato T., Cibulskis K., Getz G., Stewart C., and Lichtenstein L.. 2019. Calling Somatic SNVs and Indels with Mutect2. bioRxiv. 10.1101/861054 (Preprint posted December 2, 2019) - DOI
    1. Bieghs, V., Van Gorp P.J., Wouters K., Hendrikx T., Gijbels M.J., van Bilsen M., Bakker J., Binder C.J., Lütjohann D., Staels B., et al. . 2012. LDL receptor knock-out mice are a physiological model particularly vulnerable to study the onset of inflammation in non-alcoholic fatty liver disease. PLoS One. 7:e30668. 10.1371/journal.pone.0030668 - DOI - PMC - PubMed
    1. Blumberg, H., Conklin D., Xu W.F., Grossmann A., Brender T., Carollo S., Eagan M., Foster D., Haldeman B.A., Hammond A., et al. . 2001. Interleukin 20: discovery, receptor identification, and role in epidermal function. Cell. 104:9–19. 10.1016/S0092-8674(01)00187-8 - DOI - PubMed

Publication types

MeSH terms