. 2021 Oct 5;21(11):19.
doi: 10.1167/jov.21.11.19.

Neural correlates of intra-saccadic motion perception

Affiliations

Neural correlates of intra-saccadic motion perception

Gaëlle Nicolas et al. J Vis. .

Abstract

Retinal motion of the visual scene is not consciously perceived during ocular saccades in normal everyday conditions. It has been suggested that extra-retinal signals actively suppress intra-saccadic motion perception to preserve stable perception of the visual world. However, using stimuli optimized to preferentially activate the M-pathway, Castet and Masson (2000) demonstrated that motion can be perceived during a saccade. Based on this psychophysical paradigm, we used electroencephalography and eye-tracking recordings to investigate the neural correlates related to the conscious perception of intra-saccadic motion. We demonstrated the effective involvement during saccades of the cortical areas V1-V2 and MT-V5, which convey motion information along the M-pathway. We also showed that individual motion perception was related to retinal temporal frequency.


Figures

Figure 1.
Figure 1.
Illustration of visual stimulation during one trial. (a) Representation of the evolution over time of the contrast of the stimulus, from 0% to 17%, (b) layouts over time in the stimulus condition. During the gaze stabilization periods (T0tT2) and (T4tT5), the layout was a red cross and a plain green circle on a grey background. At time T2, the red cross changed into a plain red circle, which was the visual cue to execute the saccade. Between times T2 and T4, the layout consisted of two plain circles with the stimulus moving from left to right (black arrow), (c) illustration of gaze during the trial. First, the eyes were fixed on the red cross (T0tT2), then the visual cue appeared and a saccade was executed from the plain red circle towards the plain green circle (T2tT4. Perception of motion occurred during this period (T2tT4). Finally, the eyes were fixed on the plain green circle (T4tT5).
Figure 2.
Figure 2.
Illustration of the relationships between the saccade size and the probability function through the peak velocity and the retinal temporal frequency: probability related to the retinal temporal frequency (top right quadrant), itself related to the peak velocity (bottom right quadrant), itself related to the saccade size (bottom left quadrant). The probability of motion perception related to the peak velocity is sketched (top right quadrant, in blue) from the results obtained by Castet and Masson (2000; Figure 2). The saccade size, peak velocity, and retinal temporal frequency eliciting a probability of the stimulus-strong category at chance level are denoted by ζS0.5, ζV0.5, and ζF0.5, respectively. See the text for further explanation of the graphical construction.
Figure 3.
Figure 3.
Representation of the three parameters for one subject (S05): (a) for all trials, saccade size as a function of target eccentricity, (b) for all trials, the peak velocity of the saccade as a function of saccade size, and its exponential fitting, (c) same as in b but only for trials in the stimulus condition, with in red, the “strong” response and in green the weak/null response (d) only for trials in the stimulus condition, the probability of the stimulus-strong category as a function of peak velocity. The open circles denote data pooled by bin.
Figure 4.
Figure 4.
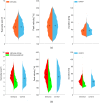
Distributions of the three saccade features, from left to right, size [°], peak velocity [°/s] and duration [ms], (a) by condition (stimulus versus control), (b) by condition and by motion perception (stimulus-strong in red, stimulus-weak/null in green, and control in blue). The mean of each distribution is marked by a cross.
Figure 5.
Figure 5.
(a) Exponential fitting of the average (grey envelop: ± standard error) peak velocity of saccades as a function of saccade size, (b) the probability of the stimulus-strong category. Based on individual means, the retinal temporal frequency ζF0.5 eliciting a probability of the stimulus-strong category at chance level, corresponds to peak velocity ζV0.5 and to saccade size ζS0.5. These values are shown in red (± standard error).
Figure 6.
Figure 6.
Representation of the two ROIs from the Destrieux Atlas on the left hemisphere of the brain. In purple, the MT-V5 ROI (no. 59) and in red the V1-V2 ROI (no. 42) The surface of the brain was reconstructed and smoothed at 50%.
Figure 7.
Figure 7.
For participants S03 (yellow) and S12 (purple), comparison with average behavior, (a) average value (grey envelop: ± standard error) of the exponential fitting of the peak velocity of the saccades as a function of saccade size, (b) the probability of the stimulus-strong category. The threshold ξf = 20.4 Hz and its corresponding peak velocity ξv = 240 degrees/s are depicted by the dotted line. The open circles denote data pooled by bin for these two specific datasets.
Figure 8.
Figure 8.
For the epochs selected for evoked potential estimation, distributions of the three saccade features with a peak velocity higher than ξv = 240 degrees/s (or equivalently with a retinal temporal frequency lower than ξf = 20.4 Hz in the stimulus-strong category). From left to right, size [°], peak velocity [°/s] and duration [ms]. The mean of each distribution is marked by a cross.
Figure 9.
Figure 9.
Illustration of the grand-average of the evoked potential at main saccade onset in each ROI, (a) V1-V2, (b) MT-V5. The solid line represents the average of the evoked potential and the transparent area represents the intersubject standard error at each time sample. The predefined latency windows in each ROI are represented in grey.

References

    1. Bair, W., & O'Keefe, L. P. (1998). The influence of fixational eye movements on the response of neurons in area MT of the macaque. Visual Neuroscience, 15(4), 779–786. - PubMed
    1. Bahill, A. T., Clark, M. R., & Stark, L. (1975). The main sequence, a tool for studying human eye movements. Mathematical Biosciences , 24(3-4), 191–204.
    1. Baloh, R. W., Sills, A. W., Kumley, W. E., & Honrubia, V. (1975). Quantitative measurement of saccade amplitude, duration, and velocity. Neurology , 25(11), 1065–1065. - PubMed
    1. Barlow, J. S., & Cigánek, L. (1969). Lambda responses in relation to visual evoked responses in man. Electroencephalography and Clinical Neurophysiology , 26(2), 183–192. - PubMed
    1. Bell, A. J., & Sejnowski, T. J. (1995). An information-maximisation approach to blind separation and blind deconvolution. Neural Computation , 7(6), 1129–1159. - PubMed

Publication types