. 2022 Jan 1;163(1):bqab222.
doi: 10.1210/endocr/bqab222.

Impact of Hydrocortisone and of CRH Infusion on the Hypothalamus-Pituitary-Adrenocortical Axis of Septic Male Mice

Affiliations

Impact of Hydrocortisone and of CRH Infusion on the Hypothalamus-Pituitary-Adrenocortical Axis of Septic Male Mice

Arno Téblick et al. Endocrinology. .

Abstract

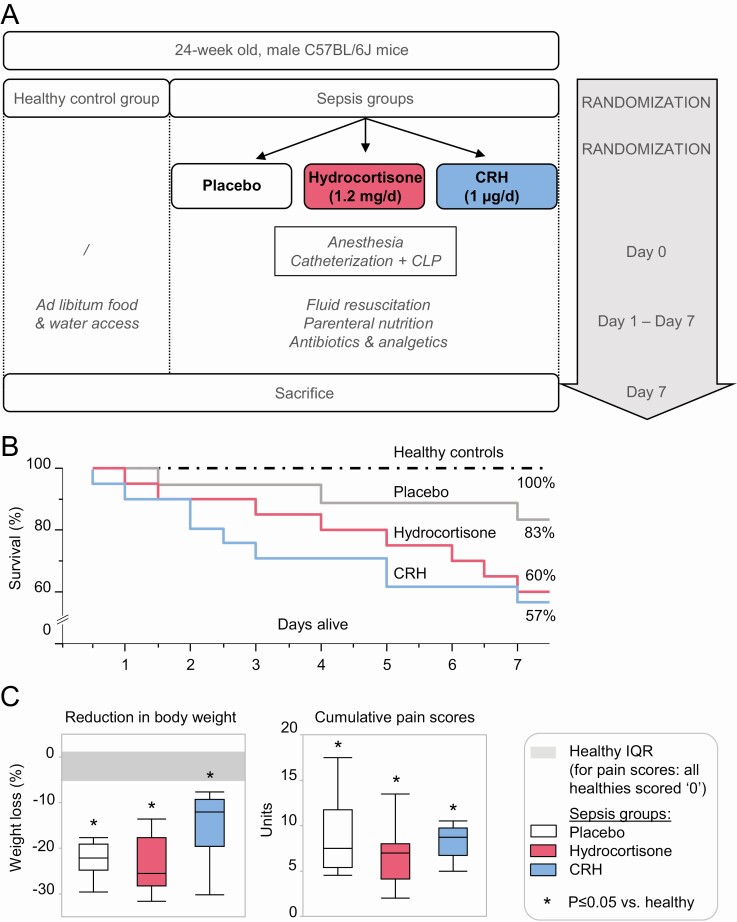
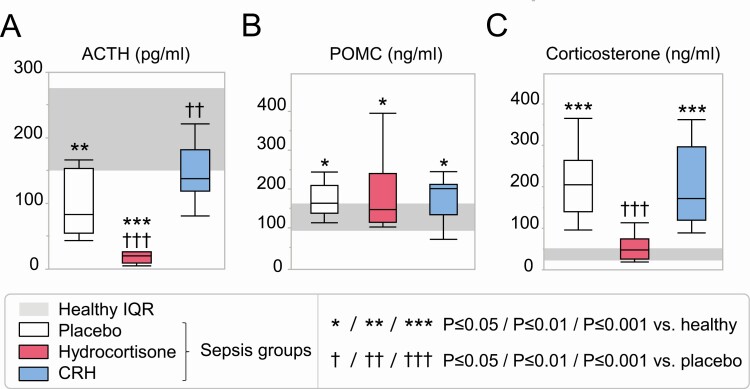
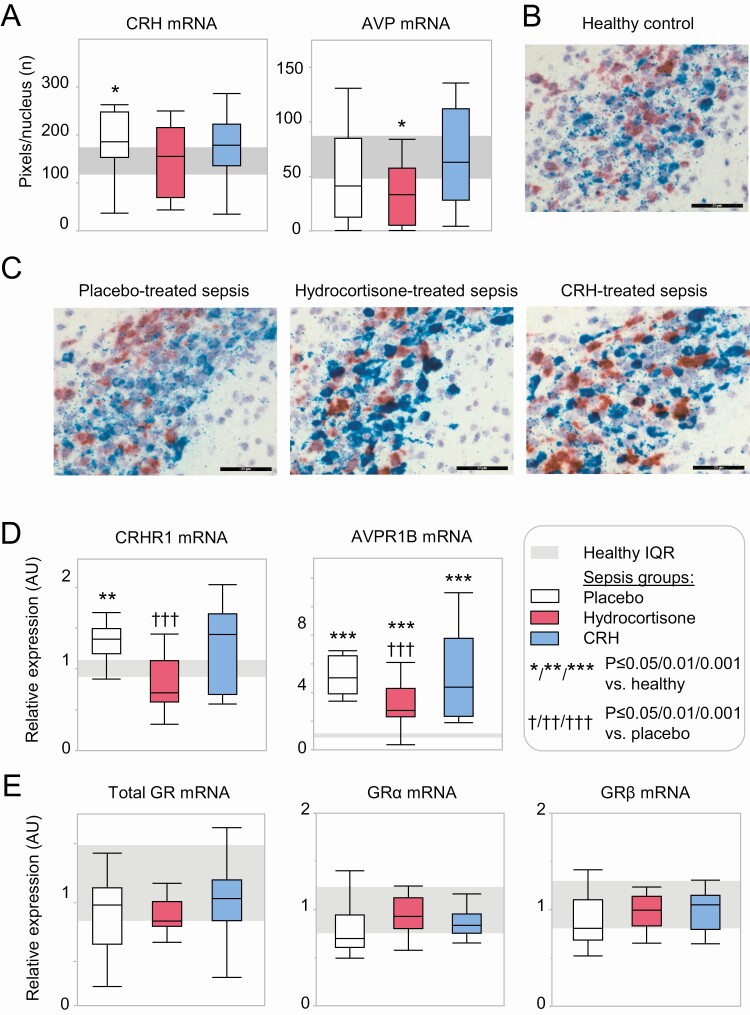
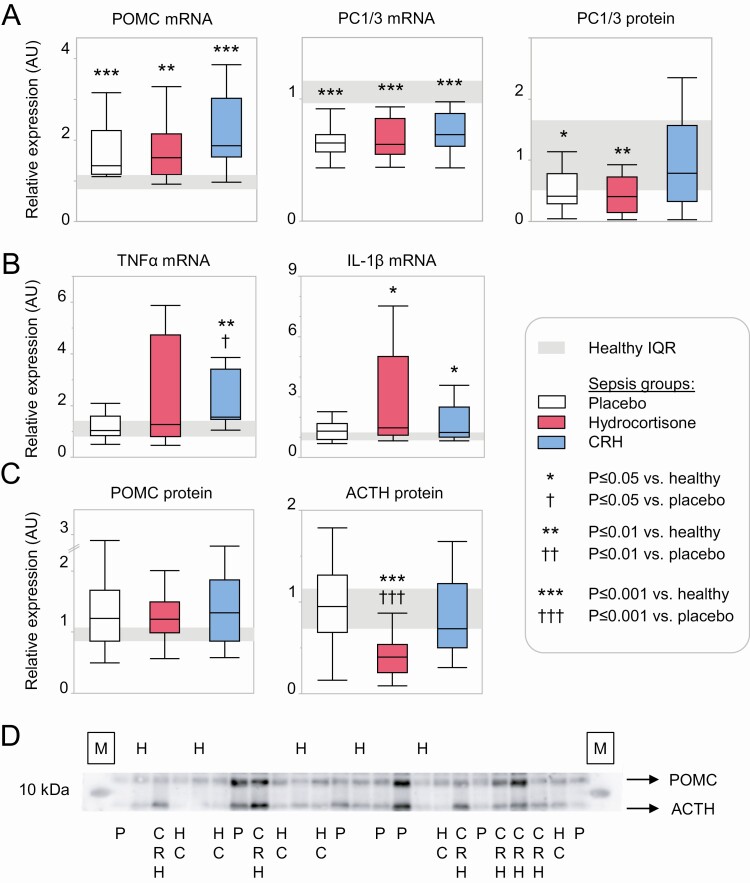
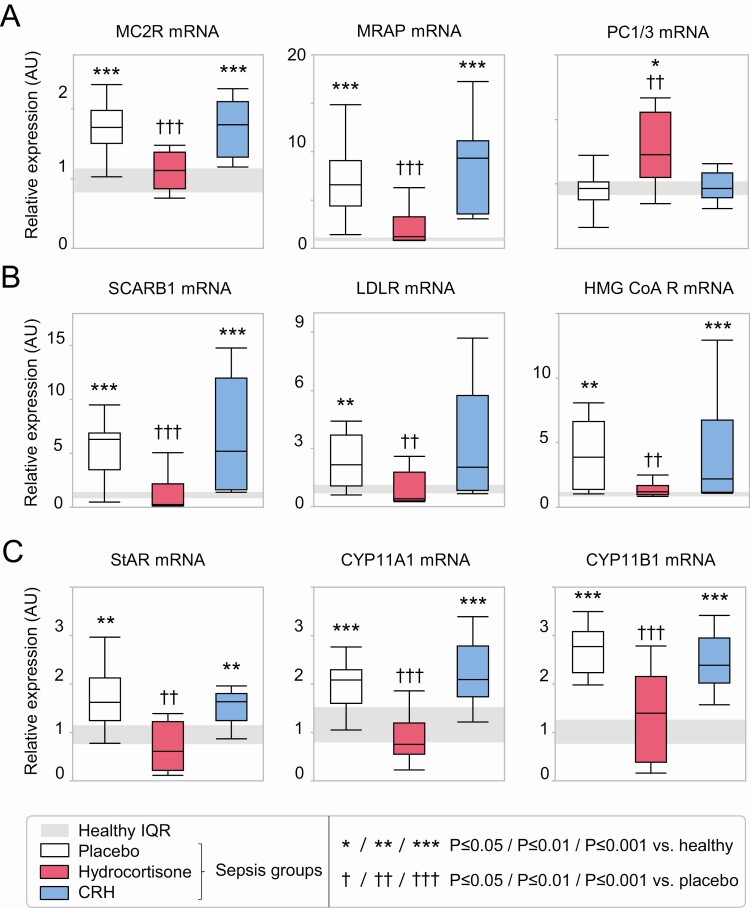
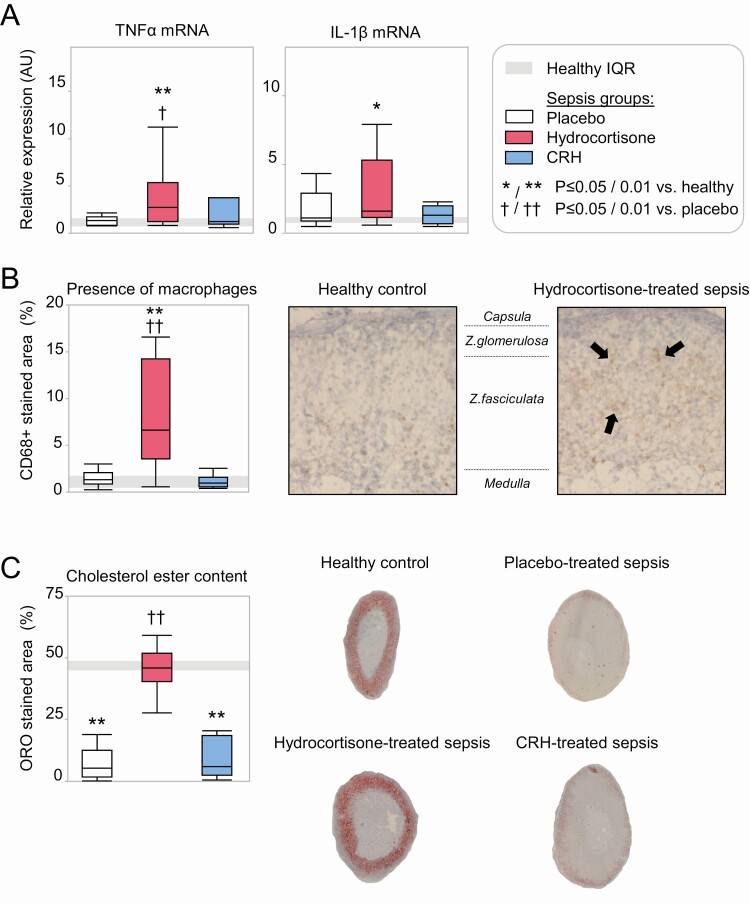
Purpose: Sepsis is hallmarked by high plasma cortisol/corticosterone (CORT), low adrenocorticotropic hormone (ACTH), and high pro-opiomelanocortin (POMC). While corticotropin-releasing hormone-(CRH) and arginine-vasopressin (AVP)-driven pituitary POMC expression remains active, POMC processing into ACTH becomes impaired. Low ACTH is accompanied by loss of adrenocortical structure, although steroidogenic enzymes remain expressed. We hypothesized that treatment of sepsis with hydrocortisone (HC) aggravates this phenotype whereas CRH infusion safeguards ACTH-driven adrenocortical structure.

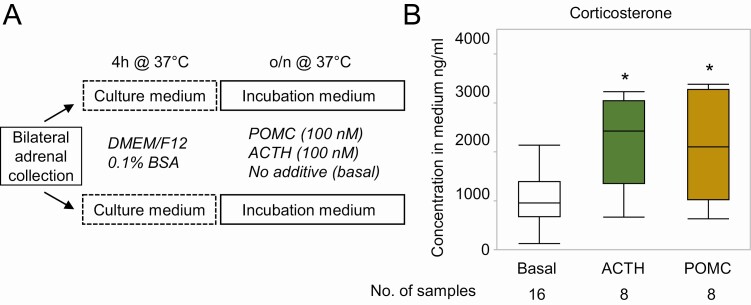
Methods: In a fluid-resuscitated, antibiotics-treated mouse model of prolonged sepsis, we compared the effects of HC and CRH infusion with placebo on plasma ACTH, POMC, and CORT; on markers of hypothalamic CRH and AVP signaling and pituitary POMC processing; and on the adrenocortical structure and markers of steroidogenesis. In adrenal explants, we studied the steroidogenic capacity of POMC.

Results: During sepsis, HC further suppressed plasma ACTH, but not POMC, predominantly by suppressing sepsis-activated CRH/AVP-signaling pathways. In contrast, in CRH-treated sepsis, plasma ACTH was normalized following restoration of pituitary POMC processing. The sepsis-induced rise in markers of adrenocortical steroidogenesis was unaltered by CRH and suppressed partially by HC, which also increased adrenal markers of inflammation. Ex vivo stimulation of adrenal explants with POMC increased CORT as effectively as an equimolar dose of ACTH.

Conclusions: Treatment of sepsis with HC impaired integrity and function of the hypothalamic-pituitary-adrenal axis at the level of the pituitary and the adrenal cortex while CRH restored pituitary POMC processing without affecting the adrenal cortex. Sepsis-induced high-circulating POMC may be responsible for ongoing adrenocortical steroidogenesis despite low ACTH.

Keywords: ACTH; CRH; HPA axis; POMC; hydrocortisone; sepsis.


Figures

Figure 1.
Figure 1.
Design, survival, behavior, and pain scores in the mouse study. (A) Study design and timeline of the animal study. (B) Cumulative survival up to 7 days (study period) of healthy controls, placebo-treated septic animals, hydrocortisone (HC)-treated septic animals, and corticotropin-releasing hormone (CRH)-treated septic animals. (C) Reduction in body weight and cumulative pain scores. Box-and-whiskers represent median, interquartile range (IQR) and the furthest points within 1.5 times the IQR. Gray area represents IQR of healthy controls. *Indicates significance between the respective sepsis group and healthy controls (P ≤ 0.05). Number of samples per group for reduction in body weight and cumulative pain scores: healthy controls n = 11; placebo-treated sepsis n = 14; HC-treated sepsis n = 12; CRH-treated sepsis n = 11. Statistical tests used: Mann-Whitney U for all pairwise comparisons. Abbreviation: CLP, cecal ligation and puncture.
Figure 2.
Figure 2.
Plasma concentrations of hypothalamic-pituitary-adrenal axis related hormones during placebo-, hydrocortisone-, and corticotropin-releasing hormone (CRH)-treated sepsis-induced critical illness. (A) Plasma adrenocorticotropic hormone concentrations. (B) Plasma pro-opiomelanocortin concentrations. (C) Plasma cortisol/corticosterone concentrations. Box-and-whiskers represent median, interquartile range (IQR) and the furthest points within 1.5 times the IQR. Gray area represents IQR of healthy controls. *, **, *** indicate significance between the respective sepsis group and healthy controls (P ≤ 0.05, P ≤ 0.01, P ≤ 0.001, respectively). †, ††, ††† indicates significance between the respective sepsis group and the placebo-treated sepsis group (P ≤ 0.05, P ≤ 0.01, P ≤ 0.001, respectively). Number of samples per group: healthy controls n = 11; placebo-treated sepsis n = 14; hydrocortisone-treated sepsis n = 12; CRH-treated sepsis n = 11. Statistical tests used: Mann-Whitney U for all pairwise comparisons.
Figure 3.
Figure 3.
Expression of the hypothalamic-pituitary receptors and regulators of pro-opiomelanocortin expression and processing into adrenocorticotropic hormone. (A) Gene expression of the hypophysiotropic corticotropin-releasing hormone (CRH; left panel) and arginine-vasopressin (AVP; right panel) within the paraventricular nucleus (PVN) of the hypothalamus. (B-C) Representative partial images for each group of an anti-CRH (blue channel) and anti-AVP (red channel) stained image of the PVN at 400× magnification. Quantification and analysis were performed on the whole hypothalamic paraventricular nucleus. Black scale bar is 50 µm. (D) Pituitary gene expression of the main positive (CRHR1 and AVPR1B) and (E) negative [total glucocorticoid receptor (GR), GRα isoform and GRβ isoform] signaling receptors mediating pituitary synthesis and secretion of adrenocorticotropic hormone. Box-and-whiskers represent median, interquartile range (IQR) and the furthest points within 1.5 times the IQR. Gray area represents IQR of healthy controls. *, **, *** indicates significance between the respective sepsis group and healthy controls (P ≤ 0.05, P ≤ 0.01, P ≤ 0.001, respectively). †, ††, ††† indicates significance between the respective sepsis group and the placebo-treated sepsis group (P ≤ 0.05, P ≤ 0.01, P ≤ 0.001). Number of samples per group: healthy controls n = 11; placebo-treated sepsis n = 14; hydrocortisone-treated sepsis n = 12; CRH-treated sepsis n = 11. Statistical tests used: Mann-Whitney U for all pairwise comparisons. Abbreviation: AU, arbitrary units.
Figure 4.
Figure 4.
Pituitary expression of pro-opiomelanocortin (POMC) and adrenocorticotropic hormone (ACTH). (A) Pituitary gene expression of the ACTH-precursor POMC and gene and protein expression of the main POMC-processing-enzyme PC1/3. (B) Pituitary gene expression of inflammatory markers tumor necrosis factor alpha and interleukin 1 beta. (C) Pituitary protein content of POMC and ACTH. (D) Representative image of Western blot analysis of pituitary POMC (31 kDa) and ACTH (4.5 kDa) protein content (1 of 2 gels). Box-and-whiskers represent median, interquartile range (IQR), and the furthest points within 1.5 times the IQR. *, **, *** indicates significance between the respective sepsis group and healthy controls (P ≤ 0.05, P ≤ 0.01, P ≤ 0.001, respectively). †, ††, ††† indicates significance between the respective sepsis group and the placebo-treated sepsis group (P ≤ 0.05, P ≤ 0.01, P ≤ 0.001, respectively). Number of samples per group: healthy controls n = 11; placebo-treated sepsis n = 14; hydrocortisone-treated sepsis n = 12; corticotropin-releasing hormone-treated sepsis n = 11. Statistical tests used: Mann-Whitney U for all pairwise comparisons. Abbreviations: AU, arbitrary units; CRH, corticotropin-releasing hormone-treated sepsis; H, healthy controls; HC, hydrocortisone-treated sepsis; M, marker; P, placebo-treated sepsis.
Figure 5.
Figure 5.
Adrenal expression of key mediators of adrenocortical steroidogenesis. (A) Gene expression of the receptor mediating positive adrenocorticotropic hormone signaling, melanocortin receptor 2 and the associated protein), and PC1/3. (B) Gene expression of receptors (SCARB1 and LDLR) and enzymes (3-hydroxy-3-methylglutaryl coenzyme A reductase) involved in intracellular cholesterol availability. (C) Gene expression of enzymes involved in mitochondrial cortisol/corticosterone synthesis (steroidogenic acute regulatory protein, CYP11A1, and CYP11B1). Box-and-whiskers represent median, interquartile range (IQR), and the furthest points within 1.5 times the IQR. Gray area represents IQR of healthy controls. *, **, *** indicates significance between the respective sepsis group and healthy controls (P ≤ 0.05, P ≤ 0.01, P ≤ 0.001, respectively). †, ††, ††† indicates significance between the respective sepsis group and the placebo-treated sepsis group (P ≤ 0.05, P ≤ 0.01, P ≤ 0.001, respectively). Number of samples per group: healthy controls n = 11; placebo-treated sepsis n = 14; hydrocortisone-treated sepsis n = 11; corticotropin-releasing hormone-treated sepsis n = 11. Statistical tests used: Mann-Whitney U for all pairwise comparisons. Abbreviation: AU, arbitrary units.
Figure 6.
Figure 6.
Inflammation and cholesterol ester storage in the adrenal gland. (A) Gene expression of inflammatory markers tumor necrosis factor alpha and interleukin 1 beta. Box-and-whiskers represent median, interquartile range (IQR), and the furthest points within 1.5 times the IQR. Gray area represents IQR of healthy controls (B) Presence of macrophages within the adrenal cortex. Left panel show box-and-whiskers representing the median, IQR, and the furthest points within 1.5 times the IQR of CD68+ stained area of each sepsis group, relative to the total adrenal cortex. Middle and right panels show representatives images of a healthy controls and hydrocortisone (HC)-treated septic mice, respectively. Arrows point out clustering of CD68+ staining within the adrenal cortex, more specifically within the zona fasciculata (C) Cholesterol ester storage. Box-and-whiskers show the median, IQR, and the furthest points within 1.5 times the IQR of Oil-Red-O–stained area of each sepsis group, relative to the total adrenal gland. Middle and right panels show representatives images of each group (healthy controls, placebo-, HC-, and corticotropin-releasing hormone-treated sepsis). *, ** indicates significance between the respective sepsis group and healthy controls (P ≤ 0.05, P ≤ 0.01, respectively). †, †† indicates significance between the respective sepsis group and the placebo-treated sepsis group (P ≤ 0.05, P ≤ 0.01, respectively). Number of samples per group: healthy controls n = 10; placebo-treated sepsis n = 14; HC-treated sepsis n = 11; corticotropin-releasing hormone-treated sepsis n = 11. Statistical tests used: Mann-Whitney U for all pairwise comparisons. Abbreviations: AU, arbitrary units; ORO, Oil-Red-O.
Figure 7.
Figure 7.
Adrenocortical steroidogenic capacity of pro-opiomelanocortin (POMC) in comparison with adrenocorticotropic hormone (ACTH) and no additive. (A) Design of the ex vivo adrenal explant study. (B) Cortisol/corticosterone concentration in the incubation medium after overnight stimulation with no additive, ACTH or POMC. Box-and-whiskers represent median, interquartile range (IQR), and the furthest points within 1.5 times the IQR. *Indicates significance between the respective stimulated group and the basal group (no additive; P ≤ 0.05). Abbreviations: BSA, bovine serum albumin; DMEM/F12, Dulbecco’s Modified Eagle Medium/Nutrient Mixture F-12.

Comment in

Similar articles

Cited by

References

    1. Singer M, Deutschman CS, Seymour CW, et al. . The third international consensus definitions for sepsis and septic shock (sepsis-3). JAMA. 2016;315(8):801-810. - PMC - PubMed
    1. Fleischmann C, Scherag A, Adhikari NK, et al. ; International Forum of Acute Care Trialists . Assessment of global incidence and mortality of hospital-treated sepsis. current estimates and limitations. Am J Respir Crit Care Med. 2016;193(3):259-272. - PubMed
    1. Téblick A, Peeters B, Langouche L, Van den Berghe G. Adrenal function and dysfunction in critically ill patients. Nat Rev Endocrinol. 2019;15(7):417-427. - PubMed
    1. Boonen E, Vervenne H, Meersseman P, et al. . Reduced cortisol metabolism during critical illness. N Engl J Med. 2013;368(16):1477-1488. - PMC - PubMed
    1. Peeters B, Meersseman P, Vander Perre S, et al. . Adrenocortical function during prolonged critical illness and beyond: a prospective observational study. Intensive Care Med. 2018;44(10):1720-1729. - PMC - PubMed

Publication types

MeSH terms