. 2021 Dec 8;6(23):e150059.
doi: 10.1172/jci.insight.150059.

GATA4 induces liver fibrosis regression by deactivating hepatic stellate cells

Affiliations

GATA4 induces liver fibrosis regression by deactivating hepatic stellate cells

Noelia Arroyo et al. JCI Insight. .

Abstract

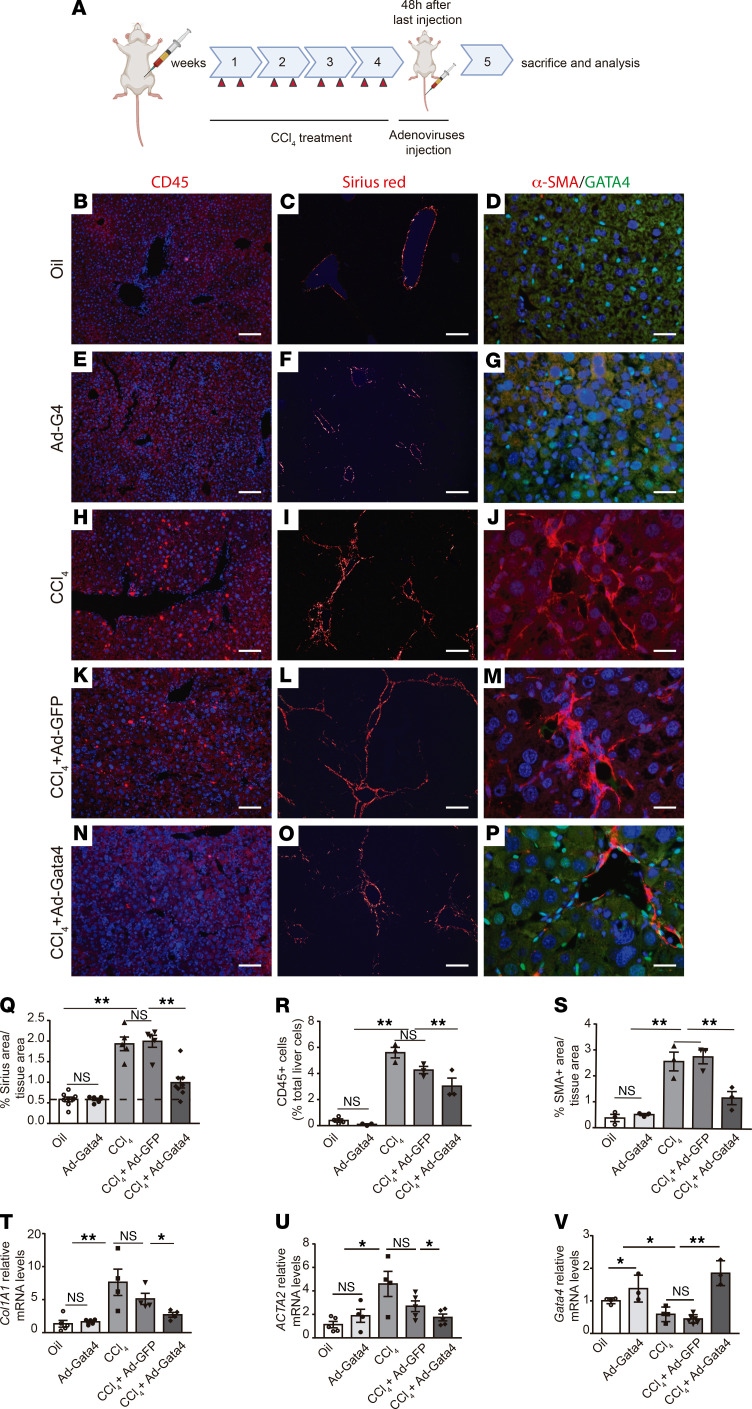
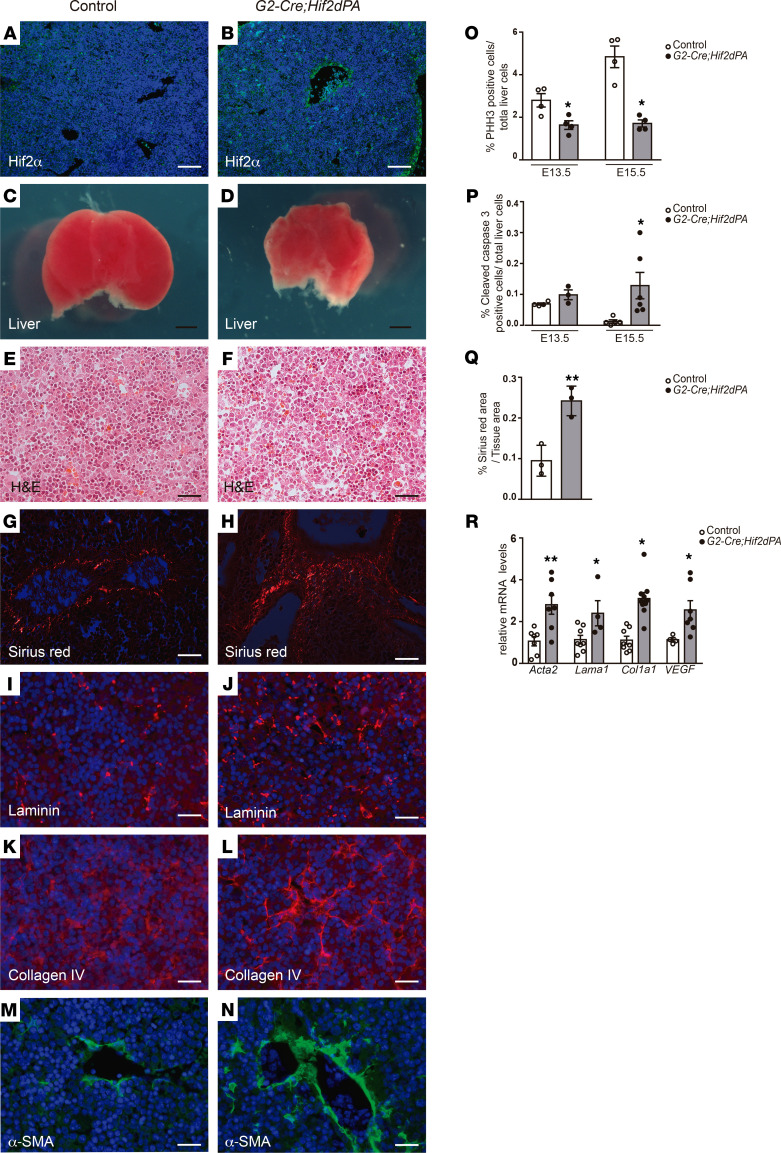
In response to liver injury, hepatic stellate cells activate and acquire proliferative and contractile features. The regression of liver fibrosis appears to involve the clearance of activated hepatic stellate cells, either by apoptosis or by reversion toward a quiescent-like state, a process called deactivation. Thus, deactivation of active hepatic stellate cells has emerged as a novel and promising therapeutic approach for liver fibrosis. However, our knowledge of the master regulators involved in the deactivation and/or activation of fibrotic hepatic stellate cells is still limited. The transcription factor GATA4 has been previously shown to play an important role in embryonic hepatic stellate cell quiescence. In this work, we show that lack of GATA4 in adult mice caused hepatic stellate cell activation and, consequently, liver fibrosis. During regression of liver fibrosis, Gata4 was reexpressed in deactivated hepatic stellate cells. Overexpression of Gata4 in hepatic stellate cells promoted liver fibrosis regression in CCl4-treated mice. GATA4 induced changes in the expression of fibrogenic and antifibrogenic genes, promoting hepatic stellate cell deactivation. Finally, we show that GATA4 directly repressed EPAS1 transcription in hepatic stellate cells and that stabilization of the HIF2α protein in hepatic stellate cells leads to liver fibrosis.

Keywords: Cell Biology; Fibrosis; Gastroenterology; Mouse models.


Figures

Figure 1
Figure 1. Gata4 inactivation induces liver fibrosis in adult stages.
(A) Quantitative RT-PCR analysis of Gata4 expression in livers of adult Gata4-floxed mice injected with GFP-expressing (Ad-GFP) or Cre-expressing adenoviruses (Ad-Cre) (Ad-GFP n = 3; Ad-Cre = 10). (B) Quantification of Sirius red–stained area per total liver area in Ad-GFP– and Ad-Cre–injected mice (n = 3, Ad-GFP; n = 4, Ad-Cre). Polarized light microscopy images of Sirius red–stained liver sections from Gata4-floxed mice treated with (C) Ad-GFP and (D) Ad-Cre adenoviruses. (E) Quantification of the liver area immunostained for the ECM protein laminin in Ad-GFP– and Ad-Cre–injected mice (n = 3 each group). Increased accumulation of the ECM protein laminin in the liver of (F) Ad-GFP– and (G) Ad-Cre–injected mice (n = 3, Ad-GFP; n = 4, Ad-Cre). (H) Quantification of the liver area immunostained for α-smooth muscle actin (SMA) in Ad-GFP– and Ad-Cre–injected mice (n = 3 each group). Activation of HSCs, marked by α-smooth muscle actin is observed in (J) Gata4-floxed mice treated with Ad-Cre adenoviruses compared with (I) Gata4-floxed mice treated with Ad-GFP adenoviruses. Quantitative RT-PCR analysis of (K) Col1A1 and (L) Acta2, Timp1, TgfβR1, and Stat1 expression in livers of Ad-GFP– and Ad-Cre–injected mice (n = 3–5, Ad-GFP; n = 5–6, Ad-Cre). Scale bars: 100 μm (C and D); 25 μm (F, G, I, and J). Statistical analyses was performed using 2-tailed Student’s test. Error bars represent mean ± SEM. *P < 0.05, **P < 0.01.
Figure 2
Figure 2. Lineage tracing of G2-Cre–derived cells and Gata4 expression during adult liver fibrosis and recovery.
(AO) Liver sections of G2-Cre;Rosa26ReYFP adult mice. Immunostaining for (A, F, and K) YFP and (B, G, and L) GATA4 in liver sections of mice treated with vehicle (oil) (A and B) and CCl4 for 4 weeks (F and G) and 1 month after CCL4 treatment (recovery phase) (K and L). (C, H, and M) Merged images of YFP, GATA4, and DAPI staining. Polarized light microscopy images of Sirius red–stained liver sections of (D) mice treated with oil, (I) mice treated with CCl4, and (N) mice 1 month after recovery. (AL, n = 3 each group). Immunostaining for collagen IV in liver sections of (E) mice treated with oil, (J) mice treated with CCl4, and (O) mice 1 month after recovery. (P) Quantification of double GATA4/YFP-positive cells per total GATA-positive cells in livers of each experimental group (n = 3–5 each group). (Q) Relative quantification of Sirius red–stained area per total liver area in each experimental group (n = 3–4 each group). (R) Relative quantification of collagen IV–stained area per total liver area in each experimental group (n = 3 each group). The no injury group denotes mice not injected with adenovirus or CCL4. Quantitative RT-PCR analysis of (S) Gata4, (T) Col1A1, and (U) α-Sma expression in each experimental group (n = 3–5 each group). (V) Western blot analysis of GATA4, collagen IV, and α-SMA accumulation in livers of mice treated with oil, mice treated with CCl4, and mice 1 month after recovery. β-Actin protein or GAPDH was used for loading control. Samples from 3 independent mice in each experimental group are shown. Scale bars: 25 μm (AC, FH, KM, E, J, and O); 100 μm (D, I, and N). Statistical analyses was performed using 1-way ANOVA. Error bars represent mean ± SEM.*P < 0.05. **P < 0.01.
Figure 3
Figure 3. GATA4 promotes the regression of liver fibrosis regression.
(A) Schematic of the experimental design. To induce liver fibrosis, CCl4 was administered to adult wild-type C57BL/6 mice for 4 weeks. Two days after the last CCl4 injection, mice were infected with GFP-expressing (Ad-GFP) and Gata4-overexpressing (Ad-Gata4) adenoviruses via the tail vein. Liver tissue is analyzed 1 week after adenovirus infection. Wild-type C57BL/6 mice treated with CCL4 showed an increase in inflammatory cells, (H) marked by CD45 immunostaining, (I) accumulation of collagen fibers marked with Sirius red staining, and (J) activation of HSCs, marked by α-SMA accumulation, compared with control mice treated with vehicle (oil) (B, C, and D, respectively). Infection of Ad-GATA4 adenoviruses in wild-type untreated C57BL/6 mice did not effect (E) CD45 cell numbers, (F) collagen accumulation, and (G) α-SMA accumulation. Increased numbers of CD45-positive cells, α-SMA expression in HSCs and collagen accumulation were observed in CCl4-treated mice followed by administration of Ad-GFP adenoviruses (KM and QU). A remarkable decrease in (N) the number of inflammatory cells, (O) collagen accumulation, and (P) HSC activation was observed after administration of Ad-GATA4 adenoviruses to CCl4-treated mice compared with CCl4-treated mice infected with Ad-GFP adenoviruses (K, L, and M, respectively). (Q) Relative quantification of Sirius red–stained area per total liver area in each experimental group (n = 5–8). (R) Quantification of CD45-positive cells per total liver cells in each experimental group (n = 3 each group). (S) Relative quantification of α-SMA–positive area per total liver area in each experimental group (n = 3 each group). Quantitative RT-PCR analysis of (T) Col1A1 (n = 4–5 each group), (U) α-Sma (n = 4–5 each group), and (V) Gata4 (n = 3–5 each group) expression in each experimental group. Scale bars: 100 μm (B, C, E, F, H, I, K, L, N, and O); 25 μm (D, G, J, M, and P). Statistical analyses was performed using 1-way ANOVA. Error bars represent mean ± SEM. *P < 0.05, **P < 0.01.
Figure 4
Figure 4. GATA4 regulates the expression of fibrogenic and antifibrogenic genes in HSCs.
Immunofluorescence analyses of laminin and GATA4 accumulation in LX2 cells transfected with (A) GFP-expressing (Ad-GFP) (multiplicity of infection [MOI], = 100) and GATA4-expressing (Ad-GATA4) adenovirus at (B) MOI = 50 and (C) MOI = 100. (D) Heatmap showing the most differentially expressed genes in Ad-GATA4–transfected LX2 cells compared with LX2 cells transfected with Ad-GFP. Validation by quantitative RT-PCR analysis of differentially (E) fibrogenic (n = 3–6) and (F) antifibrogenic (n = 3–6) expressed genes (Ad-GATA4 vs. Ad-GFP infected LX2 cells) identified in the microarray analyses. (G) Validation by Western blot analysis of selected differentially expressed genes (Ad-GATA4 vs. Ad-GFP infected LX2 cells) identified in the microarray analyses. β-Actin and GAPDH proteins were used as loading controls. Quantitative RT-PCR analysis of (H) fibrogenic (n = 4–8) and (I) antifibrogenic genes (n = 3–6) in G2-Cre;Gata4 KO E13.5 embryonic liver. Scale bars: 25 μm. Statistical analyses was performed using 2-tailed Student’s test. Error bars represent mean ± SEM. *P < 0.05, **P < 0.01.
Figure 5
Figure 5. GATA4 is a direct repressor of EPAS1 in HSCs.
(A) Quantitative RT-PCR analysis of EPAS1 expression in LX2 cells transfected with GFP-expressing (Ad-GFP) and GATA4-expressing (Ad-GATA4) adenoviruses (n = 3, Ad-GFP; n = 4, Ad-GATA4). (B) Quantitative RT-PCR analysis of EPAS1 expression in G2-Cre;Gata4 KO E13.5 embryonic liver (n = 5, control; n = 4, GATA4 KO). (C) Quantitative RT-PCR analysis of EPAS1 expression in livers of adult Gata4-floxed mice injected with GFP-expressing (Ad-GFP) (n = 4) and Cre-expressing adenoviruses (Ad-Cre) (n = 3). (D) Quantitative RT-PCR analysis in LX2 cells transfected with a siRNA directed against EPAS1 compared with control LX2 cells (treated with siRNA-negative control) (n = 3). (E) Schematic of the human EPAS1 intronic region containing 2 conserved GATA sites using Vista Tools software. The blue peak indicates the human EPAS1 transcription start, and the pink peaks indicate conserved noncoding regions between human and mouse. An 810 bp fragment of EPAS1 intronic region containing the 2 conserved GATA4 sites (EPAS1 wt) or the mutated version (EPAS1 mut) was cloned into the pGL3 luciferase vector for reporter assays. The nucleotides mutated in EPAS1 mut are shown in lowercase. The numbers indicate the localization in the EPAS1 locus from the transcriptional start site. (F) ChIP of LX2-overexpressing GATA4 using a GATA4-specific antibody or a IgG-unspecific antibody (n = 3). (G) In vitro luciferase reporter assays in 293T cells of pGL3-EPAS1 wt and pGL3-EPAS1 mut plasmids (n = 3). Statistical analyses was performed using 2-tailed Student’s test. Error bars represent mean ± SEM. *P < 0.05. RLU, relative light units.
Figure 6
Figure 6. Stabilization of HIF2α protein in HSCs causes liver fibrosis.
Immunofluorescence analysis in liver sections of E13.5 (B) G2-Cre;HIF2dPA embryos demonstrating efficient accumulation of HIF2α compared with (A) control embryonic livers. Reduced size of E13.5 (D) G2-Cre;HIF2dPA embryonic livers compared with (C) control livers. (E and F) H&E-stained sections of E13.5 G2-Cre;HIF2dPA and control embryonic livers. (G and H) Polarized light microscopy images of Sirius red–stained liver sections from E13.5 G2-Cre;HIF2dPA and control embryos. Immunofluorescence analysis of (I and J) laminin, (K and L) collagen IV, and (M and N) α-SMA accumulation in liver sections of E13.5 (J, L, and N) G2-Cre;HIF2dPA and (I, K, and M) control embryos. Quantification of proliferating liver cells, (O) marked by phosphohistone H3 immunoreactivity (n = 4 each group), and (P) apoptotic liver cells marked by cleaved caspase-3 accumulation (E13.5 n = 3–4; E15.5 n = 5–6). (Q) Quantification of Sirius red–stained area of liver of E13.5 G2-Cre;HIF2dPA and control embryos (n = 3 each group). (R) Quantitative RT-PCR analysis of α-Sma, Lama1, Cola1a, and VEGF expression (n = 5–8). Scale bars: 100 μm (A and B); 500 μm (C and D); 25 μm (EN). Statistical analyses was performed using 2-tailed Student’s test. Error bars represent mean ± SEM. *P < 0.05.

References

    1. Bataller R, Brenner DA. Liver fibrosis. J Clin Invest. 2005;115(2):209–218. doi: 10.1172/JCI24282. - DOI - PMC - PubMed
    1. Bataller R, Brenner DA. Hepatic stellate cells as a target for the treatment of liver fibrosis. Semin Liver Dis. 2001;21(3):437–451. doi: 10.1055/s-2001-17558. - DOI - PubMed
    1. Kisseleva T, Brenner DA. Fibrogenesis of parenchymal organs. Proc Am Thorac Soc. 2008;5(3):338–342. doi: 10.1513/pats.200711-168DR. - DOI - PMC - PubMed
    1. Reeves HL, Friedman SL. Activation of hepatic stellate cells--a key issue in liver fibrosis. Front Biosci. 2002;7:d808–d826. - PubMed
    1. Wong L, et al. Induction of beta-platelet-derived growth factor receptor in rat hepatic lipocytes during cellular activation in vivo and in culture. J Clin Invest. 1994;94(4):1563–1569. doi: 10.1172/JCI117497. - DOI - PMC - PubMed

Publication types

Substances