. 2021 Oct 26;17(10):e1009865.
doi: 10.1371/journal.pgen.1009865. eCollection 2021 Oct.

Chromatin accessibility and gene expression during adipocyte differentiation identify context-dependent effects at cardiometabolic GWAS loci

Affiliations

Chromatin accessibility and gene expression during adipocyte differentiation identify context-dependent effects at cardiometabolic GWAS loci

Hannah J Perrin et al. PLoS Genet. .

Abstract

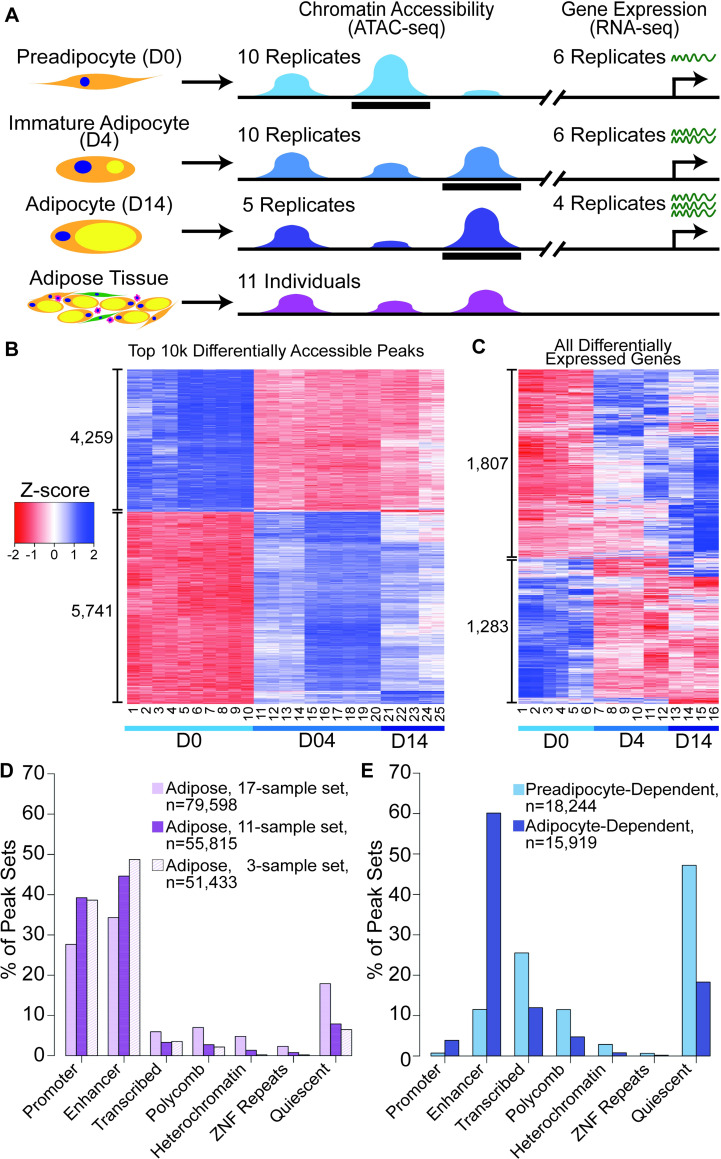
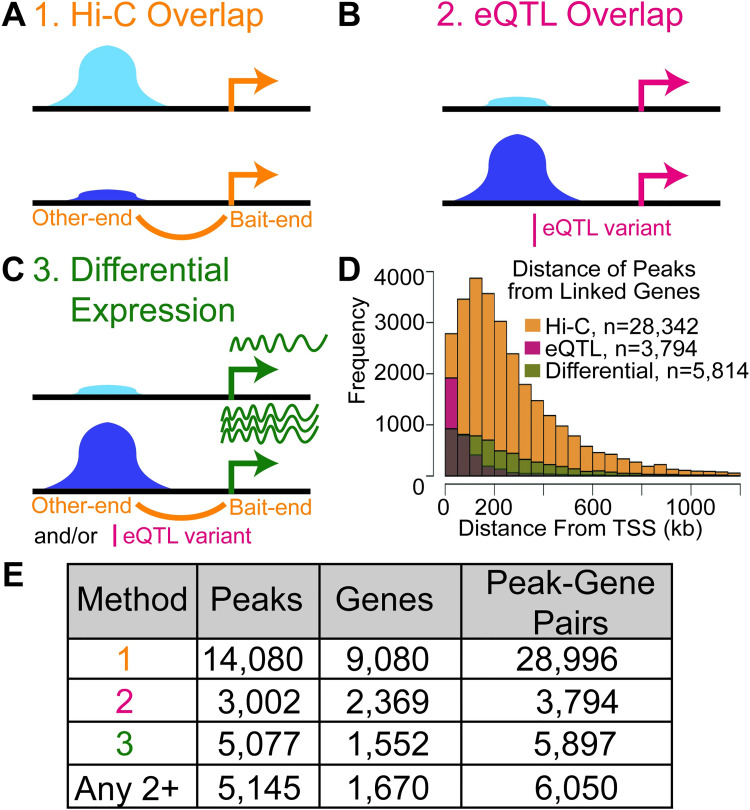
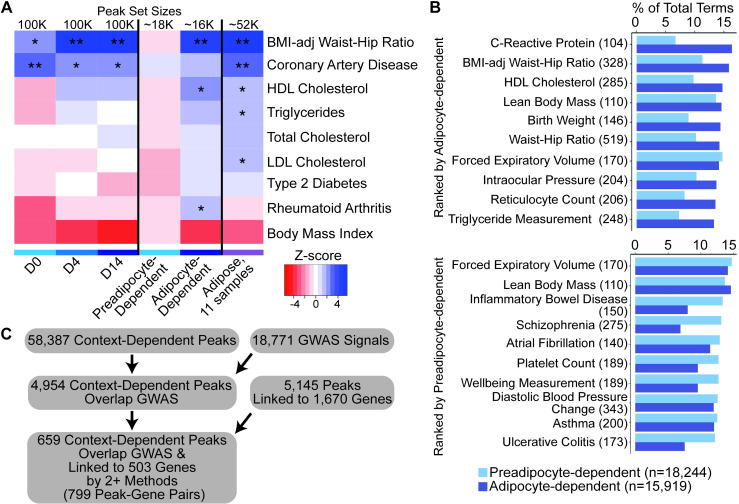
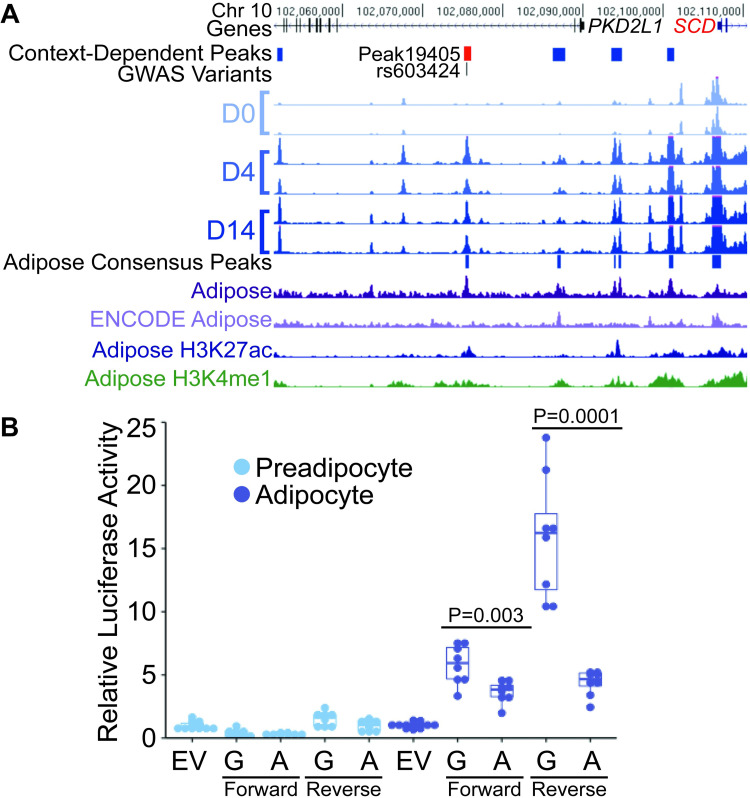
Chromatin accessibility and gene expression in relevant cell contexts can guide identification of regulatory elements and mechanisms at genome-wide association study (GWAS) loci. To identify regulatory elements that display differential activity across adipocyte differentiation, we performed ATAC-seq and RNA-seq in a human cell model of preadipocytes and adipocytes at days 4 and 14 of differentiation. For comparison, we created a consensus map of ATAC-seq peaks in 11 human subcutaneous adipose tissue samples. We identified 58,387 context-dependent chromatin accessibility peaks and 3,090 context-dependent genes between all timepoint comparisons (log2 fold change>1, FDR<5%) with 15,919 adipocyte- and 18,244 preadipocyte-dependent peaks. Adipocyte-dependent peaks showed increased overlap (60.1%) with Roadmap Epigenomics adipocyte nuclei enhancers compared to preadipocyte-dependent peaks (11.5%). We linked context-dependent peaks to genes based on adipocyte promoter capture Hi-C data, overlap with adipose eQTL variants, and context-dependent gene expression. Of 16,167 context-dependent peaks linked to a gene, 5,145 were linked by two or more strategies to 1,670 genes. Among GWAS loci for cardiometabolic traits, adipocyte-dependent peaks, but not preadipocyte-dependent peaks, showed significant enrichment (LD score regression P<0.005) for waist-to-hip ratio and modest enrichment (P < 0.05) for HDL-cholesterol. We identified 659 peaks linked to 503 genes by two or more approaches and overlapping a GWAS signal, suggesting a regulatory mechanism at these loci. To identify variants that may alter chromatin accessibility between timepoints, we identified 582 variants in 454 context-dependent peaks that demonstrated allelic imbalance in accessibility (FDR<5%), of which 55 peaks also overlapped GWAS variants. At one GWAS locus for palmitoleic acid, rs603424 was located in an adipocyte-dependent peak linked to SCD and exhibited allelic differences in transcriptional activity in adipocytes (P = 0.003) but not preadipocytes (P = 0.09). These results demonstrate that context-dependent peaks and genes can guide discovery of regulatory variants at GWAS loci and aid identification of regulatory mechanisms.


Conflict of interest statement

The authors have declared that no competing interests exist.

Figures

Fig 1
Fig 1. Genome-wide profiles of chromatin accessibility and gene expression at three timepoints of adipocyte differentiation.
(A) Schematic of experimental design. SGBS cells were harvested as preadipocytes (D0), immature adipocytes (D4), and adipocytes (D14). Chromatin accessibility (blue) and gene expression (green) profiles were generated on replicates from each timepoint. Context-dependent peaks are shown as black bars. Chromatin accessibility profiles also were generated from subcutaneous adipose tissue (purple) of 17 individuals and an optimized consensus CA map was developed from a subset of 11 individuals. (B) Heatmap of the top 10,000 context-dependent peaks (from S4 Table) colored by z-score. Library numbers correspond to quality metrics in S1 Table. (C) Heatmap of expression level of all 3,090 context-dependent genes (from S9 Table) colored by z-score. Library numbers correspond to quality metrics in S8 Table. (D-E) Values in S9 Table. (D) Adipose peak overlap with chromatin states of Roadmap Epigenomics Project adipose nuclei for three sets of adipose consensus peaks. (E) Preadipocyte- and adipocyte-dependent peak overlap with chromatin states of Roadmap adipose nuclei.
Fig 2
Fig 2. Linking context-dependent chromatin accessibility to candidate genes.
(A-C) Schematic of three approaches to link peaks to genes. Day 0 (light blue) and day 14 (dark blue) context-dependent peaks are represented. (A) Context-dependent peaks that overlap elements connected to gene promoters using adipocyte promoter capture Hi-C (orange). (B) Context-dependent peaks that overlap adipose gene eQTL variants (r2>.8 with lead, red). (C) Context-dependent peaks linked to a gene through Hi-C or eQTL for which the linked gene was also differentially expressed between any timepoints (green). (D) Histogram of distances from edges of peaks to the transcription start site of a linked gene within 1.2 Mb. Values in S12 Table. (E) Numbers of context-dependent peaks linked to genes by each method and by two or more methods. Values summarize full results in S12 Table.
Fig 3
Fig 3. Linking peaks to GWAS signals.
(A) Heatmap of cardiometabolic trait GWAS locus enrichment; rheumatoid arthritis was selected for comparison. Peak sets include 100,000 peaks from individual days, preadipocyte- and adipocyte-dependent peaks derived from pairs of timepoints, and adipose tissue peaks. Values in S13 Table. **, P < 0.0056; *, P < 0.05 (B) Barplots of normalized counts of specific experimental factor ontology (EFO) terms for GWAS signals with a variant in a context-dependent peak. Barplots show the top ten EFO terms ranked by normalized count for either preadipocyte-dependent peaks, or adipocyte-dependent peaks. Total number of signals for each term used in the overlap is noted in parentheses in the axis label. Total number of signals for each term overlapping a context-dependent peak is noted to the right of the “All Context-dependent” bar. Values in S14 Table. (C) Flowchart identifying context-dependent peaks overlapping GWAS signals and linked to genes through 2 or more methods.
Fig 4
Fig 4. Allelic differences in transcriptional activity for a context-dependent regulatory variant in a context-dependent element at the SCD locus.
(A) Peak19405 (red) is more accessible in D4 and D14 adipocytes than D0 preadipocytes, overlaps an adipose tissue consensus peak (dark purple), and overlaps variant rs603424, which is associated with blood plasma levels of palmitoleic acid and adipose SCD expression. SCD is also more highly expressed at D4 and D14 compared to D0. Additional tracks show adipose tissue ATAC-seq from ENCODE (light purple) and adipose nuclei histone mark ChIP-seq from the Roadmap Epigenomics project (blue and green). (B) A 592-bp genomic region surrounding peak19405 containing the rs603424-G allele shows increased transcriptional activity compared to the rs603424-A allele in the forward and reverse orientations only in adipocytes (tested at day 12), the context in which chromatin was more accessible compared to preadipocytes. Dots represent two independent constructs assayed from four replicates each. Luciferase activity was normalized relative to an empty vector (EV). Values in S18 Table.
Fig 5
Fig 5. Allelic differences in transcriptional activity for variants in two regulatory elements at the EYA2 locus.
(A) Peak81750 (red) is more accessible in D4 and D14 adipocytes and overlaps variant rs559066194, which is associated with increased risk of type 2 diabetes and increased EYA2 expression. EYA2 is more highly expressed at D4 and D14, compared to D0. A second variant at this locus, rs59791349, intersects a consensus adipose peak (dark purple) but not a context-dependent peak. Additional tracks as in Fig 4. (B-C) Values in S18 Table. (B) A 419-bp genomic region surrounding peak81750 containing the rs555966194-C allele shows modestly-increased transcriptional activity compared to the rs555966194-G allele in the reverse orientation, but not the forward, in adipocytes (tested at day 9), the context in which chromatin was more accessible compared to preadipocytes. Dots represent two independent constructs assayed from four replicates each. Luciferase activity was normalized relative to an empty vector (EV). (C) A 288-bp genomic region containing the rs59791349-C allele shows increased transcriptional activity compared to the rs59791349-T allele in both orientations and in both preadipocytes and adipocytes (tested at day 9). Dots represent two independent constructs assayed from four replicates each. Luciferase activity was normalized relative to an EV.

References

    1. Benjamin EJ, Virani SS, Callaway CW, Chamberlain AM, Chang AR, Cheng S, et al.. Heart Disease and Stroke Statistics—2018 Update: A Report From the American Heart Association. Circulation. 2018;137. doi: 10.1161/CIR.0000000000000558 - DOI - PubMed
    1. Cannon ME, Mohlke KL. Deciphering the Emerging Complexities of Molecular Mechanisms at GWAS Loci. Am J Hum Genet. 2018;103: 637–653. doi: 10.1016/j.ajhg.2018.10.001 - DOI - PMC - PubMed
    1. Grundberg E, Small KS, Hedman ÅK, Nica AC, Buil A, Keildson S, et al.. Mapping cis- and trans-regulatory effects across multiple tissues in twins. Nat Genet. 2012;44: 1084–1089. doi: 10.1038/ng.2394 - DOI - PMC - PubMed
    1. Civelek M, Wu Y, Pan C, Raulerson CK, Ko A, He A, et al.. Genetic Regulation of Adipose Gene Expression and Cardio-Metabolic Traits. Am J Hum Genet. 2017;100: 428–443. doi: 10.1016/j.ajhg.2017.01.027 - DOI - PMC - PubMed
    1. Raulerson CK, Ko A, Kidd JC, Currin KW, Brotman SM, Cannon ME, et al.. Adipose Tissue Gene Expression Associations Reveal Hundreds of Candidate Genes for Cardiometabolic Traits. Am J Hum Genet. 2019;105: 773–787. doi: 10.1016/j.ajhg.2019.09.001 - DOI - PMC - PubMed

Publication types

MeSH terms