. 2022 Feb 17;139(7):1066-1079.
doi: 10.1182/blood.2021012519.

Asxl1 loss cooperates with oncogenic Nras in mice to reprogram the immune microenvironment and drive leukemic transformation

Affiliations

Asxl1 loss cooperates with oncogenic Nras in mice to reprogram the immune microenvironment and drive leukemic transformation

Xiaona You et al. Blood. .

Abstract

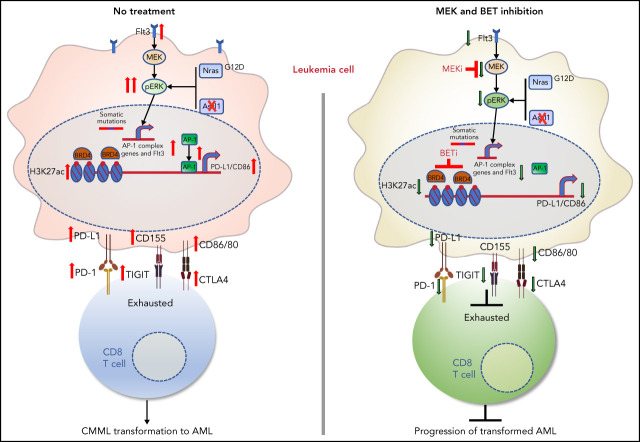
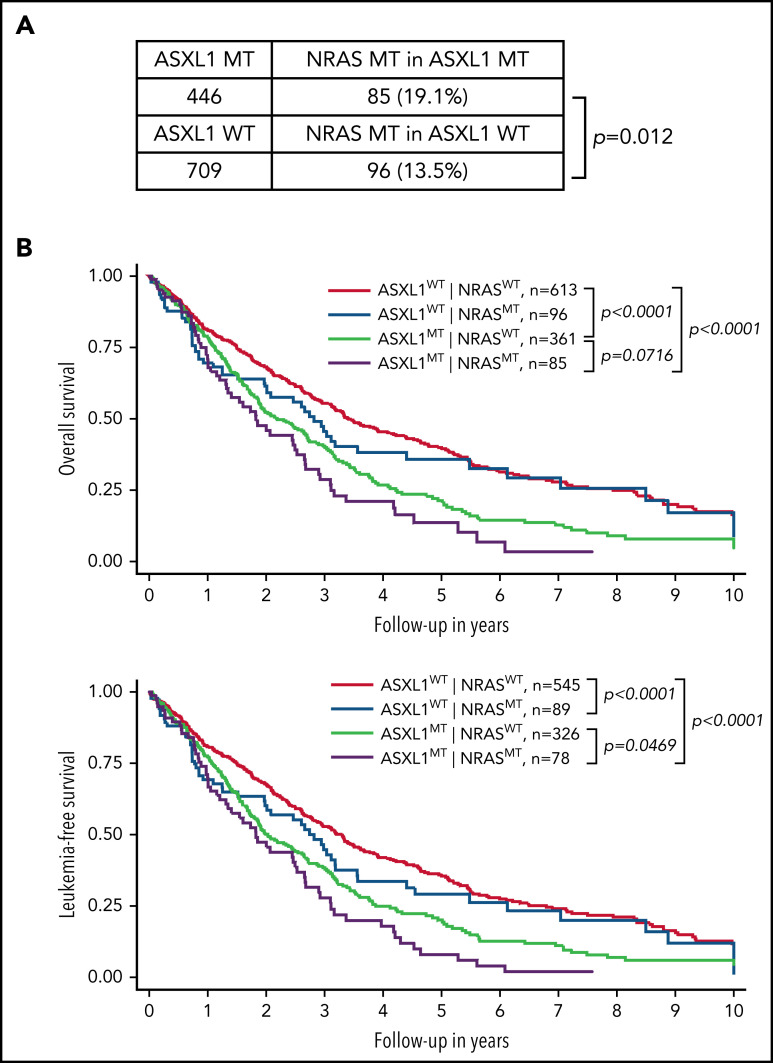
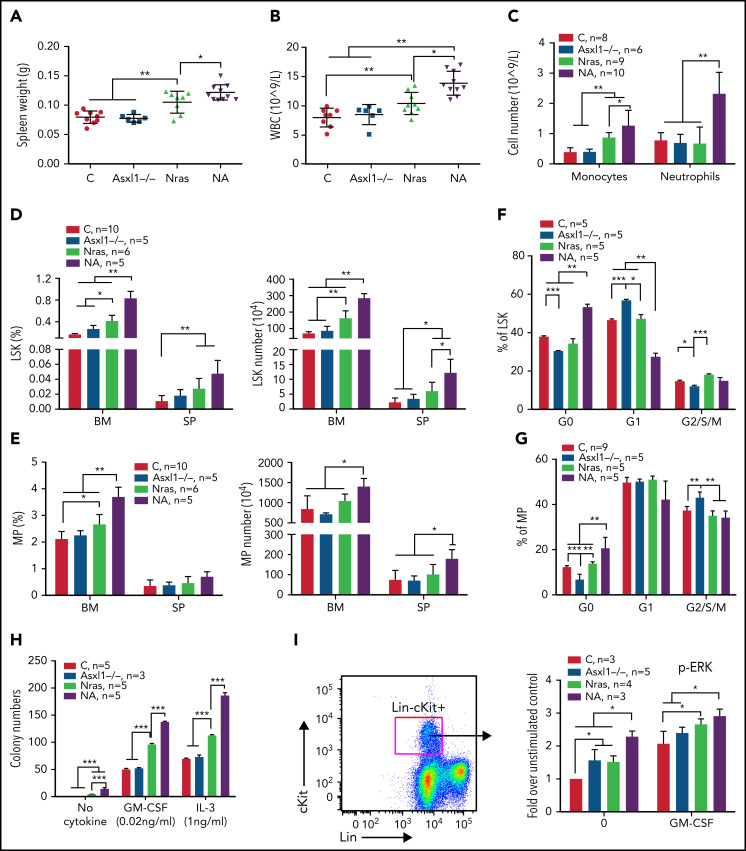
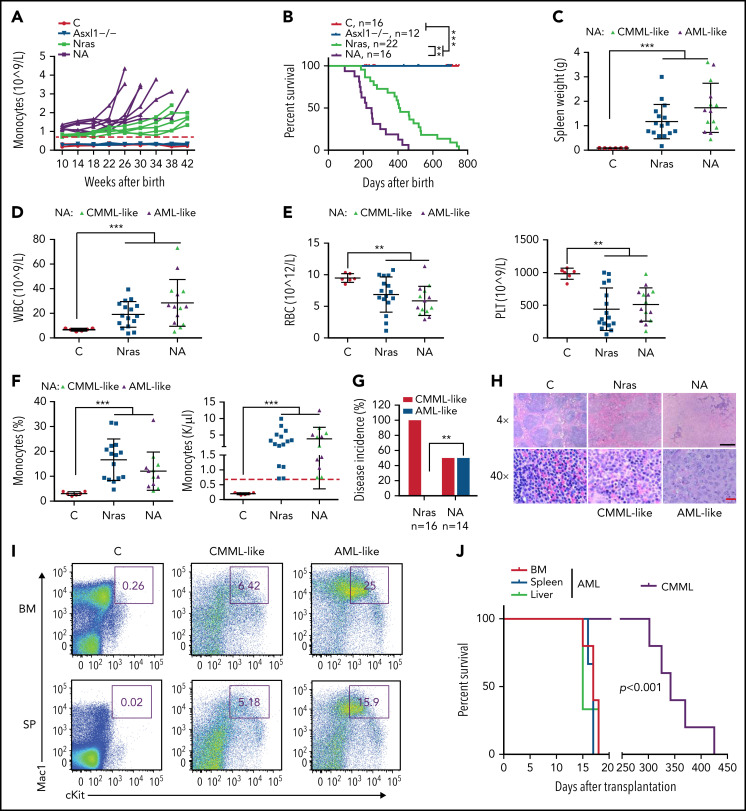
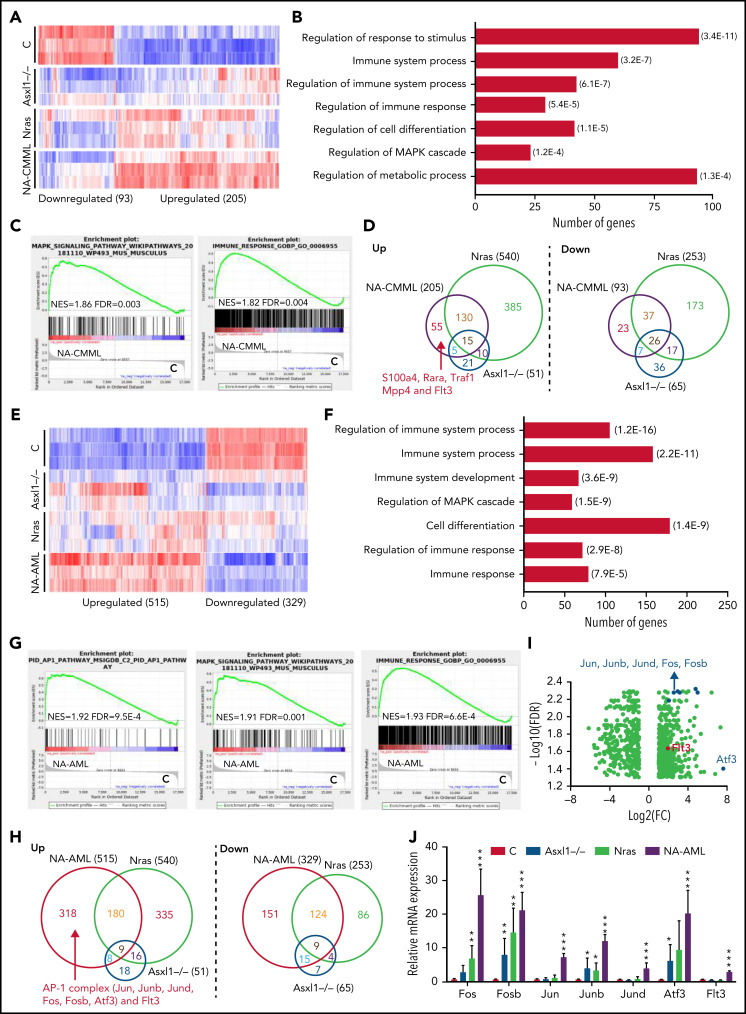
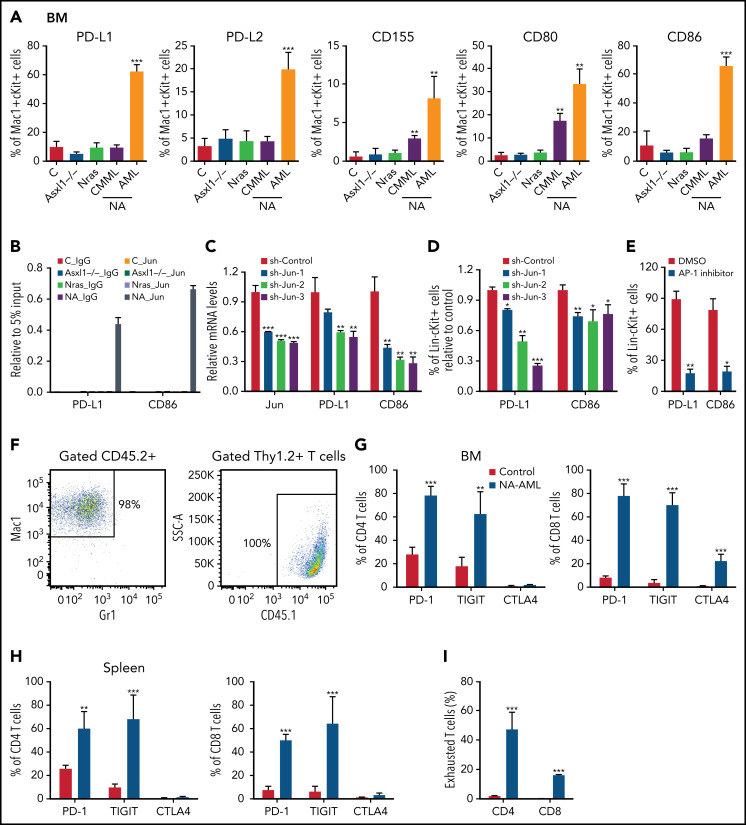
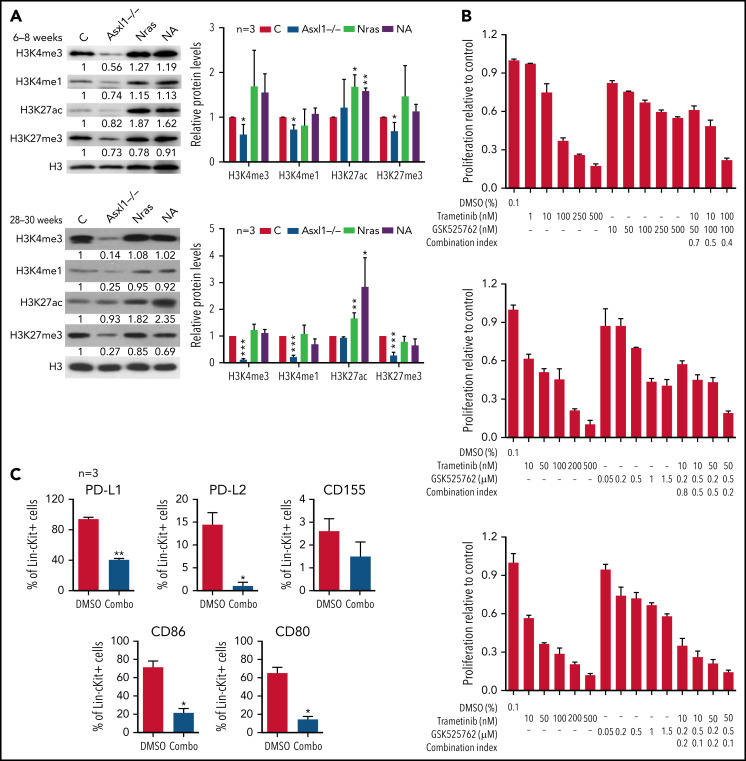
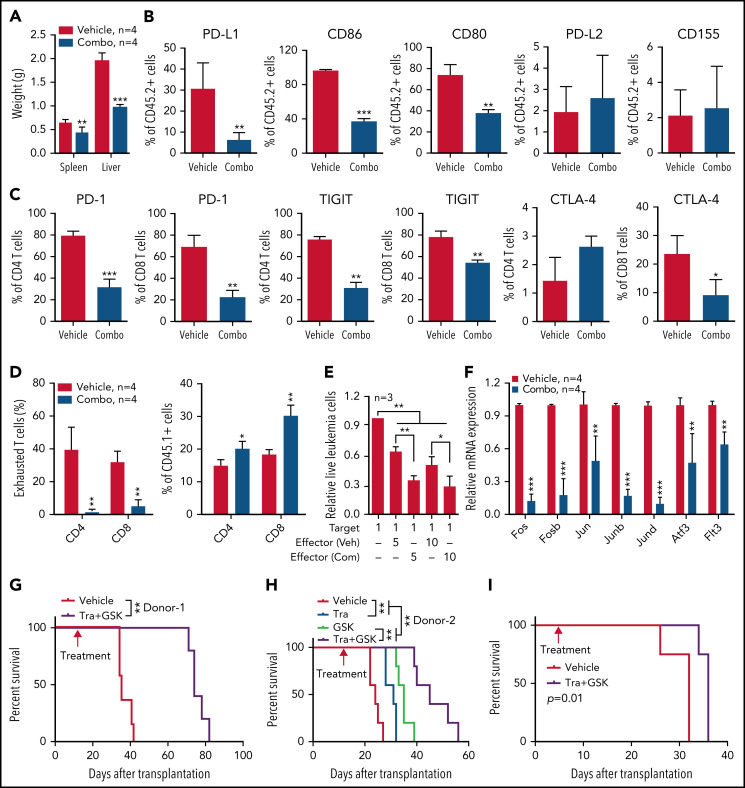
Mutations in chromatin regulator ASXL1 are frequently identified in myeloid malignancies, in particular ∼40% of patients with chronic myelomonocytic leukemia (CMML). ASXL1 mutations are associated with poor prognosis in CMML and significantly co-occur with NRAS mutations. Here, we show that concurrent ASXL1 and NRAS mutations defined a population of CMML patients who had shorter leukemia-free survival than those with ASXL1 mutation only. Corroborating this human data, Asxl1-/- accelerated CMML progression and promoted CMML transformation to acute myeloid leukemia (AML) in NrasG12D/+ mice. NrasG12D/+;Asxl1-/- (NA) leukemia cells displayed hyperactivation of MEK/ERK signaling, increased global levels of H3K27ac, upregulation of Flt3. Moreover, we find that NA-AML cells overexpressed all the major inhibitory immune checkpoint ligands: programmed death-ligand 1 (PD-L1)/PD-L2, CD155, and CD80/CD86. Among them, overexpression of PD-L1 and CD86 correlated with upregulation of AP-1 transcription factors (TFs) in NA-AML cells. An AP-1 inhibitor or short hairpin RNAs against AP-1 TF Jun decreased PD-L1 and CD86 expression in NA-AML cells. Once NA-AML cells were transplanted into syngeneic recipients, NA-derived T cells were not detectable. Host-derived wild-type T cells overexpressed programmed cell death protein 1 (PD-1) and T-cell immunoreceptor with immunoglobulin and ITIM domains (TIGIT) receptors, leading to a predominant exhausted T-cell phenotype. Combined inhibition of MEK and BET resulted in downregulation of Flt3 and AP-1 expression, partial restoration of the immune microenvironment, enhancement of CD8 T-cell cytotoxicity, and prolonged survival in NA-AML mice. Our study suggests that combined targeted therapy and immunotherapy may be beneficial for treating secondary AML with concurrent ASXL1 and NRAS mutations.


Figures

None
Graphical abstract
Figure 1.
Figure 1.
Concurrent NRAS and ASXL1 mutations associate with poor prognosis in CMML. (A) Percentages of CMML patients with NRAS mutation in patients with MT or WT ASXL1 are shown. P value was determined using the χ2 test. (B) Overall survival and leukemia-free survival of CMML patients stratified on the basis of ASXL1 and NRAS mutation status. P values were determined using the log-rank test.
Figure 2.
Figure 2.
Asxl1−/− promotes ERK hyperactivation and CMML-like phenotypes in NrasG12D/+ mice. Control (C; Vav-Cre), Asxl1−/− (Asxl1−/−), NrasG12D/+ (Nras), and NrasG12D/+;Asxl1−/− (NA) mice were euthanized at age 6 weeks. Quantification of (A) spleen weight, (B) white blood cells (WBCs) in peripheral blood, and (C) numbers of monocytes and neutrophils in peripheral blood. (D-E) Frequencies and absolute numbers of (D) LSK cells and (E) MP cells in bone marrow (BM; including femurs and tibias) and spleen (SP). (F-G) Cell cycle analysis of (F) LSK cells and (G) MP cells from bone marrow using Ki67 and 4′,6-diamidino-2-phenylindole (DAPI). (H) A total of 5 × 10⁴ bone marrow cells were plated in duplicate and cultured in semisolid medium with or without granulocyte-macrophage colony-stimulating factor (GM-CSF) or interleukin-3 (IL-3). Colony numbers were counted after 7 days in culture. (I) Bone marrow cells were serum- and cytokine-starved for 2 hours at 37°C. Cells were then stimulated with or without 2 ng/mL of murine GM-CSF for 10 minutes at 37°C. Levels of pERK1/2 were measured using phospho-flow cytometry in Lin–/lowc-Kit+ cells. Data are presented as mean + standard deviation (SD). *P < .05; **P < .01; ***P < .001.
Figure 3.
Figure 3.
Asxl1−/− co-operates with NrasG12D/+ to promote CMML progression and AML transformation. (A) The absolute numbers of monocytes in peripheral blood of control (Vav-Cre), Asxl1−/−, Nras, and NA mice were monitored regularly. Monocytosis (red dash line) is defined as threefold over the average number of control monocytes. (B) Kaplan-Meier survival curves were plotted against days after birth. P values were determined using the log-rank test. (C-I) Moribund Nras and NA mice and age-matched control mice were analyzed. (C-F) Quantification of (C) spleen weight, (D) numbers of WBCs, (E) numbers of red blood cells (RBCs), and platelets (PLT), and (F) frequencies and numbers of monocytes in peripheral blood. Green triangles: NA mice with CMML; purple triangles, NA mice with AML. Red dashed line (F) indicates monocytosis as described above. (G) Quantification of disease incidence (χ2 analysis). (H) Representative spleen hematoxylin and eosin–stained sections from Control, Nras, and NA mice. Black scale bar, 500 μm; red scale bar, 20 μm. (I) Mac1 and c-Kit analysis of bone marrow and spleen cells from control and NA mice with CMML-like or AML-like disease. (J) Malignant cells from moribund NA mice with CMML-like or AML-like disease were transplanted into sublethally irradiated recipient mice (CD45.1+). Kaplan-Meier survival curves were plotted against days after transplantation. P values were determined using the log-rank test. Data are presented as mean + SD. *P < .05; **P < .01; ***P < .001.
Figure 4.
Figure 4.
RNA-seq analysis identifies aberrant regulation of immune system and upregulation of AP-1 complex genes associated with NrasG12D/+;Asxl1−/− AML. Linc-Kit+ cells were sorted from moribund NA mice with CMML (NA-CMML) or AML (NA-AML) and age-matched controls (Vav-Cre), Asxl1−/−, and Nras mice for RNA-seq analysis. (A-D) RNA-seq analysis of NA-CMML cells. (A) Heatmap of DEGs in NA-CMML cells compared with control cells (fold change ≥2 and false discovery rate [FDR] <0.05). (B) Gene Ontology (GO) analysis of DEGs in NA-CMML cells. The representative biological processes are shown with numbers of genes in each category and corresponding FDR in parentheses. (C) Gene set enrichment analysis (GSEA) identified dysregulated gene signatures in NA-CMML vs control. (D) Venn diagrams of up- or downregulated DEGs among NA-CMML, Nras, and Asxl1−/− cells. (E-J) RNA-seq analysis of NA-AML cells. (E) Heatmap of DEGs in NA-AML cells compared with control cells (fold change ≥2; FDR <0.05). (F) GO analysis of DEGs in NA-AML cells. The representative biological processes are shown with numbers of genes in each category and corresponding FDR in parentheses. (G) GSEA identified dysregulated gene signatures in NA-AML vs control. (H) Venn diagrams of up- or downregulated DEGs among NA-AML, Nras, and Asxl1−/− cells. (I) Volcano plot illustrating DEGs in NA-AML vs control, highlighting AP-1 complex genes and Flt3. (J) Quantification of AP-1 complex genes (Fos, Fosb, Jun, Junb, Jund, and Atf3) and Flt3 messenger RNA (mRNA) levels using quantitative reverse transcriptase polymerase chain reaction (qRT-PCR) in sorted Linc-Kit+ cells (n = 5 in each group). Data are presented as mean + SD. *P < .05; **P < .01; ***P < .001. NES, normalized enrichment score.
Figure 5.
Figure 5.
AP-1 TF Jun regulates PD-L1 and CD86 expression and contributes to the suppressive immune microenvironment in NA-AML mice. (A) Quantification of bone marrow Mac1+c-Kit+ cells expressing immune checkpoint ligands PD-L1/PD-L2, CD155, and CD80/CD86 in moribund NA mice with CMML (NA-CMML) or AML (NA-AML) and age-matched control (Vav-Cre), Asxl1−/−, and Nras mice. (B) Enrichment of Jun binding at PD-L1 and CD86 enhancer/promoter regions was analyzed using chromatin immunoprecipitation (ChIP)-qPCR in bone marrow cells of moribund NA-AML and age-matched controls, Asxl1−/−, and Nras mice. Immunoglobulin G (IgG) was used as a negative control. The enrichment was normalized to 5% input (n = 3). (C-D) NA-AML cells were cultured in vitro and infected with pGIPZ lentiviral vectors encoding short hairpin Control (shControl) or shJun. At 72 hours after infection, (C) mRNA levels of Jun, PD-L1, and CD86 were analyzed in sorted c-Kit+GFP+ cells using qRT-PCR, and (D) surface expression of PD-L1 and CD86 were analyzed in Linc-Kit+GFP+ cells using flow cytometry. (E) NA-AML cells were cultured in vitro and treated with dimethyl sulfoxide (DMSO) or 4 μΜ SR11302 (AP-1 inhibitor) for 5 days. Surface expression of PD-L1 and CD86 were analyzed in Linc-Kit+ cells using flow cytometry. (F-I) Sublethally irradiated mice were transplanted with 2.5 × 10⁵ bone marrow cells from moribund NA-AML mice or age-matched control mice. (F) In NA-AML recipients, donor-derived (CD45.2+) cells were exclusively Mac1+ leukemia cells, whereas T cells (Thy1.2+) were derived from the host (CD45.1+). (G-H) Quantification of (G) bone marrow and (H) spleen CD4 and CD8 T cells expressing immune checkpoint receptors PD-1, TIGIT, and CTLA4. (I) Quantification of exhausted T cells (PD-1+TIGIT+LAG3+) in spleen CD4 and CD8 T cells in NA-AML and control recipients. Data are presented as mean + SD. *P < .05; **P < .01; ***P < .001. SSC, side scatter.
Figure 6.
Figure 6.
Combined inhibition of MEK and BET downregulates surface expression of inhibitory immune checkpoint ligands and inhibits NrasG12D/+;Asxl1−/− AML cell growth in vitro. (A) Expression levels of H3K4me3, H3K4me1, H3K27ac, H3K27me3, and total H3 in bone marrow cells from age 6 to 8 weeks or age 28 to 30 weeks controls (C), Asxl1−/−, Nras, and NA mice were analyzed using western blot. (B) NA-AML cells were cultured in triplicate in 96-well plates in the presence of DMSO or various concentrations of trametinib and/or GSK525762 for 7 days. Cell proliferation was quantified using the CellTiter-Glo assay. Combination Index was calculated using a CompuSyn algorithm. An index value <1 indicates synergism. (C) NA-AML cells were cultured in vitro and treated with DMSO or trametinib and GSK525762 (combined) for 5 days. Surface expression of PD-L1, PD-L2, CD155, CD86, and CD80 were analyzed in Linc-Kit+ cells using flow cytometry. Data are presented as mean + SD. *P < .05; **P < .01; ***P < .001.
Figure 7.
Figure 7.
Combined inhibition of MEK and BET downregulates inhibitory immune checkpoint pathways and AML transformation gene signature and prolongs the survival of NrasG12D/+;Asxl1−/− AML mice. Sublethally irradiated mice (CD45.1+) were transplanted with 2.5 × 10⁵ bone marrow cells from moribund primary NA-AML recipients. Two weeks after transplantation, mice were randomly separated into (A-G) 2 groups and treated with vehicle (Veh) or a combination (Combo) of trametinib and GSK525762 once per day or (H) 4 groups treated with vehicle, trametinib (Tra), and/or GSK525762 (GSK) once per day. (A-F) Recipients were euthanized at ∼5 weeks posttransplant. Quantification of (A) spleen and liver weights; (B) bone marrow leukemia cells (CD45.2+) expressing PD-L1, CD86, CD80, PD-L2, or CD155 using flow cytometry; (C) bone marrow CD4 and CD8 T cells expressing PD-1, TIGIT, or CTLA-4; and (D) exhausted T cells (PD-1+TIGIT+LAG3+) in spleen CD4 and CD8 T cells. (E) T-cell cytotoxicity assay. CD45.2+ leukemia cells (Target) were sorted from moribund NA-AML recipients treated with vehicle. The same number of Target cells were cocultured with splenic CD8 T cells (Effector), which were sorted from recipients treated with vehicle (Veh) or combination (Com) of drugs at different ratios. The live leukemia cells were quantified 48 hours after coculture. (F) Quantification of AP-1 complex genes (Fos, Fosb, Jun, Junb, Jund, and Atf3) and Flt3 mRNA levels using qRT-PCR in sorted leukemia cells (CD45.2+). (G-H) Kaplan-Meier survival curves were plotted against days after transplantation using NA-AML cells from different donors. (I) 1.78 million bone marrow mononuclear cells from a RAS and ASXL1 double-mutant CMML patient were transplanted into irradiated NRGS mice (n = 4 mice per group). Five days after transplantation, mice were randomly separated into 2 groups and treated with vehicle or trametinib plus GSK525762 until moribund stage as described in “Materials and methods.” Kaplan-Meier survival curves were plotted against days after transplantation. (G-I) Data are presented as mean + SD. P values were determined using the log-rank test. *P < .05; **P < .01; ***P < .001.

References

    1. Sinclair DA, Milne TA, Hodgson JW, et al. . The additional sex combs gene of Drosophila encodes a chromatin protein that binds to shared and unique Polycomb group sites on polytene chromosomes. Development. 1998;125(7):1207-1216. - PubMed
    1. Inoue D, Matsumoto M, Nagase R, et al. . Truncation mutants of ASXL1 observed in myeloid malignancies are expressed at detectable protein levels. Exp Hematol. 2016;44(3):172-176.e1. - PubMed
    1. Abdel-Wahab O, Adli M, LaFave LM, et al. . ASXL1 mutations promote myeloid transformation through loss of PRC2-mediated gene repression. Cancer Cell. 2012;22(2):180-193. - PMC - PubMed
    1. Abdel-Wahab O, Dey A. The ASXL-BAP1 axis: new factors in myelopoiesis, cancer and epigenetics. Leukemia. 2013;27(1):10-15. - PubMed
    1. Inoue D, Fujino T, Sheridan P, et al. . A novel ASXL1-OGT axis plays roles in H3K4 methylation and tumor suppression in myeloid malignancies. Leukemia. 2018;32(6):1327-1337. - PubMed

Publication types

MeSH terms