. 2021 Dec;600(7890):743-747.
doi: 10.1038/s41586-021-04145-3. Epub 2021 Oct 26.

A conserved mechanism for regulating replisome disassembly in eukaryotes

Affiliations

A conserved mechanism for regulating replisome disassembly in eukaryotes

Michael Jenkyn-Bedford et al. Nature. 2021 Dec.

Abstract

Replisome disassembly is the final step of eukaryotic DNA replication and is triggered by ubiquitylation of the CDC45-MCM-GINS (CMG) replicative helicase1-3. Despite being driven by evolutionarily diverse E3 ubiquitin ligases in different eukaryotes (SCFDia2 in budding yeast1, CUL2LRR1 in metazoa4-7), replisome disassembly is governed by a common regulatory principle, in which ubiquitylation of CMG is suppressed before replication termination, to prevent replication fork collapse. Recent evidence suggests that this suppression is mediated by replication fork DNA8-10. However, it is unknown how SCFDia2 and CUL2LRR1 discriminate terminated from elongating replisomes, to selectively ubiquitylate CMG only after termination. Here we used cryo-electron microscopy to solve high-resolution structures of budding yeast and human replisome-E3 ligase assemblies. Our structures show that the leucine-rich repeat domains of Dia2 and LRR1 are structurally distinct, but bind to a common site on CMG, including the MCM3 and MCM5 zinc-finger domains. The LRR-MCM interaction is essential for replisome disassembly and, crucially, is occluded by the excluded DNA strand at replication forks, establishing the structural basis for the suppression of CMG ubiquitylation before termination. Our results elucidate a conserved mechanism for the regulation of replisome disassembly in eukaryotes, and reveal a previously unanticipated role for DNA in preserving replisome integrity.


Conflict of interest statement

The authors declare no competing interests.

Figures

Fig. 1
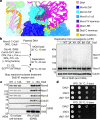
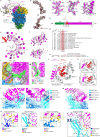
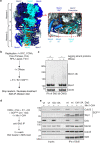
Fig. 1. Cryo-EM structures of terminated replisomes from Saccharomyces cerevisiae bound by SCFDia2.
a, Schematic of the regulation of replisome disassembly. For clarity, replisomes are depicted as CMG. CMG ubiquitylation and replisome disassembly are inhibited at replication forks by an as yet unknown mechanism, dependent on the excluded DNA strand (in red box). This inhibition is relieved following translocation onto dsDNA (in green box, left and middle) or off DNA (in green box, right). b, Slice-through view of cryo-EM density for complexes assembled on dsDNA. The density shown is a composite of focused maps (refer to Extended Data Fig. 2). c, DNA engagement within the MCM C-tier motor domains by complexes assembled on dsDNA (coloured) or on a replication fork (grey; PDB: 6SKL). d, Cryo-EM density as in b (left) and corresponding atomic model (right) for complexes assembled on dsDNA. For the atomic model, only SCFDia2, DNA and MCM subunits that interact with SCFDia2 are coloured. e, Alternative view of the atomic model in d. f, Cryo-EM density for complexes assembled in the absence of DNA, derived from multibody refinement. g, Comparison of the MCM–Dia2LRR interface from complexes assembled on dsDNA (be), off DNA (f) or on a replication fork (PDB: 6SKL). For the regions of MCM at this interface, the root mean square deviation (r.m.s.d.) of the replication fork-bound complex compared with the dsDNA-bound or off-DNA complexes is 1.39 Å and 0.93 Å, respectively.
Fig. 2
Fig. 2. The MCM–Dia2LRR interface is required for replisome disassembly.
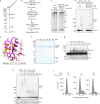
a, Overview of the MCM–Dia2LRR interface. Leading-strand and lagging-strand template DNA is coloured orange and pink, respectively. Residues altered in Dia2LRR mutants are in yellow. b, Reaction scheme to monitor CMG–Mcm7 ubiquitylation after Pif1-stimulated replication fork convergence in vitro (left). Immunoblot of reactions conducted as indicated is also shown (right). The experiment was repeated three times. IP, immunoprecipitation; Mut, mutant; Ub, ubiquitin; WT, wild type. c, SDS–PAGE and immunoblotting of TAP–Sld5 immunoprecipitations from G1-arrested yeast cells with the indicated Dia2 alleles. The experiment was repeated twice. Also see Extended Data Fig. 7i. TAP, tandem affinity purification. d, Spot-dilution assay (tenfold serial dilutions) with the indicated yeast strains. The experiment was repeated three times. For gel source data, see Supplementary Fig. 1. YPD, yeast extract peptone dextrose.
Fig. 3
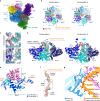
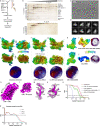
Fig. 3. Cryo-EM structures of human replisomes bound by CUL2LRR1.
a, Cryo-EM density of the human replisome bound by CUL2LRR1. The density shown is a composite of focused maps (refer to Extended Data Fig. 8). b, Atomic models for the human replisome bound by CUL2LRR1 displayed using transparent surface rendering, except for CUL2LRR1. Only CUL2LRR1, DNA and the CUL2LRR1-interacting regions of MCM are coloured (left). The model indicating the distance between RBX1 and K28/K29MCM7 is coloured according to subunit (right). c, LRR1 domain architecture diagram. The primary sequence and LRRs 1–9 are numbered. PH, pleckstrin homology. d, Overview of the interface between LRR1 and the replisome. The model is displayed using surface rendering, except for LRR1 and DNA.
Fig. 4
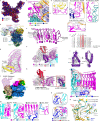
Fig. 4. A conserved mechanism for regulating replisome disassembly in eukaryotes.
a, Comparison of cryo-EM density maps for human replisome complexes (CMG, TIMELESS, TIPIN, CLASPIN, AND-1 and Pol-ε) bound to DNA substrates either lacking (left) or featuring (right; EMDB: EMD-13375 (ref. )) a 15-nucleotide 5ʹ flap, representing the excluded DNA strand. Density is coloured according to chain occupancy using a radius of 5 Å, with the excluded strand coloured manually in UCSF Chimera. ssDNA, single-stranded DNA. b, Alternative views of the ZnF domains of MCM3 and MCM5 during replication elongation (red box, excluded strand present) and termination (green box, excluded strand absent). In the upper panel of the red box, the dashed line shows a putative path for the excluded ssDNA beyond the density observed in a, right. In the lower panel of the red box, four sugar-phosphate backbone linkages were built into the excluded strand density (see a, right; EMDB: EMD-13375 (ref. )). H. sapiens, Homo sapiens. c, Model for the regulation of CMG ubiquitylation. LRR-interacting regions of MCM are occluded in the MCM double hexamer (see Extended Data Fig. 11a) and by the excluded DNA strand at replication forks (see a, b) (red box). Loss of the excluded strand upon termination allows LRR–MCM engagement, CMG ubiquitylation and replisome disassembly (green box).
Extended Data Fig. 1
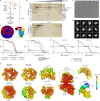
Extended Data Fig. 1. Supporting data for cryo-EM investigation of S. cerevisiae dsDNA-bound replisome:SCFDia2 complexes.
a, Schematic of reconstitution approach used for preparation of cryo-EM sample representing terminating SCFDia2-bound replisome complexes after translocation onto dsDNA. A schematic of the DNA substrate used is shown in orange, with the 20 nt tract of methylphosphonate (MEP) linkages coloured red. b, Silver-stained SDS-PAGE gels analysing 100 μL fractions taken across 10-30% glycerol gradients, either lacking (top) or containing (bottom) crosslinking agents. Fractions 13+14 used for cryo-EM sample preparation are indicated. * = Cdc34-Ub; ** = Cdc34. Similar results were observed for three independent sample preparations. c, Representative cryo-EM micrograph. d, Representative 2D class averages, 40 nm box width. e, Representative angular distribution of particle orientations. A correspondingly oriented model is shown to the right for reference. f, Fourier shell correlation graphs for maps used in model building. The resolution of reconstructions calculated at the FSC=0.143 criterion are reported in Extended Data Fig. 2. g, Model-to-map correlation graphs. h, Cryo-EM density maps relevant to model building, coloured by local resolution. For gel source data, see Supplementary Fig. 1.
Extended Data Fig. 2
Extended Data Fig. 2. Data processing pipeline related to S. cerevisiae replisome:SCFDia2 complexes.
The approach used to subclassify complexes based on MCM C-tier conformation and DNA engagement are coloured orange; the approach used to derive cryo-EM reconstructions for model building or adjustment of regions outside MCM are coloured magenta. Reported resolutions are calculated based on the FSC=0.143 criterion (refer to Extended Data Fig. 1f).
Extended Data Fig. 3
Extended Data Fig. 3. DNA engagement by S. cerevisiae CMG following translocation onto dsDNA.
a, Comparison of conformations I and II demonstrating the similarity in the overall complex architecture. For clarity, conformation I is rendered as a surface, whilst conformation II is shown as a cartoon. b, Overview of MCM C-tier domains bound to dsDNA, highlighting ATPase site occupancy in conformations I and II. c, Cryo-EM density (grey) at the MCM C-tier Mcm3-Mcm5 interface for each conformation. Mcm3, cyan; Mcm5, blue; AMP-PNP, red. d, Changes in ATPase site occupancy between conformations I and II correspond to movement of Mcm3/5/7 AAA+ domains and their DNA-binding loops (helix-2-insertion, H2I; presensor-1, PS1). Arrows indicate the relative movement of Mcm5 and Mcm3. The outward movement of Mcm3/Mcm7 in conformation II - associated with opening of the Mcm3/5 interface and loss of nucleotide at this ATPase site - leads to loss of the canonical contacts (described in panel g) formed between the Mcm3 H2I/PS1 loops and the leading-strand template DNA phosphate backbone. As such conformation II may reflect a partially disengaged state. e, Comparison of MCM:Dia2LRR interface between conformations I and II, demonstrating lack of conformational changes in this region. f, Model of DNA in cryo-EM density (mesh) for conformation I demonstrating distortion of the B-form DNA duplex within the MCM N-tier; similar DNA density is observed within the MCM N-tier for conformation II. Approximate trajectories of DNA strands within the MCM N-tier are shown as dotted paths. g, Engagement of the leading-strand template DNA phosphate backbone by Mcm H2I/PS1 loops in complexes that have translocated onto dsDNA is comparable to that previously observed for CMG bound to ssDNA. Contacts shown for the representative Mcm6 subunit (conformation I). Specific contacts with the DNA phosphate moieties indicated by dashed yellow lines.
Extended Data Fig. 4
Extended Data Fig. 4. Insights into Pol ε positioning within the S. cerevisiae replisome.
a, Cryo-EM density derived from multi-body refinement (top) and corresponding atomic model (bottom) of the Pol ε non-catalytic module (Pol εnon-Cat), with the exception of the Dpb2 NTD. b, Representative cryo-EM density (mesh) allowing de novo model building and adjustment of prior structures. c, Pol2-Mcm2 AAA+ domain interface. d, Interactions formed by the Mcm5 winged-helix (WH) domain with Pol εnon-Cat. The Mcm5 WH is observed to contact regions of Pol2 (dark green) in addition to the Pol2 CysB and Dpb2 OB-fold domains. Interactions depicted in c and d have not been characterised previously. e, Regions of additional cryo-EM density observed for SCFDia2-bound replisome complexes on dsDNA, visible at low map contour levels. The crystal structure of the Pol2 catalytic domain (PDB: 4M8O) has been rigid-body fitted to additional density beside the MCM channel exit. In contrast to previous structures,,, this positions the Pol2 catalytic domain at the C-tier face of CMG, adjacent to the leading-strand template, in a state that may be important for leading-strand synthesis. Additional unassigned density between Ctf4SepB, Tof1 and SCFDia2 is outlined. f, Focused view of additional density attributed to the Pol2 catalytic domain (as in e, except rotated 180°). The C-terminal residue of the Pol2 catalytic domain (residue 1186), the N-terminal residue of the Pol2 non-catalytic domain (residue 1321), and density linking the two domains are indicated.
Extended Data Fig. 5
Extended Data Fig. 5. Supporting information for the Dia2 structure and its interaction with the S. cerevisiae replisome.
a, Cryo-EM density for Cdc53-Hrt1 for two 3D classes following signal subtraction/3D subclassification, demonstrating the flexibility observed in the position of replisome-bound SCFDia2. The position of Hrt1 is shown, derived from rigid-body fitting the crystal structure of homologous CUL1-RBX1 (PDB: 1LDK). The approximate distance between Hrt1 and the primary ubiquitylation site (K29Mcm7) is indicated. b, Cryo-EM density map for Cdc53-Hrt1 with the crystal structure of homologous CUL1 (PDB: 1LDK) rigid-body fitted. c, Representative cryo-EM density (mesh) across different regions of Dia2. d, Dia2 domain architecture; TPR domain and nuclear localisation signal (NLS) as in ref. . e, f, Alternative views of the Dia2 LRR domain coloured by repeat. The F-box domain and C-terminal tail are shown for context in e. g, Comparison of Dia2 LRR domain repeats to the LRR consensus sequence. L is Leu/Val/Ile/Phe, N is Asn/Thr/Cys, x is any amino acid; we consider L0 as the first repeat residue. The core LxxLxL motif is highlighted. h, Comparison of Dia2 F-box to the consensus sequence. Exact matches coloured red, conservative differences coloured green. i, The Dia2 LRR domain (repeats 1 and 2) closely approaches the parental dsDNA (orange: leading-strand template; pink: lagging-strand template) and Csm3. The region of Csm3 upstream of the DNA-binding motif (DBM) is observed to interact with the Dia2 LRR domain β-sheet and Dia2 C-terminal tail, however cryo-EM density for this region was insufficient to identify details of this interaction. Dia2 residues which are positioned close to DNA are labelled. j, Dia2-Skp1 interaction. k, Interactions of Skp1 with alternative LRR-domain-containing F-box proteins, to show similarity with j. Human SKP1-SKP2: PDB:1FQV; human SKP1-FBXL3: PDB: 4I6J. l, Overview of interaction between Dia2 LRR domain and Mcm subunits. m, The MCM:Dia2LRR interaction does not involve the concave β-sheet surface of Dia2LRR. n, Detail of the MCM:Dia2LRR interface. Residues altered in Dia2LRR mutants are yellow. For the Mcm3 ZnF, interaction networks are subdivided into those above (A) and below (B) the position of the Mcm7 N-terminus.
Extended Data Fig. 6
Extended Data Fig. 6. Supporting data for cryo-EM investigation of S. cerevisiae replisome:SCFDia2 complexes assembled in the absence of DNA.
a, Silver-stained SDS-PAGE gel analysing 100 μL fractions taken across a 10-30% GraFix gradient. Fractions 1-17 (of 23) shown. Fractions 11-13 used for cryo-EM sample preparation are indicated. Large-scale sample preparation was performed once; similar results were observed in three independent small-scale gradient preparations. b, Representative cryo-EM micrograph. c, Representative 2D class averages, 40 nm box width. d, Angular distribution of particle orientations contributing to cryo-EM density map (Fig. 1f). e, Fourier shell correlation curve for the multi-body refinement map presented in Fig. 1f. f, Cryo-EM density map (related to Fig. 1f) coloured by local resolution. For gel source data, see Supplementary Fig. 1.
Extended Data Fig. 7
Extended Data Fig. 7. Supporting data for functional analyses of Dia2 and MCM mutants.
a, Coomassie-stained SDS-PAGE gel of purified CMG complex containing mutations in Mcm3 and Mcm5 at Dia2LRR-MCM interface b, Reaction scheme for in vitro replication of 9.7 kb forked DNA template using CMG and the indicated replication proteins. c, Reaction conducted as in panel b with wildtype or mutant CMG. Samples were separated on an alkaline agarose gel and visualised by auto-radiography. This experiment was performed twice. d, In vitro CMG ubiquitylation reaction in the absence of DNA. The indicated proteins were incubated in the presence of ubiquitin and ATP and then visualised by SDS-PAGE and immunoblotting. This experiment was repeated three times. e, Positions of residues mutated in Dia2 LRR domain. LRR repeats 12-15 are coloured and numbered as in Extended Data Fig. 5e, f. Residues are coloured according to the Dia2 mutant in which they are present; all residues shown were mutated in Dia2-13A. Dia2-8A featured the following mutations: D632A, F657A, I662A, Y665A, Q694A, I698A, T699A and Y716A. f, Coomassie-stained SDS-PAGE gel of purified SCFDia2 complexes containing Dia2LRR mutants g, In vitro Ctf4 ubiquitylation reaction. The indicated proteins were incubated in the presence of ubiquitin and ATP and then visualised by SDS-PAGE and immunoblotting. The Hrt1 immunoblot serves as a loading control for SCFDia2. This experiment was repeated twice. h, Reaction conducted as in panel d with the indicated Dia2LRR mutants. This experiment was repeated three times. i, DNA content of G1-arrested cells from experiment in Fig. 2c was monitored by flow cytometry after propidium iodide staining. The proportion of G1 cells, expressed as a percentage of the total cells, is given. For details of gating strategy and assignment of the G1 peak see Supplementary Fig. 2. For gel source data, see Supplementary Fig. 1.
Extended Data Fig. 8
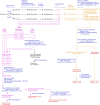
Extended Data Fig. 8. Data processing pipeline related to H. sapiens replisome:CUL2LRR1 complexes.
Each pathway describing the generation of a discrete reconstruction is given its own colour. The final reconstructions are coloured red and boxed.
Extended Data Fig. 9
Extended Data Fig. 9. Supporting data for cryo-EM investigation of H. sapiens replisome: CUL2LRR1 complexes.
a, Schematic of reconstitution approach used for preparation of replisomes bound to CUL2LRR1 for cryo-EM. A schematic of the DNA substrate used is shown with a 39 nucleotide 3′ arm and no 5′ arm. b, Silver-stained SDS-PAGE gels analysing 100 μL fractions taken across 10-30% glycerol gradients, either lacking (top) or containing (bottom) crosslinking agents. Fractions 15+16 used for cryo-EM sample preparation are indicated. This experiment was performed twice. c, Representative cryo-EM micrograph. d, Representative 2D class averages, 40 nm box width. ej, (Top) cryo-EM reconstructions coloured by local resolution according to inset keys (Bottom) angular distribution of particle orientations. e, Consensus refinement for replisome:CUL2LRR1 fully engaged. f, Consensus refinement for replisome:CUL2LRR1 where the LRR1PH domain is bound but the LRRs are disengaged. g, Consensus refinement for particles lacking CUL2LRR1. h, Multi-body refinement for AND-1:CDC45:GINS. i, Multi-body refinement for LRR1:ELOB:ELOC:CUL2:AND-1-HMG. j, Multi-body refinement for CUL2:RBX1. k, Cryo-EM density for the LRR1 LRRs. l, Cryo-EM density for the LRR1 PH domain. m, Representative cryo-EM density for a LRR1 LRR domain β-strand at 3.5 Å resolution. n, Representative cryo-EM density for a LRR1 LRR domain α-helix at 3.7 Å resolution. o, Fourier-shell correlation (FSC) curves for the various maps used in model building. p, Map-to-model FSC curves for the complete model docked into the consensus refinement for replisomes fully engaged by CUL2LRR1. For gel source data, see Supplementary Fig. 1.
Extended Data Fig. 10
Extended Data Fig. 10. Supporting information for the CUL2LRR1 structure and its interaction with the H. sapiens replisome.
a, Structural overlay of aligned model from replisomes bound to CUL2LRR1 (blue) and in the absence of CUL2LRR1 (red). b, Composite model and map representing the conformational variability of CUL2/RBX1. The model for the replisome, bound to LRR1 and ELOB-ELOC, is displayed using pipes and planks rendering and coloured according to subunit. Three representative 3D classes are displayed encompassing density for CUL2:RBX1 obtained through 3D classification without alignment. The distance between RBX1 and K29MCM7 is indicated as a dotted orange line and distances denoted in the inset key. c, Overview of the interface between the LRR1 PH domain and the replisome. Subunits interacting with the LRR1 PH domain are displayed using transparent surface rendering. Boxed regions indicate key interaction interfaces expanded in panel d. d, Detailed structural views of the interface between the LRR1 PH domain and 1: TIMELESS, 2(A): MCM6 ZnF, 2(B): dsDNA and 3: MCM2 ZnF. e, Model for the LRR1 LRRs with numbering indicating the order of the leucine-rich repeats. f, Consensus motif for the LRR1 LRRs. The sequence of each repeat is indicated with the positions of the key L0, L3 and L5 residues highlighted in red. Repeats 1 and 9 represent irregular LRRs. L is Leu/Val/Ile/Phe, N is Asn/Thr/Cys, x is any amino acidL is Leu/Val/Ile/Phe, N is Asn/Thr/Cys, x is any amino acid. g, LRR1 model docked into transparent cryo-EM density with the capping 2-stranded β-sheet highlighted in gold. h, Overview of the LRR1:ELOB:ELOC:CUL2:AND-1 interface. Models displayed docked into transparent cryo-EM density with MCM subunits visualised using surface rendering. i, Structure of the AND-1 HMG box (PDB:2D7L) docked into the AND-1-dependent cryo-EM density adjacent to ELOC and LRR1. Selected hydrophobic core residues displayed. j, Map of the replisome bound to CUL2LRR1 in the absence of AND-1 coloured according to subunit. k, Cryo-EM density of the LRR1:ELOB:ELOC:CUL2 interface obtained through multi-body refinement from particles lacking AND-1. The density attributed to the AND-1 HMG box is dependent upon AND-1. l, Overview of the MCM:LRR1LRR interface. MCM subunits displayed with additional transparent surface rendering and the order of the LRR1LRRs numbered. Red-dashed boxes indicate key interaction sites, expanded in panel m. m, Detail of the MCM:LRR1LRR interface involving contacts between the LRR1LRRs and 1 - MCM3, 2 - MCM5 ZnF and 3 - the MCM7 N-terminus. n, Model highlighting local rearrangements of MCM3 upon binding CUL2LRR1. Structures in the absence (top) and presence (bottom) of CUL2LRR1, coloured according to inset key, highlight the rearrangement of MCM3(1-9) and MCM3(164-174). o, Comparison of the CUL2LRR1-interacting regions of MCM from complexes assembled on a DNA substrate either lacking a 5′-flap (green) or containing a 15 nucleotide 5′-flap (gold, PDB: 7PFO). Complexes lacked CUL2LRR1. The r.m.s.d. between the two structures for the region shown is 0.43 Å.
Extended Data Fig. 11
Extended Data Fig. 11. Supporting data for model for regulation of CMG ubiquitylation.
a, The MCM:Dia2LRRinterface is occluded in the inactive Mcm2-7 double hexamer. The structure of the budding yeast Mcm2-7 double hexamer is shown (PDB: 5BK4 (ref. )): one Mcm2-7 hexamer is displayed as a cartoon, the other as a surface. Double-stranded DNA is coloured orange. The positions of the N-tier (N) and C-tier (C) are labelled for each hexamer. Inset: focused view of the regions of Mcm2-7 involved in interaction with the Dia2 LRR domain, demonstrating the inaccessibility of these regions to Dia2 in the context of a double hexamer. b, Reaction scheme for experiment in panel c, to monitor the suppression of CMG ubiquitylation by DNA in the absence of the indicated proteins (top), which are predicted to interact with the excluded DNA strand during lagging strand synthesis. Pif1 was omitted to block fork convergence. DNase was included after the replication step to release the replisome from DNA, which triggers CMG ubiquitylation. c, Reaction conducted as in panel b and analysed by SDS-PAGE and immunoblot. This experiment was repeated twice. d, Reaction scheme for experiment in panel e, to monitor the interaction of SCFDia2 with the replisome. e, Reaction conducted as in panel d and analysed by SDS-PAGE and immunoblot. * is rabbit IgG. This experiment was repeated twice. For gel source data, see Supplementary Fig. 1.

References

    1. Maric M, Maculins T, De Piccoli G, Labib K. Cdc48 and a ubiquitin ligase drive disassembly of the CMG helicase at the end of DNA replication. Science. 2014;346:1253596. doi: 10.1126/science.1253596. - DOI - PMC - PubMed
    1. Moreno SP, Bailey R, Campion N, Herron S, Gambus A. Polyubiquitylation drives replisome disassembly at the termination of DNA replication. Science. 2014;346:477–481. doi: 10.1126/science.1253585. - DOI - PubMed
    1. Dewar JM, Budzowska M, Walter JC. The mechanism of DNA replication termination in vertebrates. Nature. 2015;525:345–350. doi: 10.1038/nature14887. - DOI - PMC - PubMed
    1. Dewar JM, Low E, Mann M, Raschle M, Walter JC. CRL2Lrr1 promotes unloading of the vertebrate replisome from chromatin during replication termination. Genes Dev. 2017;31:275–290. doi: 10.1101/gad.291799.116. - DOI - PMC - PubMed
    1. Sonneville R, et al. CUL-2LRR-1 and UBXN-3 drive replisome disassembly during DNA replication termination and mitosis. Nat. Cell Biol. 2017;19:468–479. doi: 10.1038/ncb3500. - DOI - PMC - PubMed

Publication types