. 2021 Oct 26;12(5):e0177621.
doi: 10.1128/mBio.01776-21. Epub 2021 Oct 26.

Influenza A Virus (H1N1) Infection Induces Microglial Activation and Temporal Dysbalance in Glutamatergic Synaptic Transmission

Affiliations

Influenza A Virus (H1N1) Infection Induces Microglial Activation and Temporal Dysbalance in Glutamatergic Synaptic Transmission

Henning Peter Düsedau et al. mBio. .

Abstract

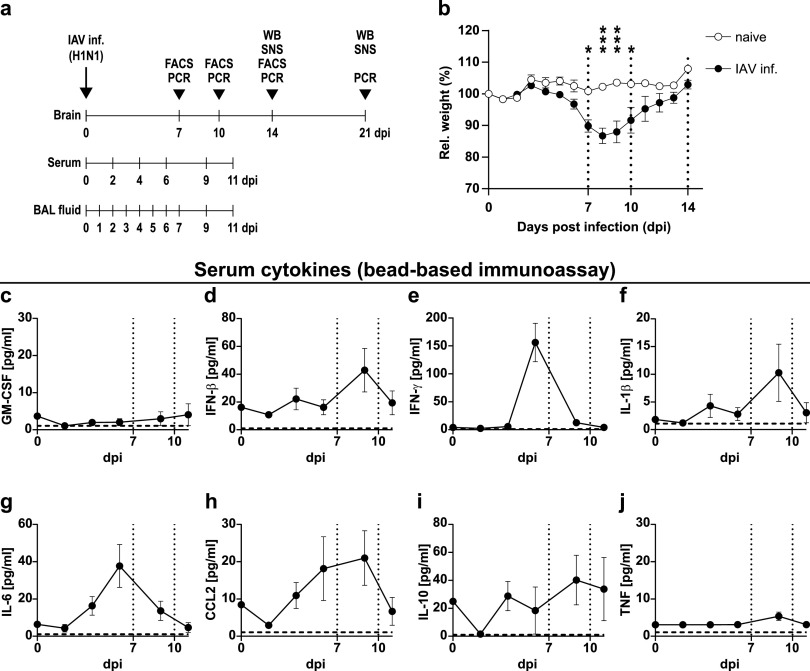
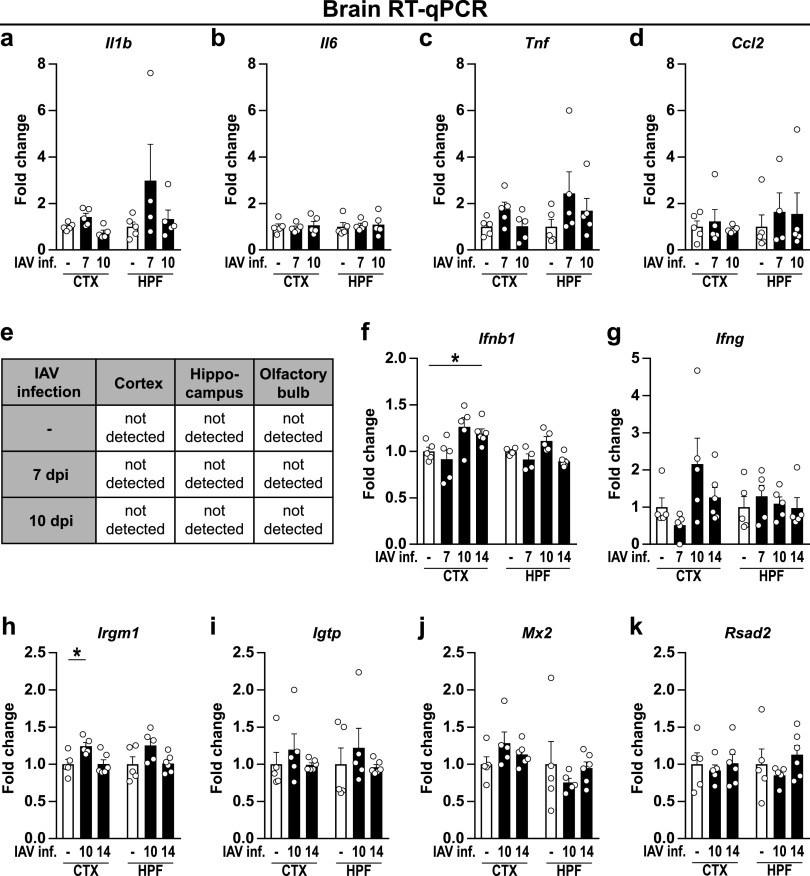
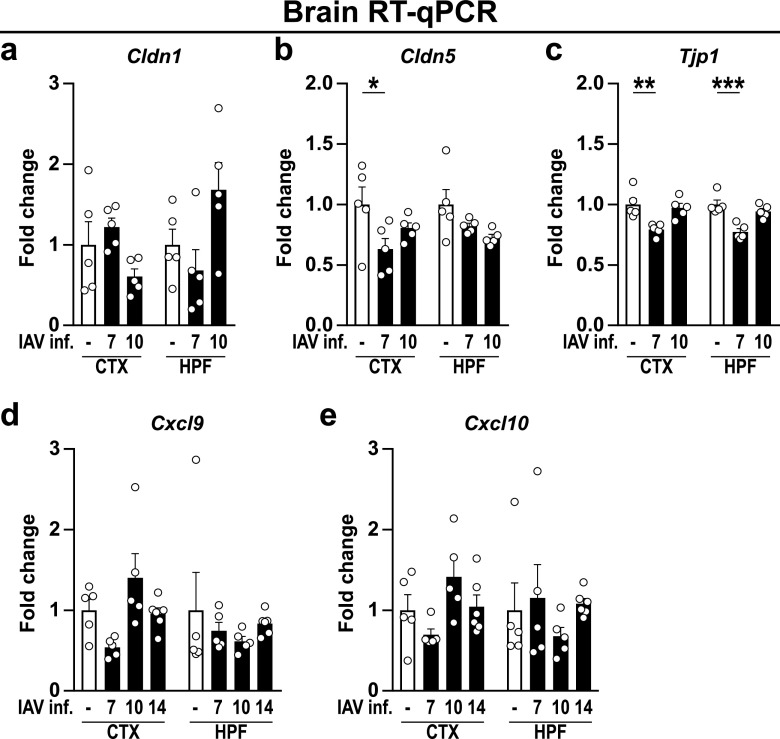
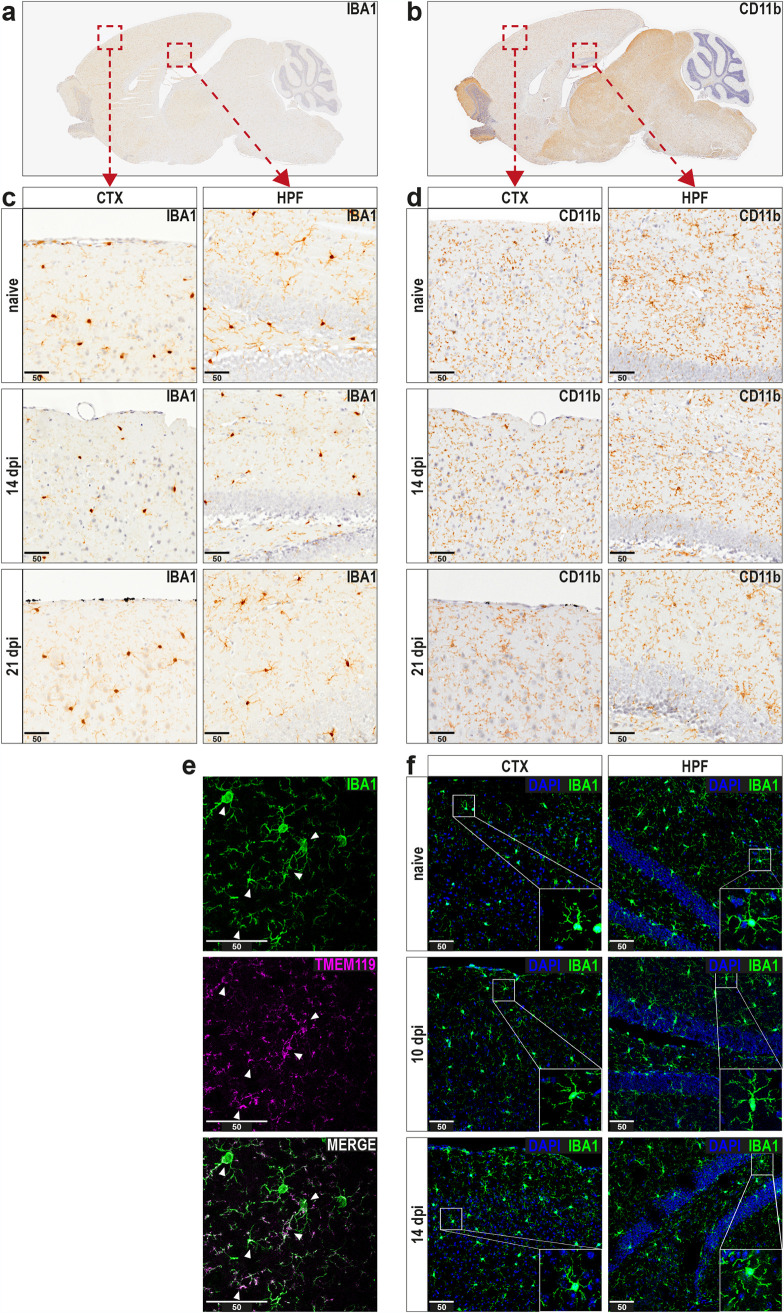
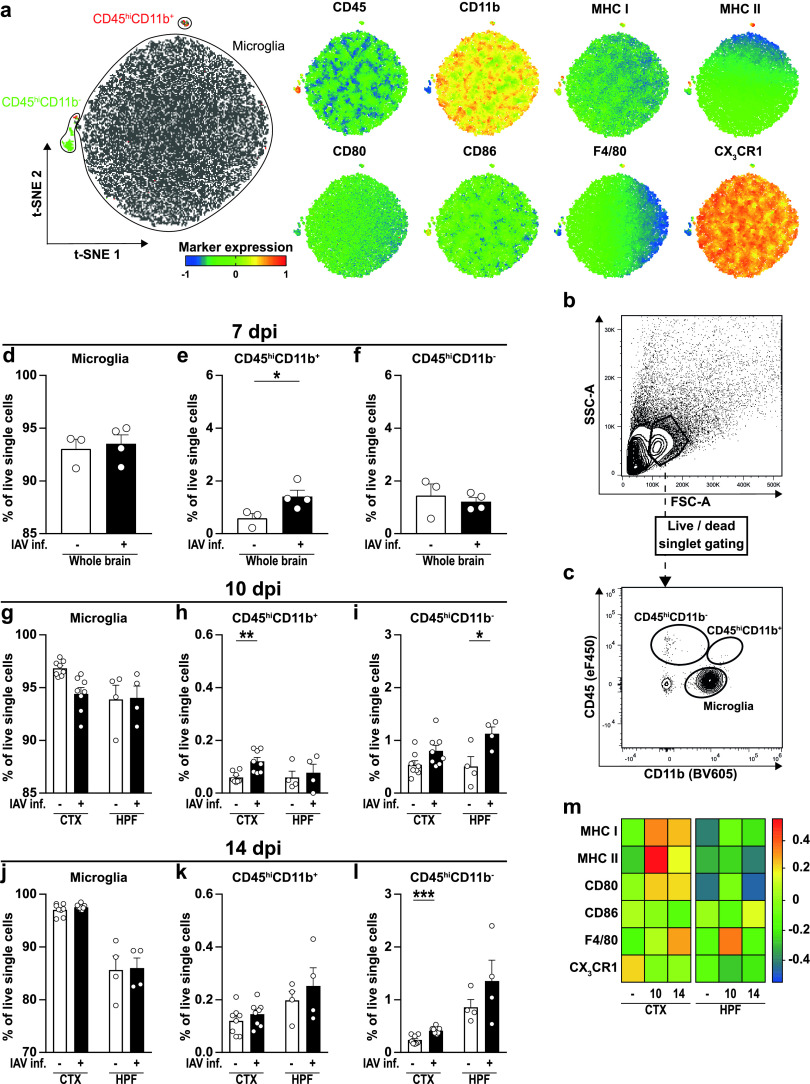
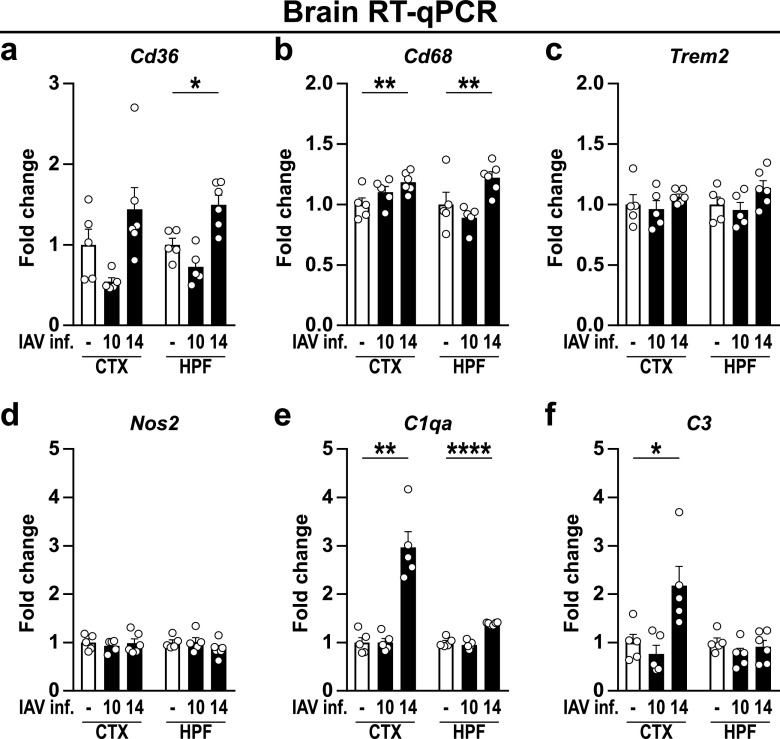
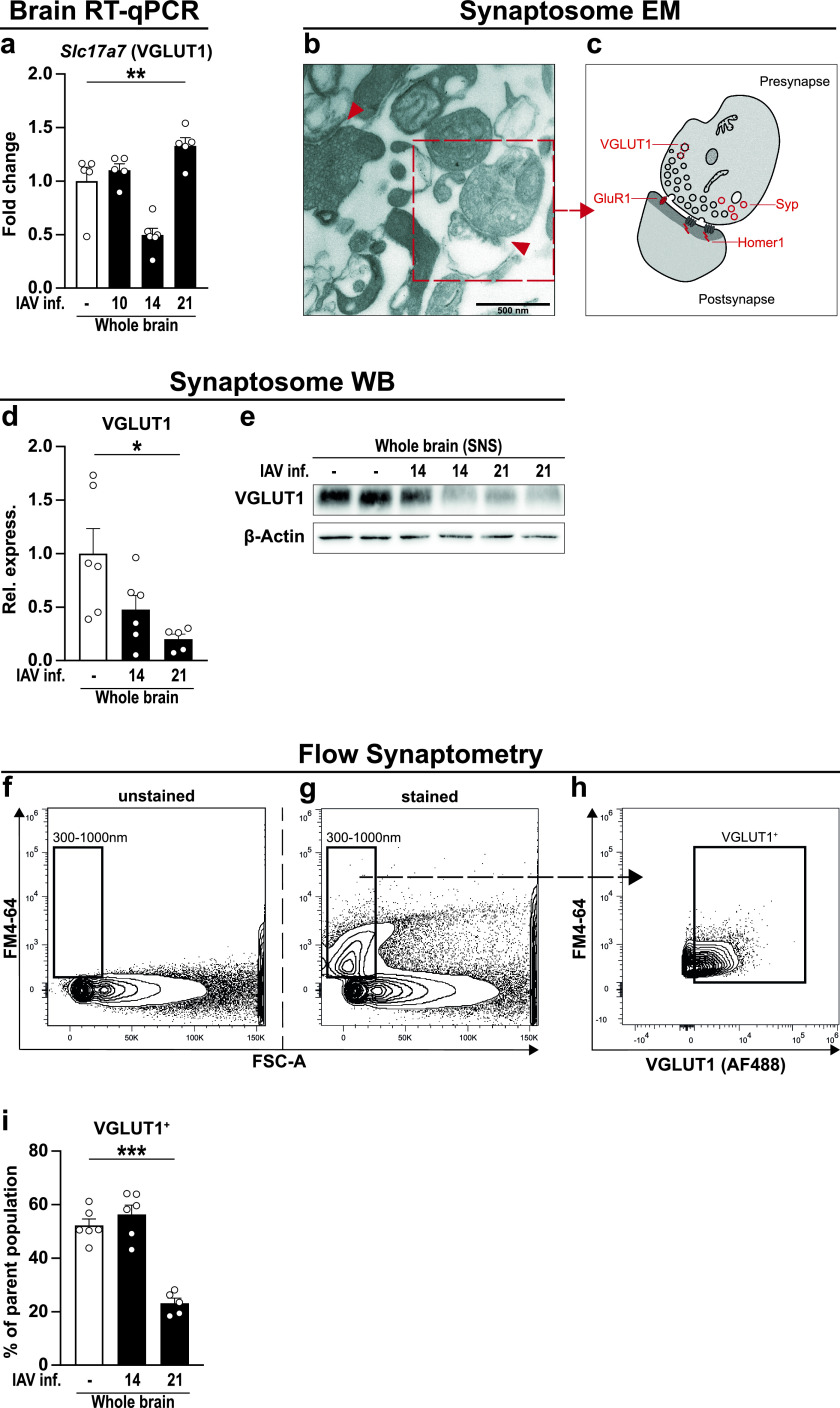
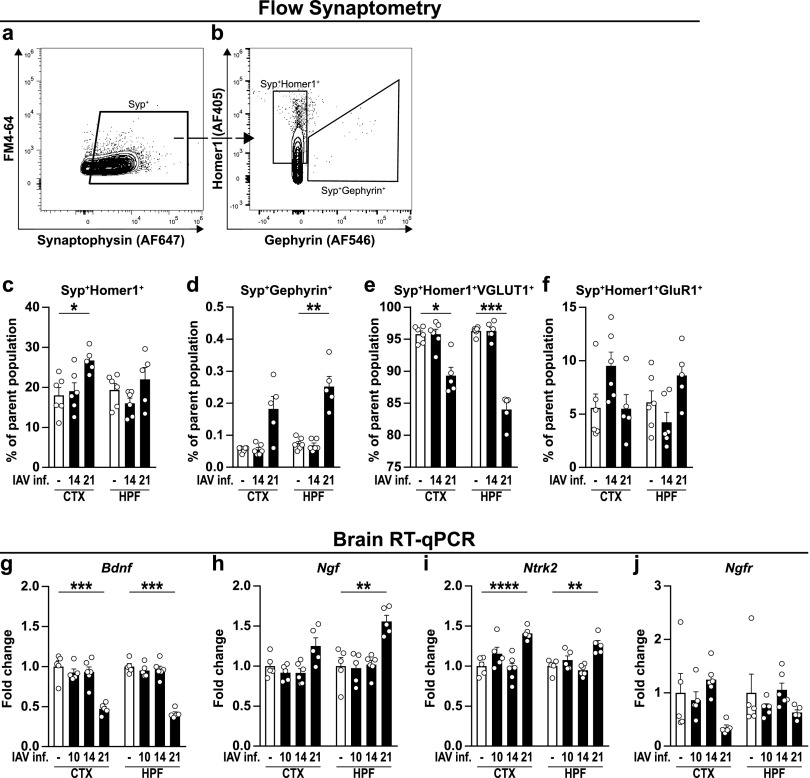
Influenza A virus (IAV) causes respiratory tract disease and is responsible for seasonal and reoccurring epidemics affecting all age groups. Next to typical disease symptoms, such as fever and fatigue, IAV infection has been associated with behavioral alterations presumably contributing to the development of major depression. Previous experiments using IAV/H1N1 infection models have shown impaired hippocampal neuronal morphology and cognitive abilities, but the underlying pathways have not been fully described. In this study, we demonstrate that infection with a low-dose non-neurotrophic H1N1 strain of IAV causes ample peripheral immune response followed by a temporary blood-brain barrier disturbance. Although histological examination did not reveal obvious pathological processes in the brains of IAV-infected mice, detailed multidimensional flow cytometric characterization of immune cells uncovered subtle alterations in the activation status of microglial cells. More specifically, we detected an altered expression pattern of major histocompatibility complex classes I and II, CD80, and F4/80 accompanied by elevated mRNA levels of CD36, CD68, C1QA, and C3, suggesting evolved synaptic pruning. To closer evaluate how these profound changes affect synaptic balance, we established a highly sensitive multiplex flow cytometry-based approach called flow synaptometry. The introduction of this novel technique enabled us to simultaneously quantify the abundance of pre- and postsynapses from distinct brain regions. Our data reveal a significant reduction of VGLUT1 in excitatory presynaptic terminals in the cortex and hippocampus, identifying a subtle dysbalance in glutamatergic synapse transmission upon H1N1 infection in mice. In conclusion, our results highlight the consequences of systemic IAV-triggered inflammation on the central nervous system and the induction and progression of neuronal alterations. IMPORTANCE Influenza A virus (IAV) causes mainly respiratory tract disease with fever and fatigue but is also associated with behavioral alterations in humans. Here, we demonstrate that infection with a low-dose non-neurotrophic H1N1 strain of IAV causes peripheral immune response followed by a temporary blood-brain barrier disturbance. Characterization of immune cells uncovered subtle alterations in the activation status of microglia cells that might reshape neuronal synapses. We established a highly sensitive multiplex flow cytometry-based approach called flow synaptometry to more closely study the synapses. Thus, we detected a specific dysbalance in glutamatergic synapse transmission upon H1N1 infection in mice. In conclusion, our results highlight the consequences of systemic IAV-triggered inflammation on the central nervous system and the induction and progression of neuronal alterations.

Keywords: flow synaptometry; glutamatergic synapse transmission; influenza; influenza A virus; interorgan communication; microglia; microglial activation; neuronal synapses; synaptosomes.


Figures

FIG 1
FIG 1
Body weight and serum cytokine levels during the course of IAV PR8/A/34(H1N1) infection. (a) Experimental model used in this study. Mice were infected i.n. with a sublethal dose of influenza A/PR8/A/34(H1N1) and sampled between day 7 and 21 post-infection (dpi) for PCR, flow cytometry (FACS), or Western blot (WB) or synaptosome (SNS) analysis. (b) Relative body weight of naive (white boxes) versus infected mice (black boxes) over the course of IAV infection. Dashed vertical lines indicate the time points of experiments in line with the experimental model depicted in panel a. (c to j) Serum cytokine levels in infected mice from 0 to 11 dpi. Dashed vertical lines indicate the time points of experiments in line with the experimental model, and dashed horizontal lines indicate the detection limit of each cytokine. Data are shown as means ± standard errors of the means (SEM), and groups in panel b were compared by multiple Student’s t tests with Holm-Sidak post hoc correction. Significant differences are indicated. *, P < 0.05; ***, P < 0.001.
FIG 2
FIG 2
Expression level of cytokines, chemokines, and interferon-stimulated genes in brains of naive and IAV-infected mice. Brains of perfused animals were dissected into cortex (CTX), hippocampal formation (HPF), and olfactory bulb (OB) according to the Allen mouse brain atlas (104) and used for RNA isolation as described in the text. (a to d) Gene expression in naive (white bars) and infected animals (black bars) is shown for cytokines and chemokines during the acute and late phase of IAV infection (7 to 10 dpi). (e) IAV load in the brain during the acute and late phase of IAV infection (7 to 10 dpi). (f and g) Type I and II interferons during IAV infection (7 to 14 dpi). (h to k) Induction of interferon-stimulated genes during the late phase of IAV infection (10 to 14 dpi). Relative gene expression was examined by RT-qPCR as described in the text, and expression of target genes was normalized to the expression level of Hprt. Subsequently, relative expression was normalized to the means of naive animals. Data are shown as means ± SEM, and groups were compared via Student's t test with Welch’s correction. Significant differences are indicated. *, P < 0.05.
FIG 3
FIG 3
Gene expression level of blood-brain barrier-associated proteins upon infection with IAV. Brains were dissected into cortex (CTX) and hippocampal formation (HPF) as described in the text. (a to c) The gene expression levels of the tight junction proteins Claudin-1 (Cldn1), Claudin-5 (Cldn5), and ZO-1 (Tjp1) were examined in naive (white bars) and infected animals (black bars) during the acute and late phase of IAV infection (7 to 10 dpi). (d and e) Expression levels of chemokines Cxcl9 and Cxcl10 during IAV infection (7 to 14 dpi). Relative gene expression was determined by RT-qPCR as described in the text, and expression of target genes was normalized to the expression level of Hprt. Subsequently, relative expression was normalized to the means of naive animals. Data are shown as means ± SEM, and groups were compared via Student's t test with Welch’s correction. Significant differences are indicated. *, P < 0.05; **, P < 0.01; ***, P < 0.001.
FIG 4
FIG 4
Histopathological and immunohistochemical examination of brain tissue does not reveal alterations upon infection with IAV. (a and b) Histopathological overview of representative sagittal paraffin sections from brains of naive mice stained against IBA1 or CD11b. (c and d) Panels show the cortex (CTX, left) and hippocampal formation region (HPF, right) from naive and infected mice (14 and 21 dpi) upon staining for IBA1 or CD11b. (e) Immunohistochemical preparation of cryosections shows representative images of microglial cells stained with antibodies for IBA1 and TMEM119, and white arrows indicate strongly overlapping signals in both channels. (f) Comparison of microglial morphology in cryosections from naive (top) and IAV-infected (middle and bottom) mice during the late phase of IAV infection (10 to 14 dpi). Sections were stained with antibodies against IBA1, and confocal microscopy images were generated for cortex (CTX, left) and hippocampal formation (HPF, right). Insets in bottom right corners show selected microglial cells with higher detail. Scale bars, 50 μm.
FIG 5
FIG 5
Characterization of immune cell subsets and microglial activation in the brains of IAV-infected animals. Immune cells were isolated from perfused brains of naive and infected animals as described in the text and subjected to flow cytometric analysis. (a) Unsupervised clustering of immune cell subsets was performed by t-distributed stochastic neighbor embedding (t-SNE), and cells within clusters were subsequently identified by manual gating. Further, differential expression of surface markers CD45, CD11b, major histocompatibility complex (MHC) classes I and II, CD80, CD86, F4/80, and CX3CR1 are shown for the generated clusters. (b and c) Representative strategy for manual gating. First, cells were selected based on the forward-scatter/side-scatterplot (FSC/SSC) before exclusion of dead cells as well as doublets (not shown). Immune cell populations then were separated by their expression of the surface markers CD45 and CD11b into brain-resident CD45low CD11b+ microglial cells and recruited CD45hi CD11b or CD45hi CD11b+ cells. (d to f) Bar charts show the frequencies of identified immune cell populations in the brains of naive (white bars) and IAV-infected animals (black bars) at 7 dpi. (g to l) Bar charts show the frequencies of identified immune cell populations in specific brain regions of naive (white bars) and IAV-infected animals (black bars) at 10 and 14 dpi. (m) Heat map plot of relative microglial surface expression of MHC I, MHC II, CD80, CD86, F4/80, and CX3CR1 in naive and infected mice at 10 and 14 dpi. Median fluorescence intensities of expressed markers were normalized to their overall mean, and data were plotted using R with “lattice” package. Data are shown as means ± SEM, and groups were compared via Student's t test with Welch’s correction. Significant differences are indicated. *, P <  0.05; *** P < 0.001.
FIG 6
FIG 6
Gene expression levels of microglial activation-related genes and complement factors in brains of naive and IAV-infected mice. Gene expression in naive (white bars) and infected (black bars) animals during the late phase of IAV infection (10 to 14 dpi) is shown for microglial activation-related genes (a to d) and complement factors (e and f). Relative gene expression was examined by RT-qPCR as described in the text, and expression of target genes was normalized to the expression level of Hprt. Subsequently, relative expression was normalized to the means of naive animals. Data are shown as means ± SEM, and groups were compared via Student's t test with Welch’s correction. Significant differences are indicated. *, P < 0.05; **, P < 0.01; ****, P < 0.0001.
FIG 7
FIG 7
New tool to analyze synaptic proteins via flow cytometry. (a) Gene expression of VGLUT1 (Slc17a7) was analyzed in whole-brain homogenate of naive (white bars) and IAV-infected mice at 10, 14, and 21 dpi (black bars). Relative gene expression was examined by RT-qPCR as described in the text, and expression of the target gene was normalized to the expression level of Hprt. Subsequently, relative expression was normalized to the mean of naive animals. Groups were compared via Student's t test with Welch’s correction. (b) Synaptosomes were isolated from brain regions of perfused animals as described in the text, and the synaptosomal fraction (31) was subjected to electron microscopy. Red arrows indicate intact synapses formed by a pre- and postsynaptic compartment. Scale bar in the bottom left corner indicates 500 nm. (c) Graphical illustration of synaptosome selected in panel b. Presynaptic nerve endings still contain synaptic vesicles and mitochondria, whereas postsynaptic domains are characterized by their region of high postsynaptic density (PSD). (d and e) Protein content of VGLUT1 from synaptosomes of whole-brain homogenate was assessed via Western blotting. Bar charts show the relative optical density of the protein bands from naive (white bars) and infected (black bars) animals at 14 and 21 dpi upon normalization to β-actin expression. Values were further normalized to the mean of naive animals. Groups were compared via one-way ANOVA with Holm-Sidak post hoc correction. (f to h) Isolated synaptosomes were subjected to flow cytometry, and the representative gating strategy is shown. (f) First, a gate with a size range from 300 to 1,000 nm was established in the FSC channel using silica beads. (g) Second, separation of biological particles from residues in the buffer was facilitated using the styryl dye FM4-64 that integrates into the lipid membranes of biological organelles. FSC-triggered detection then was replaced by fluorescence-triggered detection with FM4-64 in the BL3 channel with a fluorescence threshold set above the noise at 0.3 × 103 (not shown). (h) Lastly, events detected in the size range of 300 to 1,000 nm were further gated for their expression of VGLUT1. (i) Bar chart shows the frequency of VGLUT1+ events in the brains of naive (white bars) and IAV-infected animals (black bars) at 14 and 21 dpi. In all cases, data are shown as means ± SEM and significant differences are indicated. *, P < 0.05; ** P, < 0.01; *** P, < 0.001; **** P, < 0.0001.
FIG 8
FIG 8
Flow cytometric synaptosome analysis and gene expression of neurotrophins and neurotrophin receptors in naive and IAV-infected mice. (a to f) Synaptosomes were isolated from cortex (CTX) and hippocampal formation (HPF) of naive and IAV-infected mice and subjected to further flow cytometric analysis as shown in Fig. 7. (a and b) After size gating and removal of unspecific events via fluorescence-triggered detection (not shown), Synaptophysin+ (Syp+) events were selected and subsequently gated for Homer1+ or Gephyrin+, respectively. (c and d) Bar charts show the frequencies of Syp+ Homer1+ and Syp+ Gephyrin+ subpopulations from naive (white bars) and IAV-infected animals (black bars) at 14 and 21 dpi. (e and f) Intact synaptosomes from excitatory synapses consisting of a pre- and postsynaptic terminal (Syp+ Homer1+) were further examined for their expression of VGLUT1 and GluR1. (g to j) RNA was isolated from brains of perfused animals as described in the text. Relative gene expression levels of BDNF (Bdnf), NGF (Ngf), TrkB (Ntrk2), and p75NTR (Ngfr) were examined by RT-qPCR at different time points after IAV infection (10 to 21 dpi). Expression of target genes was normalized to the expression level of Hprt. Subsequently, relative expression was normalized to the means of naive animals. For all graphs, data are shown as means ± SEM, and groups were compared via Student's t test with Welch’s correction. Significant differences are indicated. *, P <  0.05; **, P < 0.01; ***, P < 0.001; ****, P <  0.0001.

References

    1. Kreijtz JHCM, Fouchier RAM, Rimmelzwaan GF. 2011. Immune responses to influenza virus infection. Virus Res 162:19–30. doi:10.1016/j.virusres.2011.09.022. - DOI - PubMed
    1. Centers for Disease Control and Prevention. 2019. Seasonal influenza (flu): background and epidemiology. https://www.cdc.gov/flu/professionals/acip/background-epidemiology.htm.
    1. Thompson WW, Weintraub E, Dhankhar P, Cheng P-Y, Brammer L, Meltzer MI, Bresee JS, Shay DK. 2009. Estimates of US influenza-associated deaths made using four different methods. Influenza Other Respir Viruses 3:37–49. doi:10.1111/j.1750-2659.2009.00073.x. - DOI - PMC - PubMed
    1. European Centre for Disease Prevention and Control. 2020. European Centre for Disease Prevention and Control Factsheet about seasonal influenza. https://www.ecdc.europa.eu/en/seasonal-influenza/facts/factsheet. Accessed 12 April 2021.
    1. European Centre for Disease Prevention and Control. 2020. Seasonal influenza 2019-2020. In ECDC (ed), Annual epidemiological report for 2019. European Centre for Disease Prevention and Control, Stockholm, Sweden.

Publication types

LinkOut - more resources