. 2021 Oct 26;21(1):1101.
doi: 10.1186/s12879-021-06785-2.

Coronavirus seasonality, respiratory infections and weather

Affiliations

Coronavirus seasonality, respiratory infections and weather

G L Nichols et al. BMC Infect Dis. .

Abstract

Background: The survival of coronaviruses are influenced by weather conditions and seasonal coronaviruses are more common in winter months. We examine the seasonality of respiratory infections in England and Wales and the associations between weather parameters and seasonal coronavirus cases.

Methods: Respiratory virus disease data for England and Wales between 1989 and 2019 was extracted from the Second-Generation Surveillance System (SGSS) database used for routine surveillance. Seasonal coronaviruses from 2012 to 2019 were compared to daily average weather parameters for the period before the patient's specimen date with a range of lag periods.

Results: The seasonal distribution of 985,524 viral infections in England and Wales (1989-2019) showed coronavirus infections had a similar seasonal distribution to influenza A and bocavirus, with a winter peak between weeks 2 to 8. Ninety percent of infections occurred where the daily mean ambient temperatures were below 10 °C; where daily average global radiation exceeded 500 kJ/m2/h; where sunshine was less than 5 h per day; or where relative humidity was above 80%. Coronavirus infections were significantly more common where daily average global radiation was under 300 kJ/m2/h (OR 4.3; CI 3.9-4.6; p < 0.001); where average relative humidity was over 84% (OR 1.9; CI 3.9-4.6; p < 0.001); where average air temperature was below 10 °C (OR 6.7; CI 6.1-7.3; p < 0.001) or where sunshine was below 4 h (OR 2.4; CI 2.2-2.6; p < 0.001) when compared to the distribution of weather values for the same time period. Seasonal coronavirus infections in children under 3 years old were more frequent at the start of an annual epidemic than at the end, suggesting that the size of the susceptible child population may be important in the annual cycle.

Conclusions: The dynamics of seasonal coronaviruses reflect immunological, weather, social and travel drivers of infection. Evidence from studies on different coronaviruses suggest that low temperature and low radiation/sunlight favour survival. This implies a seasonal increase in SARS-CoV-2 may occur in the UK and countries with a similar climate as a result of an increase in the R0 associated with reduced temperatures and solar radiation. Increased measures to reduce transmission will need to be introduced in winter months for COVID-19.

Keywords: COVID-19; Children; Climate; Coronavirus; Pandemic; Respiratory viruses; Seasonality; Surveillance; Virus survival; Weather.


Conflict of interest statement

All authors have indicated that they have no competing interests other than the funding from the National Institute for Health Research.

Figures

Fig. 1
Fig. 1
Weekly seasonality of respiratory viruses 1989–2019. Cases per week of laboratory diagnosed viral infections reported in England and Wales. There are changes in laboratory surveillance over 31 years and includes changes resulting from improved diagnostic tests, improved sampling and testing, reductions in disease, introductions in vaccine, and improved surveillance as a result of the H1N1 outbreak in 2009. Many pathogens have an annual cycle, some have a biannual cycle (parainfluenza 1; parainfluenza 2; parainfluenza 4; influenza B), some are relatively unseasonal (adenovirus; poliovirus; rhinovirus), and some have a more sporadic nature (influenza A H3N2; echovirus; coxsackie A; coxsackie B
Fig. 2
Fig. 2
Cases per week for diagnosed respiratory viruses in England and Wales 1989–2019 and the percentage of cases per week that are in the 0–2 years old age group. a Coronavirus; b influenza A; c respiratory syncytial virus (RSV); d influenza B; e human metapneumovirus; f human bocavirus; g adenovirus; h rhinovirus. Weekly coronavirus cases and the cases as a percentage of all cases for i coronavirus cases 2009–2019; j influenza A cases 2008–2019 (covering the H1N1 outbreak in 2009); k Influenza cases 1989–2007
Fig. 3
Fig. 3
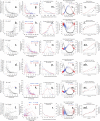
Seasonal coronavirus infections based on the week of infection and daily measures of the average weather for England and Wales between 2012 and 2019. af Coronavirus cases per week as a percentage of all cases and mean of weather parameters over the week. Each is lagged by a different number of weeks before the specimen date; a global radiation (kJ/m2/h), b relative humidity (%), c air temperature (°C), d sunshine (hours per day), e dewpoint temperature (°C), f precipitation (mm/hour); gl Coronavirus cases as a percentage of cases per year and weekly mean of weather parameters separated into periods when the cases were declining (Down—days of year 43–224 and Up—days of year 225–366 and 1–42). g Global radiation (kJ/m2/h), h relative humidity (%), i air temperature (°C), j sunshine (hours per day), k dewpoint temperature (°C), l precipitation (mm/h); mr Coronavirus case numbers split by quantiles of the weather parameters with a 2-week lag. m Global radiation (kJ/m2/h), n relative humidity (%), o air temperature (°C), p sunshine (hours per day), q dewpoint temperature (°C), r precipitation (mm/h); sx Coronavirus cases by day of year and weather parameters with a 2-week lag. s Global radiation (kJ/m2/h), t relative humidity (%), u air temperature (°C), v sunshine (hours per day), w dewpoint temperature (°C), x precipitation (mm/h). yad Average weather parameters in the previous 28 days were split into ten quantiles based on the weather values. y Global radiation (kJ/m2/h), z relative humidity (%), aa air temperature (°C), ab sunshine (hours per day), ac dewpoint temperature (°C), ad precipitation (mm/h)
Fig. 4
Fig. 4
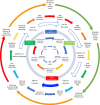
Some of the drivers influencing the seasonality of UK respiratory infections. Seasonal coronavirus infections are thought to be influenced by the size of the susceptible child population, which drives an annual epidemic in children that, in turn, infects susceptible adults. The timing of the epidemic is influenced by changing transmission dynamics through the year. Low temperature, low humidity, short daylength and low UV all probably contribute to better survival of the virus in winter months than summer, pushing the immunity driven epidemic to occur in the winter months. Travel abroad introduces new viruses that differ from the currently circulating strains. Travel variation will differ by country and holidays/festivals (including school/university holidays) (Additional file 1: S5). Many social and public interactions that contribute to infection are relatively constant through the year. In addition to these drivers there will be the gradual increase in susceptibility as a result of declining antibody levels and genetic drift within the viruses

References

    1. Shi M, Lin XD, Chen X, Tian JH, Chen LJ, Li K, Wang W, Eden JS, Shen JJ, Liu L, et al. The evolutionary history of vertebrate RNA viruses. Nature. 2018;556(7700):197–202. doi: 10.1038/s41586-018-0012-7. - DOI - PubMed
    1. Wertheim JO, Chu DK, Peiris JS, Kosakovsky Pond SL, Poon LL. A case for the ancient origin of coronaviruses. J Virol. 2013;87(12):7039–7045. doi: 10.1128/JVI.03273-12. - DOI - PMC - PubMed
    1. Wong ACP, Li X, Lau SKP, Woo PCY. Global epidemiology of bat coronaviruses. Viruses. 2019;11(2):174. doi: 10.3390/v11020174. - DOI - PMC - PubMed
    1. Lu R, Zhao X, Li J, Niu P, Yang B, Wu H, Wang W, Song H, Huang B, Zhu N, et al. Genomic characterisation and epidemiology of 2019 novel coronavirus: implications for virus origins and receptor binding. Lancet. 2020;395(10224):565–574. doi: 10.1016/S0140-6736(20)30251-8. - DOI - PMC - PubMed
    1. Zhou P, Yang XL, Wang XG, Hu B, Zhang L, Zhang W, Si HR, Zhu Y, Li B, Huang CL, et al. A pneumonia outbreak associated with a new coronavirus of probable bat origin. Nature. 2020;579(7798):270–273. doi: 10.1038/s41586-020-2012-7. - DOI - PMC - PubMed