. 2021 Oct 26;18(1):154.
doi: 10.1186/s12984-021-00949-6.

Smoothness metrics for reaching performance after stroke. Part 1: which one to choose?

Affiliations

Smoothness metrics for reaching performance after stroke. Part 1: which one to choose?

Mohamed Irfan Mohamed Refai et al. J Neuroeng Rehabil. .

Abstract

Background: Smoothness is commonly used for measuring movement quality of the upper paretic limb during reaching tasks after stroke. Many different smoothness metrics have been used in stroke research, but a 'valid' metric has not been identified. A systematic review and subsequent rigorous analysis of smoothness metrics used in stroke research, in terms of their mathematical definitions and response to simulated perturbations, is needed to conclude whether they are valid for measuring smoothness. Our objective was to provide a recommendation for metrics that reflect smoothness after stroke based on: (1) a systematic review of smoothness metrics for reaching used in stroke research, (2) the mathematical description of the metrics, and (3) the response of metrics to simulated changes associated with smoothness deficits in the reaching profile.

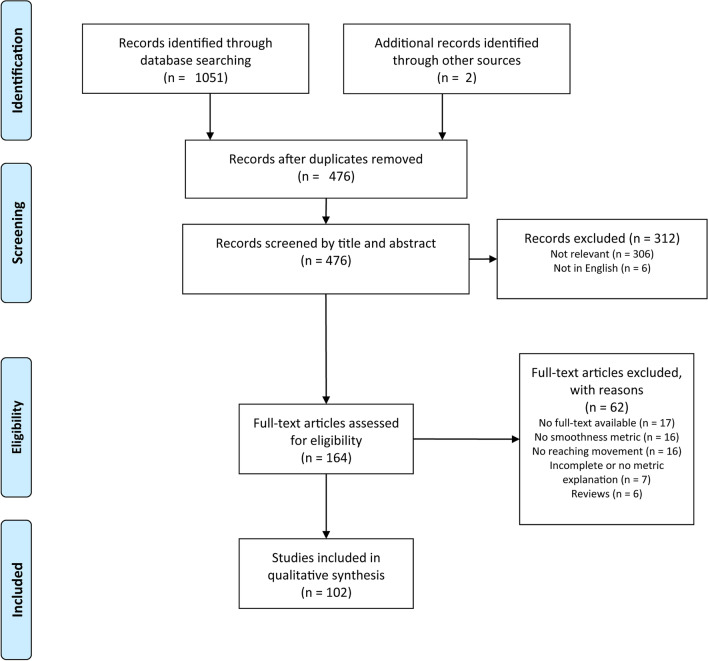
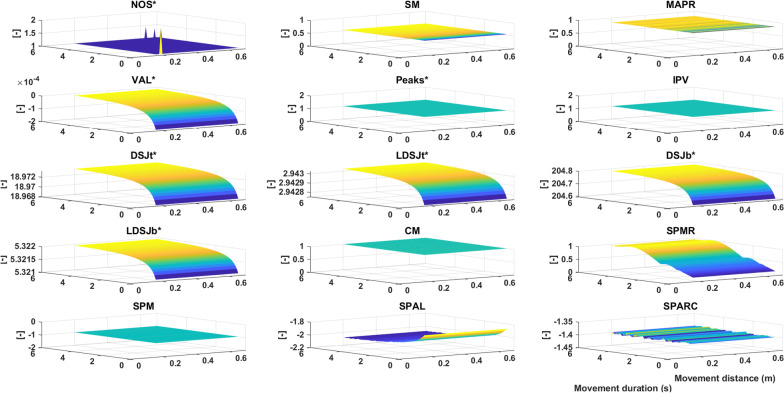
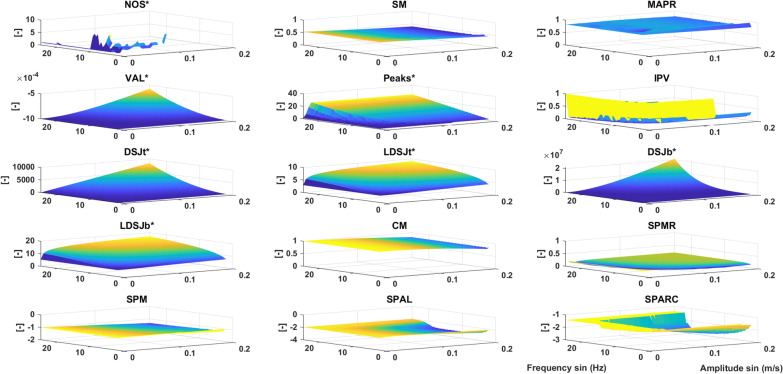
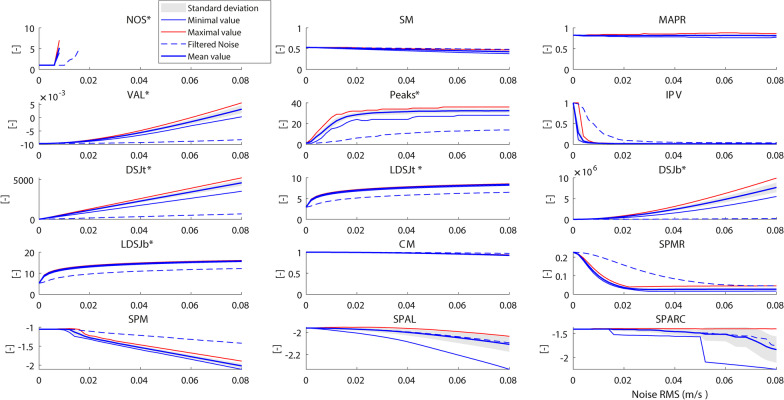
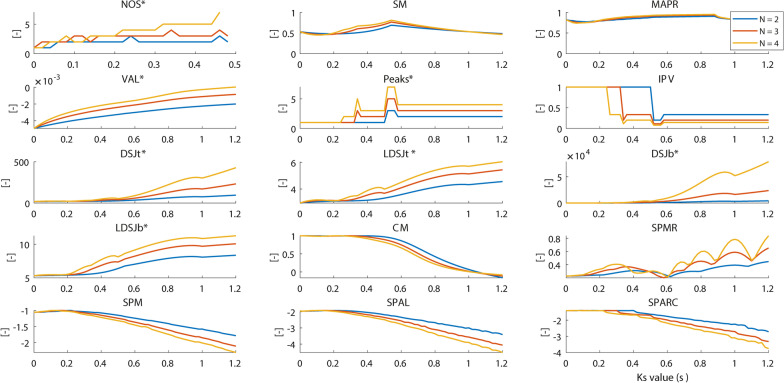
Methods: The systematic review was performed by screening electronic databases using combined keyword groups Stroke, Reaching and Smoothness. Subsequently, each metric identified was assessed with mathematical criteria regarding smoothness: (a) being dimensionless, (b) being reproducible, (c) being based on rate of change of position, and (d) not being a linear transform of other smoothness metrics. The resulting metrics were tested for their response to simulated changes in reaching using models of velocity profiles with varying reaching distances and durations, harmonic disturbances, noise, and sub-movements. Two reaching tasks were simulated; reach-to-point and reach-to-grasp. The metrics that responded as expected in all simulation analyses were considered to be valid.

Results: The systematic review identified 32 different smoothness metrics, 17 of which were excluded based on mathematical criteria, and 13 more as they did not respond as expected in all simulation analyses. Eventually, we found that, for reach-to-point and reach-to-grasp movements, only Spectral Arc Length (SPARC) was found to be a valid metric.

Conclusions: Based on this systematic review and simulation analyses, we recommend the use of SPARC as a valid smoothness metric in both reach-to-point and reach-to-grasp tasks of the upper limb after stroke. However, further research is needed to understand the time course of smoothness measured with SPARC for the upper limb early post stroke, preferably in longitudinal studies.

Keywords: Reaching; Review; Simulation analyses; Smoothness; Stroke.


Conflict of interest statement

The authors report no competing interests.

Figures

Fig. 1
Fig. 1
PRISMA flow chart
Fig. 2
Fig. 2
Shape simulation. The vertical axis represents the metric value decreasing from yellow to blue. The horizontal axes represent the movement duration and movement distance. Metrics included are NOS* (number of sub-movements), SM (speed metric), MAPR (movement arrest period ratio), VAL* (velocity arc length), Peaks* (number of peaks), IPV (inverse of number of peaks and valleys), DSJt* and DSJb* (Dimensionless squared jerk), LDSJb* and LDSJt* (log of DSJt* and DSJb*), CM (correlation metric), SPMR (spectral metric), SPM (spectral method), SPAL (spectral arc length 2012), and SPARC (spectral arc length). By definition, the metrics with a * increase with decreasing smoothness
Fig. 3
Fig. 3
Harmonic Disturbances. The vertical axis represents the metric value decreasing from yellow to blue. Metrics included are NOS* (number of sub-movements), SM (speed metric), MAPR (movement arrest period ratio), VAL* (velocity arc length), Peaks* (number of peaks), IPV (inverse of number of peaks and valleys), DSJt* and DSJb* (Dimensionless squared jerk), LDSJb* and LDSJt* (log of DSJt* and DSJb*), CM (correlation metric), SPMR (spectral metric), SPM (spectral method), SPAL (spectral arc length 2012), and SPARC (spectral arc length). By definition, the metrics with a * increase with decreasing smoothness
Fig. 4
Fig. 4
Measurement Noise. The thick blue line represents the mean value of 25 different realizations of the noise for each measurement noise level added, and the shaded area is the corresponding standard deviation. The dotted black lines denote the minimum and maximum values of the metric found at that RMS value. The dashed blue line shows mean values of the filtered noise sets. Metrics included are NOS* (number of sub-movements), SM (speed metric), MAPR (movement arrest period ratio), VAL* (velocity arc length), Peaks* (number of peaks), IPV (inverse of number of peaks and valleys), DSJt* and DSJb* (Dimensionless squared jerk), LDSJb* and LDSJt* (log of DSJt* and DSJb*), CM (correlation metric), SPMR (spectral metric), SPM (spectral method), SPAL (spectral arc length 2012), and SPARC (spectral arc length). By definition, the metrics with a * increase with decreasing smoothness
Fig. 5
Fig. 5
Sub-movements simulation. The colours denote the number of sub-movements. The horizontal axis represents the lag between two sub-movements. Metrics included are NOS* (number of sub-movements), SM (speed metric), MAPR (movement arrest period ratio), VAL* (velocity arc length), Peaks* (number of peaks), IPV (inverse of number of peaks and valleys), DSJt* and DSJb* (Dimensionless squared jerk), LDSJb* and LDSJt* (log of DSJt* and DSJb*), CM (correlation metric), SPMR (spectral metric), SPM (spectral method), SPAL (spectral arc length 2012), and SPARC (spectral arc length). By definition, the metrics with a * increase with decreasing smoothness

References

    1. Balasubramanian S, Wei R, Herman R, He J. Robot-measured performance metrics in stroke rehabilitation. Proc 2009 ICME Int Conf Complex Med Eng C 2009. 2009.
    1. Marini F, Hughes CML, Squeri V, Doglio L, Moretti P, Morasso P, et al. Robotic wrist training after stroke: adaptive modulation of assistance in pediatric rehabilitation. Rob Auton Syst. 2017;91:169–178. doi: 10.1016/j.robot.2017.01.006. - DOI
    1. Teulings HL, Contreras-Vidal JL, Stelmach GE, Adler CH. Parkinsonism reduces coordination of fingers, wrist, and arm in fine motor control. Exp Neurol. 1997;146:159–170. doi: 10.1006/exnr.1997.6507. - DOI - PubMed
    1. Balasubramanian S, Melendez-Calderon A, Burdet E. A robust and sensitive metric for quantifying movement smoothness. IEEE Trans Biomed Eng. 2012;59:2126–2136. doi: 10.1109/TBME.2011.2179545. - DOI - PubMed
    1. van Kordelaar J, van Wegen EEH, Kwakkel G. Impact of time on quality of motor control of the paretic upper limb after stroke. Arch Phys Med Rehabil. 2014;95:338–344. doi: 10.1016/j.apmr.2013.10.006. - DOI - PubMed

Publication types