. 2022 Sep;71(9):1831-1842.
doi: 10.1136/gutjnl-2021-324546. Epub 2021 Oct 26.

Single-cell sequencing unveils distinct immune microenvironments with CCR6-CCL20 crosstalk in human chronic pancreatitis

Affiliations

Single-cell sequencing unveils distinct immune microenvironments with CCR6-CCL20 crosstalk in human chronic pancreatitis

Bomi Lee et al. Gut. 2022 Sep.

Abstract

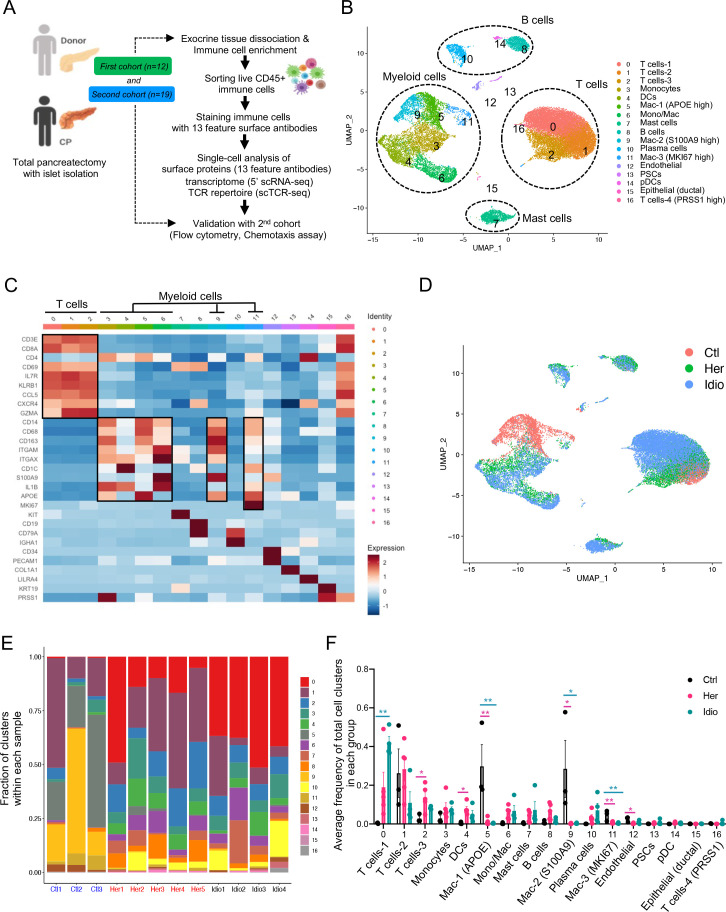
Objective: Chronic pancreatitis (CP) is a potentially fatal disease of the exocrine pancreas, with no specific or effective approved therapies. Due to difficulty in accessing pancreas tissues, little is known about local immune responses or pathogenesis in human CP. We sought to characterise pancreatic immune responses using tissues derived from patients with different aetiologies of CP and non-CP organ donors in order to identify key signalling molecules associated with human CP.

Design: We performed single-cell level cellular indexing of transcriptomes and epitopes by sequencing and T-cell receptor (TCR) sequencing of pancreatic immune cells isolated from organ donors, hereditary and idiopathic patients with CP who underwent total pancreatectomy. We validated gene expression data by performing flow cytometry and functional assays in a second patient with CP cohort.

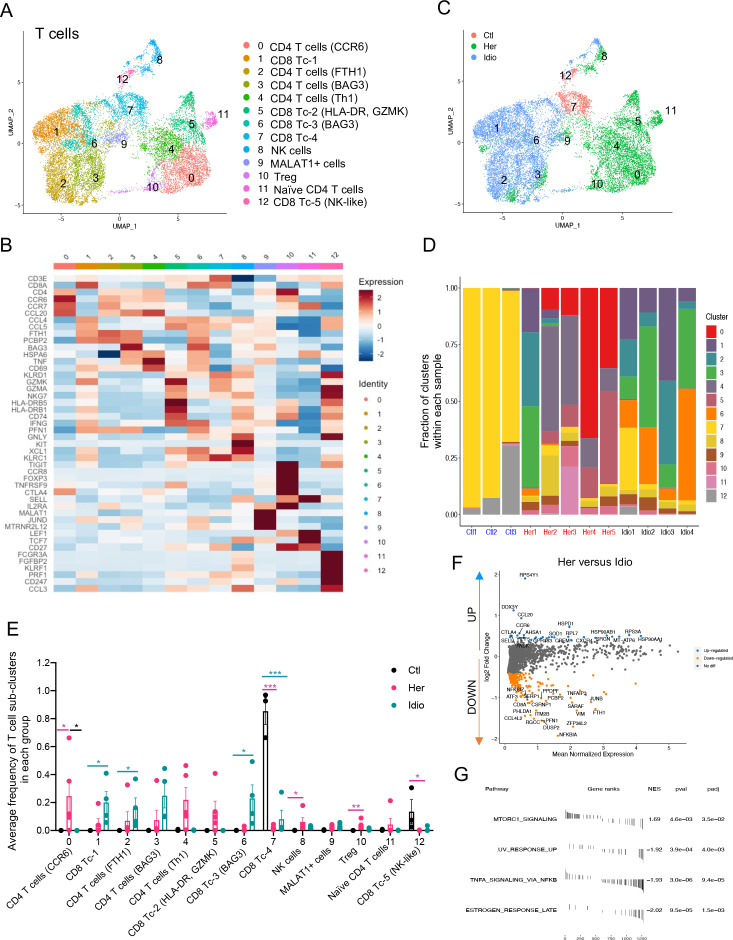
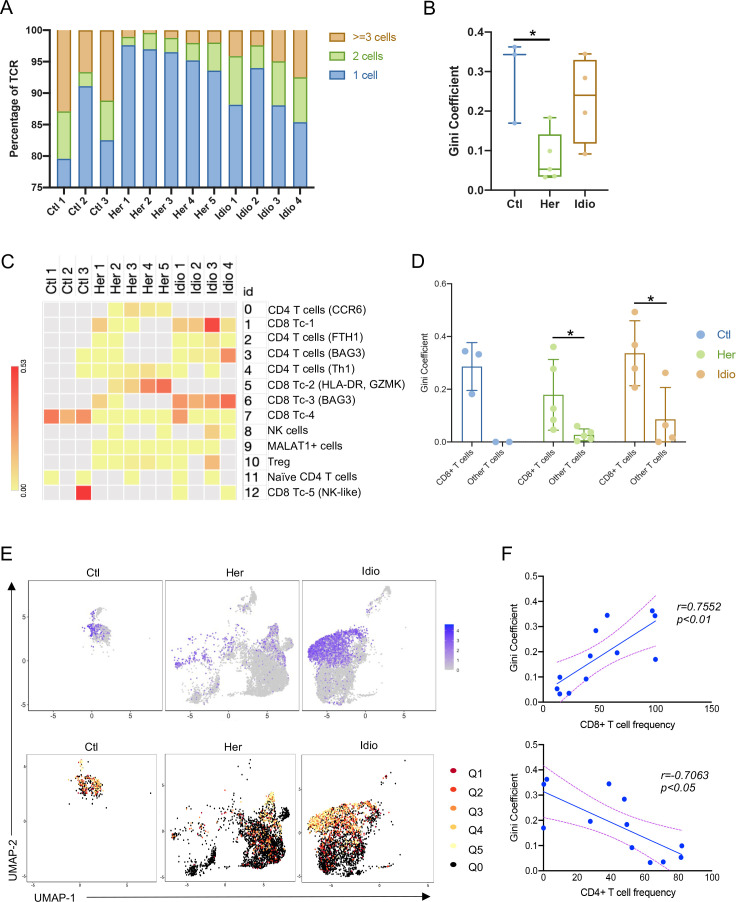
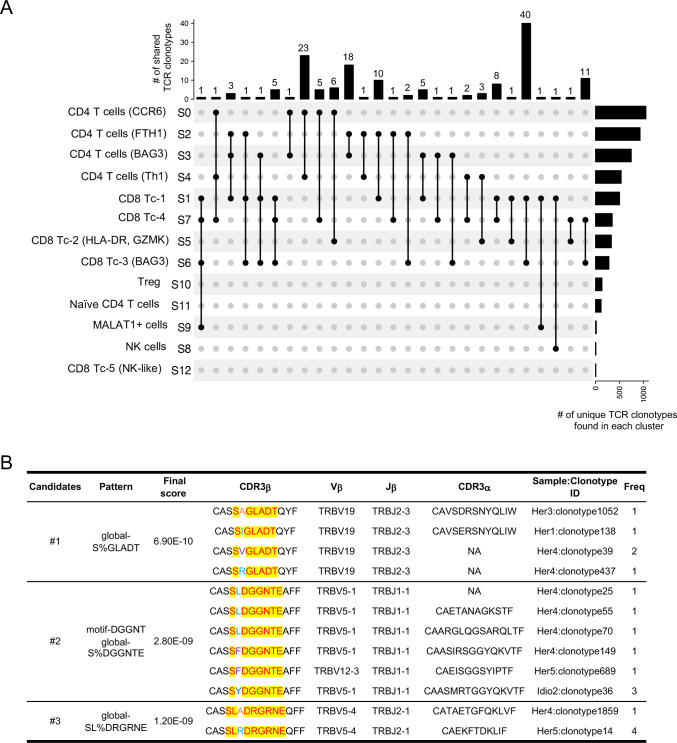
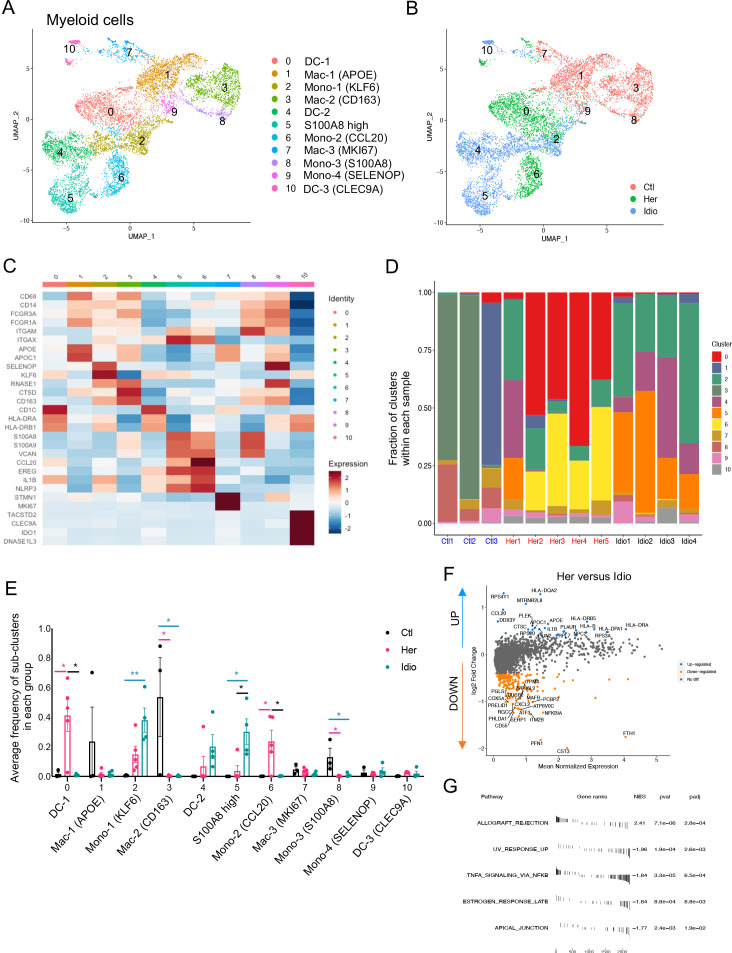
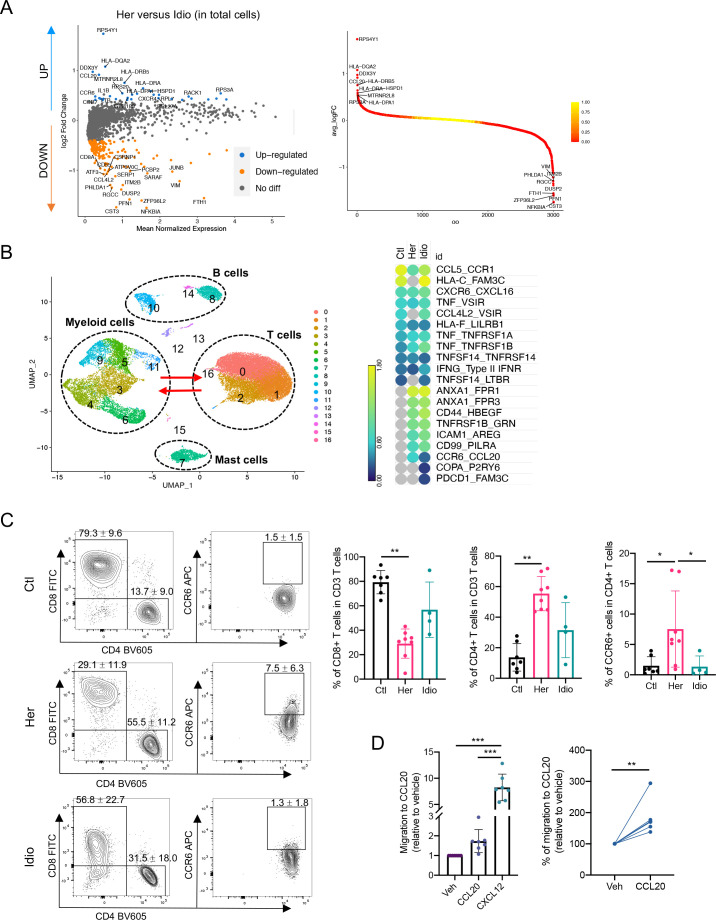
Results: Deep single-cell sequencing revealed distinct immune characteristics and significantly enriched CCR6+ CD4+ T cells in hereditary compared with idiopathic CP. In hereditary CP, a reduction in T-cell clonality was observed due to the increased CD4+ T (Th) cells that replaced tissue-resident CD8+ T cells. Shared TCR clonotype analysis among T-cell lineages also unveiled unique interactions between CCR6+ Th and Th1 subsets, and TCR clustering analysis showed unique common antigen binding motifs in hereditary CP. In addition, we observed a significant upregulation of the CCR6 ligand (CCL20) expression among monocytes in hereditary CP as compared with those in idiopathic CP. The functional significance of CCR6 expression in CD4+ T cells was confirmed by flow cytometry and chemotaxis assay.

Conclusion: Single-cell sequencing with pancreatic immune cells in human CP highlights pancreas-specific immune crosstalk through the CCR6-CCL20 axis, a signalling pathway that might be leveraged as a potential future target in human hereditary CP.

Keywords: RNA expression; T-cell receptor; chronic pancreatitis; immunology; pancreatitis.


Conflict of interest statement

Competing interests: None declared.

Figures

Figure 1
Figure 1
Human pancreatic immune cell transcriptional atlas. (A) Experimental design for single-cell sequencing (cellular indexing of transcriptomes and epitopes by sequencing and TCR-seq) of pancreatic immune cells from patients with CP and non-diseased control donors. (B) UMAP plot of all 28 547 pancreatic immune cells from patients with CP (five hereditary and four idiopathic CP) and three control donors presenting 17 clusters (MAC, macrophages; Mono/Mac, monocytes and macrophages; pDCs, plasmacytoid dendritic cells). (C) Heatmap of signature gene expression Z scores across cells. (D) UMAP plot of pancreatic immune cells including 4169 cells from control donors, 11 786 cells from hereditary CP and 12 592 cells from idiopathic patients with CP coloured based on the group (Ctl, control; Her, hereditary CP; Idio, idiopathic CP). (E) Cell cluster frequency shown as a fraction of clusters from total cells in each patient or donor. (F) The frequency of 17 immune clusters defined by scRNA-seq clustering analysis shown as an average proportion of each cluster within each group. One-way analysis of variance Kruskal-Wallis test (*p<0.05, **p<0.01, ***p<0.001). The comparison of each pair was differentiated by colour: between Ctl and Her, Pink; between Ctl and Idio, Teal; between Her and Idio, Black. CP, chronic pancreatitis; scRNA-seq, single-cell RNA sequencing; scTCR-seq, single-cell TCR sequencing; TCR, T-cell receptor; UMAP, uniform manifold approximation and projection.
Figure 2
Figure 2
Distinct pancreatic T-cell transcriptional signatures in hereditary CP versus idiopathic CP. (A) UMAP plot of 15 913 pancreatic T cells across controls and CP displaying 13 clusters. (B) Heatmap of signature gene expression z scores across cells. (C) UMAP plot of pancreatic T cells including 1012 cells from control donors, 7271 cells from hereditary CP and 7630 cells from idiopathic patients with CP coloured based on the group (Ctl, control; Her, hereditary CP; Idio, idiopathic CP). (D) Cell cluster frequency shown as a fraction of 13 T-cell subclusters in each patient or donor. (E) The frequency of 13 T-cell subclusters defined by single-cell RNA sequencing clustering analysis shown as an average proportion of each cluster within each group. One-way analysis of variance Kruskal-Wallis test (*p<0.05, **p<0.01, ***p<0.001). The comparison of each pair was differentiated by colour; between Ctl and Her, Pink; between Ctl and Idio, Teal; between Her and Idio, Black. (F) Differentially expressed genes in between hereditary CP and idiopathic CP. Each dot represents a gene, with significantly upregulated top 20 genes and downregulated top 20 genes in hereditary CP versus idiopathic CP coloured blue and yellow, respectively. (G) Functional enrichment analysis of significant hallmark gene sets in total T cells from hereditary CP versus idiopathic CP. CP, chronic pancreatitis; NES, normalised enrichment score; UMAP, uniform manifold approximation and projection.
Figure 3
Figure 3
Single-cell RNA sequencing/TCR-sequencing unveils CD8+ T cell subset dependent unique TCR repertoire changes in CP. (A) Bar graph shows the percentage of unique paired TCR α and TCR β sequences that are shared by one cell (blue), by two cells (green) or three or more cells (orange) in each donor or patient with CP. (B) Gini coefficients of control and CP group across all pancreatic T-cell populations. For each group, a box and whisker plot is shown with the median and all values from minimum to maximum. One-way analysis of variance with Tukey’s multiple comparison test, *p<0.05. (C) Heatmap showing Gini coefficients of pancreatic T-cell clusters in each donor or patient. (D) Gini coefficients of pancreatic CD8+ T cells and other T cells in control and CP groups. (E) UMAP plot of CD8A gene expression in control or CP groups (top). TCR clonality on the expression-driven UMAP overlay showing the distribution of clonal and unexpanded cell populations in cell clusters in control and CP groups (bottom). Q0, unexpanded; Q1, cells encompassing the top 20% of the most expanded clones in the group; Q2–4, cells representing the middle three quantiles; Q5, cells encompassing the bottom 20% of the most expanded clones. (F) Correlation analysis of Gini coefficients for pancreatic T cells and the frequency of CD8+ T cells (top) or CD4+ T cells (bottom) in control donors and patients with CP. CP, chronic pancreatitis; Ctl, control; Her, hereditary; Idio, idiopathic; TCR, T-cell receptor; UMAP, uniform manifold approximation and projection.
Figure 4
Figure 4
Single-cell RNA sequencing/TCR-sequencing uncovers unique interactions among T-cell lineages and shared antigen binding motifs in CP. (A) Upset plots displaying TCR clonotypes shared among T-cell clusters from T cells across control and CP groups. Each shared clonotype was indicated by black dots with a connected black line. The horizontal bar graph indicates the total number of shared TCR clonotypes for cluster intersections, and the vertical bar graph indicates the number of unique clonotypes found in a single cluster. (B) Representative TCR specificity groups and potential antigen binding motifs by GLIPH2 cluster analysis of TCR CDR3β sequences from pancreatic T cells across control, hereditary and idiopathic CP. Candidates were selected from the clusters with a final score of less than 10−8 and shared by at least two different individuals. CP, chronic pancreatitis; TCR, T-cell receptor.
Figure 5
Figure 5
Distinct pancreatic myeloid cell transcriptional signatures between hereditary CP and idiopathic CP. (A) UMAP plot of 8590 pancreatic myeloid cells presenting 11 clusters (DC, dendritic cells; MAC, macrophages; mono, monocytes). (B) UMAP plot of pancreatic myeloid cells including 2998 cells from control donors, 2769 cells from hereditary CP and 2823 cells from idiopathic patients with CP coloured based on group (Ctl, control; Her, hereditary CP; Idio, idiopathic CP). (C) Heatmap of signature gene expression z scores across cells. (D) Cell cluster frequency shown as a fraction of 11 myeloid subclusters in each patient or donor. (E) The frequency of 11 myeloid subclusters shown as an average frequency of each cluster within each group. One-way analysis of variance Kruskal-Wallis test (*p<0.05, **p<0.01). The comparison of each pair was differentiated by colour; between Ctl and Her, Pink; between Ctl and Idio, Teal; between Her and Idio, Black. (F) Differentially expressed genes between hereditary and idiopathic CP groups. Each dot represents a gene, with significantly upregulated top 20 genes and downregulated top 20 genes in hereditary CP versus idiopathic CP coloured blue and yellow, respectively. (G) Functional enrichment analysis of significant hallmark gene sets comparing myeloid cells from hereditary CP with idiopathic CP. CP, chronic pancreatitis; NES, normalised enrichment score; UMAP, uniform manifold approximation and projection.
Figure 6
Figure 6
Functional analysis implicates the CCR6-CCL20 axis as hereditary CP-specific pancreatic immune crosstalk. (A) Volcano plot of DEG analysis between hereditary and idiopathic CP groups with total immune populations. Each dot represents a gene, with significantly upregulated top 20 genes and downregulated top 20 genes in hereditary CP versus idiopathic CP coloured blue and yellow, respectively (left). DEGs ranked by fold changes in hereditary CP versus idiopathic CP (right). (B) UMAP plot of total pancreatic immune cells (left). Heatmap of combined expression of selected cytokine/chemokine and their receptor displaying the interactions between myeloid cells and T cells discovered by CellPhoneDB (right). (C) Flow cytometry analysis of CD8+, CD4+ or CCR6+ CD4+ T cells (Kruskal-Wallis test with Dunn’s multiple comparisons test, *p<0.05, **p<0.01). (D) Chemotaxis assay with pancreatic immune cells from hereditary CP (left, one-way analysis of variance with Tukey’s multiple comparisons test; right, paired t-test; **p<0.01, ***p<0.001). CP, chronic pancreatitis; Ctl, control; DEG, differentially expressed genes; Her, hereditary; Idio, idiopathic; UMAP, uniform manifold approximation and projection.

References

    1. Witt H, Apte MV, Keim V, et al. . Chronic pancreatitis: challenges and advances in pathogenesis, genetics, diagnosis, and therapy. Gastroenterology 2007;132:1557–73. 10.1053/j.gastro.2007.03.001 - DOI - PubMed
    1. Yadav D, Timmons L, Benson JT, et al. . Incidence, prevalence, and survival of chronic pancreatitis: a population-based study. Am J Gastroenterol 2011;106:2192–9. 10.1038/ajg.2011.328 - DOI - PubMed
    1. Majumder S, Chari ST. Chronic pancreatitis. Lancet 2016;387:1957–66. 10.1016/S0140-6736(16)00097-0 - DOI - PubMed
    1. Kleeff J, Whitcomb DC, Shimosegawa T, et al. . Chronic pancreatitis. Nat Rev Dis Primers 2017;3:17060. 10.1038/nrdp.2017.60 - DOI - PubMed
    1. Whitcomb DC. Genetic aspects of pancreatitis. Annu Rev Med 2010;61:413–24. 10.1146/annurev.med.041608.121416 - DOI - PubMed

Publication types