. 2021 Oct 26;11(1):21108.
doi: 10.1038/s41598-021-00267-w.

Detailed phylogenetic analysis tracks transmission of distinct SARS-COV-2 variants from China and Europe to West Africa

Affiliations

Detailed phylogenetic analysis tracks transmission of distinct SARS-COV-2 variants from China and Europe to West Africa

Wasco Wruck et al. Sci Rep. .

Abstract

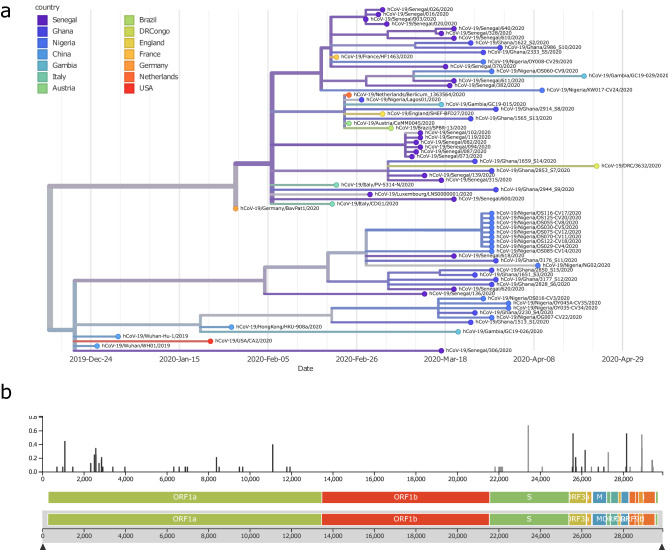
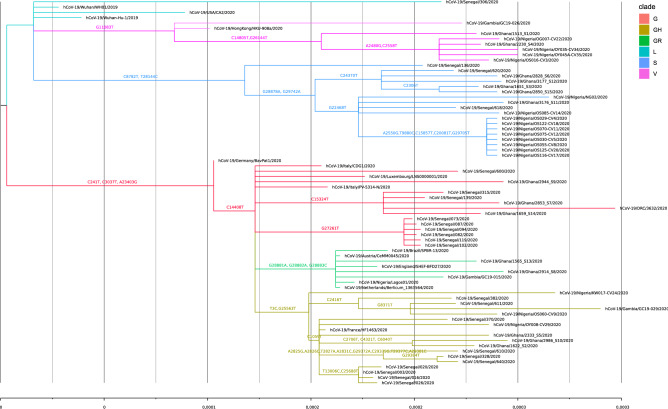
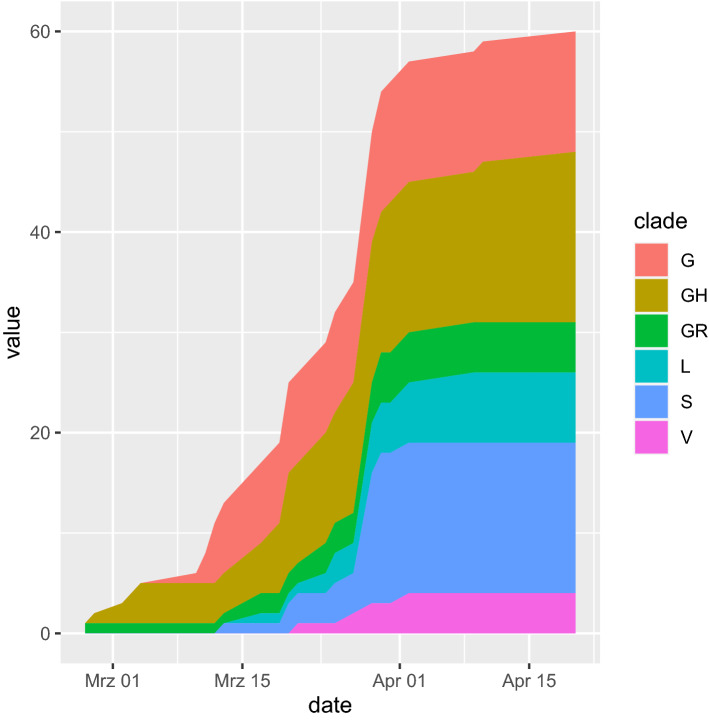
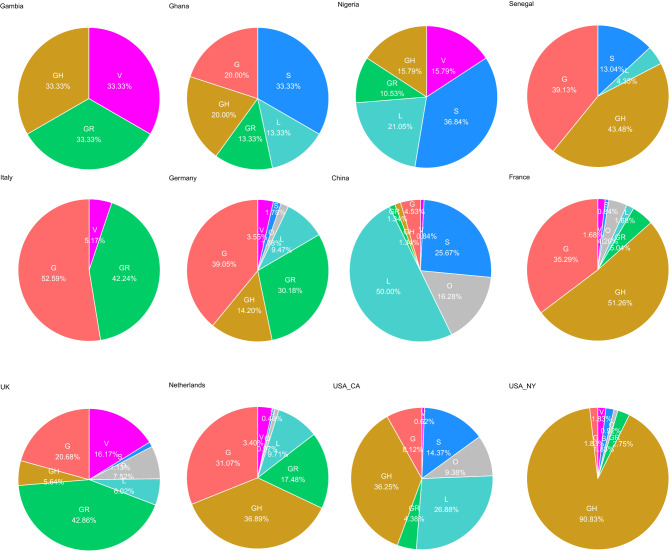
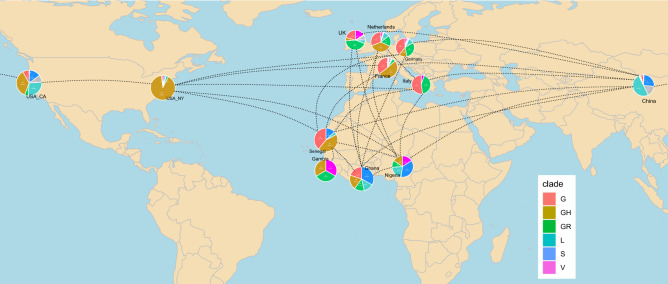
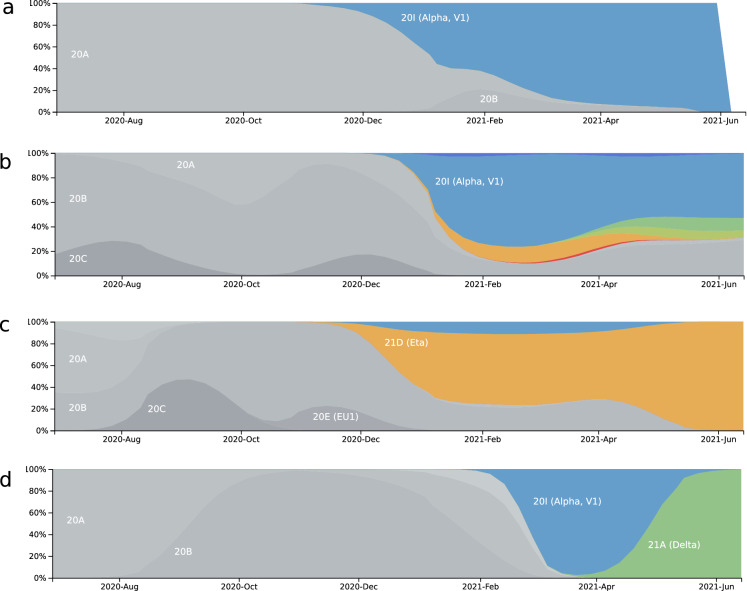
SARS-CoV-2, the virus causing the COVID-19 pandemic emerged in December 2019 in China and raised fears it could overwhelm healthcare systems worldwide. Mutations of the virus are monitored by the GISAID database from which we downloaded sequences from four West African countries Ghana, Gambia, Senegal and Nigeria from February 2020 to April 2020. We subjected the sequences to phylogenetic analysis employing the nextstrain pipeline. We found country-specific patterns of viral variants and supplemented that with data on novel variants from June 2021. Until April 2020, variants carrying the crucial Europe-associated D614G amino acid change were predominantly found in Senegal and Gambia, and combinations of late variants with and early variants without D614G in Ghana and Nigeria. In June 2021 all variants carried the D614G amino acid substitution. Senegal and Gambia exhibited again variants transmitted from Europe (alpha or delta), Ghana a combination of several variants and in Nigeria the original Eta variant. Detailed analysis of distinct samples revealed that some might have circulated latently and some reflect migration routes. The distinct patterns of variants within the West African countries point at their global transmission via air traffic predominantly from Europe and only limited transmission between the West African countries.


Conflict of interest statement

The authors declare no competing interests.

Figures

Figure 1
Figure 1
Phylogenetic tree (December 2019 to April 2020) revealing similarities of West-African viral sequences with Chinese and multiple European countries. (a) Nigerian samples cluster with the early Chinese samples within the bottom branch of the tree, Ghanaian samples are about equally distributed between the top (European) and bottom branch of the tree. Senegalese samples cluster closer with the French reference sample on the top of the tree. (b) Highest diversity is at the A23403G (D614G) substitution splitting the tree in the bottom (Chinese) and top (European) branch. This variant has been reported to increase infectivity,. Graphics were generated using the nextstrain pipeline including software Augur (version 7.0.2, https://docs.nextstrain.org/projects/augur/en/stable/index.html) and TreeTime (version 0.7.6, https://github.com/neherlab/treetime),.
Figure 2
Figure 2
Phylogenetic tree (December 2019–April 2020) colored by clades shows distribtution of West-African samples over all clades suggesting introductions from China and European countries. Patterns are country-specific, e.g. most Senegalese samples have close similarity with the French reference, most Nigerian samples cluster in early Chinese-based clade S and Ghanaian samples are spread over all clades. Within the clade S, there are putatively specific West-African mutations at the branches at C24370T and G22468T. G22486T may reflect migration routes because in the nextstrain analysis of Africa as a whole there are also Tunisian samples in this branch (https://nextstrain.org/ncov/africa?f_region=Africa, accessed Jun 26th, 2020). Two of the non-French related Senegalese samples come from these branches while the other (Senegal/136) has strong similarity with Spanish-end of February samples from the early clade S pointing at multiple introductions to Senegal from France, Spain and African countries. Graphics were generated using the software FigTree (version 1.4.4, http://tree.bio.ed.ac.uk/software/figtree/) for annotation of the phylogenetic tree and the nextstrain pipeline including software Augur (version 7.0.2, https://docs.nextstrain.org/projects/augur/en/stable/index.html) and TreeTime (version 0.7.6, https://github.com/neherlab/treetime),.
Figure 3
Figure 3
Temporal course of clade distribution confirms gaining of share of the Europe-associated G-clades harboring the putatively more infectious D614G amino acid substitution (February–April 2020). Interestingly the younger Europe-associated G-clades emerged earlier in West African sequenced samples. This could be due to founder effects by introductions from France being closely connected to Senegal and displaying a similar clade distribution. Furthermore, the China-based L-, V- and S-clade samples started in mid-March at a time when the epidemic in China was nearly entirely suppressed. Thus, the virus may have circulated in several countries before the first samples were sequenced. Surprisingly, the abundance of the S-clade is relatively high mainly due to Nigeria and Ghana but without that exception the clade distribution resembles the global one with a delay of about 2–4 weeks. The plot was generated using R (version 3.6.1, https://www.r-project.org/), [Ihaka, R. & Gentleman, R. R: A language for data analysis and graphics. J. Comput. Graph. Stat. 5, 299–314 (1996)] and the R package ggplot2 (version 3.3.0, https://ggplot2.tidyverse.org/) [Wickham, H. Ggplot2: Elegant Graphics for Data Analysis. (Springer, 2009).].
Figure 4
Figure 4
West African countries display distinct patterns of China-and Europe-based clades (until April 2020). Nigeria has the highest percentage of the China-based early clades (L, S, V) and Ghana has nearly equally distributed percentages of China and Europe-based clades (G, GH, GR). Senegal has a similar clade distribution as France but also a few samples from the early China-based clades. In Gambia there were only three sequences, two from Europe-based clades GR and GH and one from China-based clade V. The charts were generated using R (version 3.6.1, https://www.r-project.org/), [Ihaka, R. & Gentleman, R. R: A language for data analysis and graphics. J. Comput. Graph. Stat. 5, 299–314 (1996)] and the R package ggplot2 (version 3.3.0, https://ggplot2.tidyverse.org/), [Wickham, H. Ggplot2: Elegant Graphics for Data Analysis. (Springer, 2009).].
Figure 5
Figure 5
Geographic map reveals distinct patterns of introduction of China-and Europe-based clades in West African countries (until April 2020). Nigeria with the highest percentage of the China-based early clades (L, S, V) and Ghana with nearly equally distributed percentages of China and Europe-based clades (G, GH, GR) might be comparable with the US West Coast while Senegal with a similar clade distribution like France and few samples from the early China-based clades may be more comparable to the US East Coast. It will be interesting to observe if the later G clades replace the early clades in Nigeria and Ghana and if that correlates with the severity of the disease as was postulated for the US. The R package rworldmap (version 1.3-6, https://cran.r-project.org/web/packages/rworldmap/index.html), South was used to generate the world map in this figure using R (version 3.6.1, https://www.r-project.org/), [Ihaka, R. & Gentleman, R. R: A language for data analysis and graphics. J. Comput. Graph. Stat. 5, 299–314 (1996)].
Figure 6
Figure 6
Distribution plot of SARS-CoV-2 variants from July 2020 to June 2021 shows distinct patterns in West African countries. This plot was generated in June 2021 and confirms our previous analysis of samples from February 2020 to April 2020 predicting a rapid spread of the variants carrying the D614G amino acid substitution. All predominating variants in June 2021 also carried the D614G, besides their characteristic amino acid changes. (a) Gambia is dominated by the Alpha variant. (b) Ghana has a combination of the variants Alpha, Delta, Kappa, Eta and Iota, dominated by the Alpha. (c) Nigeria is dominated by the Eta variant (B.1.525) which putatively originated from Nigeria. (d) In Senegal the Delta variant displaced the Alpha variant. Variants are marked by the colors blue (Alpha), green (Delta), yellow green (Kappa), orange (Eta) and red (Iota). Figure adapted from the website www.nextstrain.org (accessed June 22, 2021, CC-BY,).

References

    1. Korber B, et al. Tracking changes in SARS-CoV-2 spike: Evidence that D614G increases infectivity of the COVID-19 virus. Cell. 2020 doi: 10.1016/j.cell.2020.06.043. - DOI - PMC - PubMed
    1. Brufsky A. Distinct viral clades of SARS-CoV-2: Implications for modeling of viral spread. J. Med. Virol. 2020 doi: 10.1002/jmv.25902. - DOI - PMC - PubMed
    1. Krueger DK, Kelly SM, Lewicki DN, Ruffolo R, Gallagher TM. Variations in disparate regions of the murine coronavirus spike protein impact the initiation of membrane fusion. J. Virol. 2001;75:2792–2802. doi: 10.1128/JVI.75.6.2792-2802.2001. - DOI - PMC - PubMed
    1. Geoghegan JL, Holmes EC. The phylogenomics of evolving virus virulence. Nat. Rev. Genet. 2018;19:756–769. doi: 10.1038/s41576-018-0055-5. - DOI - PMC - PubMed
    1. Pachetti M, et al. Emerging SARS-CoV-2 mutation hot spots include a novel RNA-dependent-RNA polymerase variant. J. Transl. Med. 2020;18:179. doi: 10.1186/s12967-020-02344-6. - DOI - PMC - PubMed

Publication types