

Metabarcoding insights into the diet and trophic diversity of six declining farmland birds
- PMID: 34702920
- PMCID: PMC8548310
- DOI: 10.1038/s41598-021-00519-9
Metabarcoding insights into the diet and trophic diversity of six declining farmland birds
Abstract
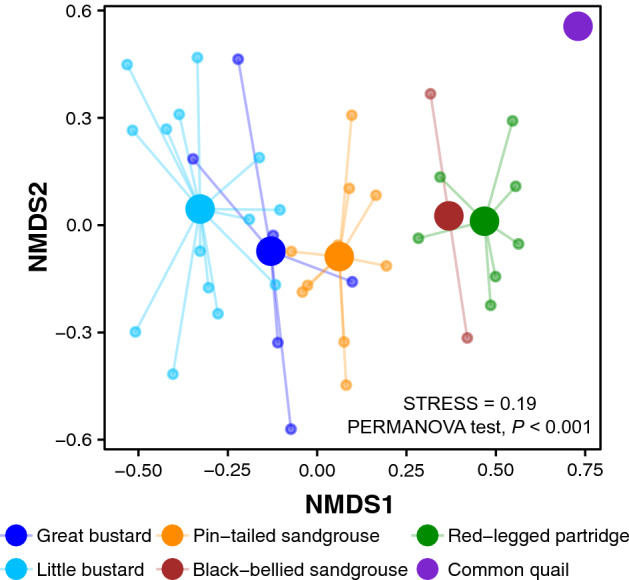
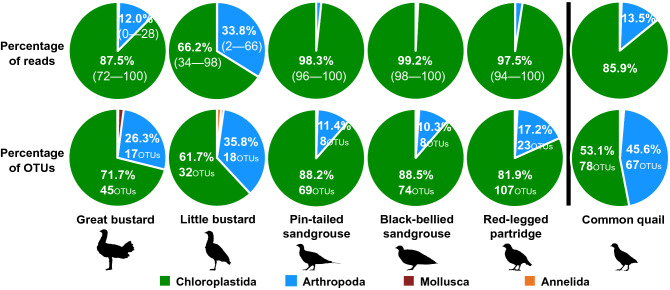
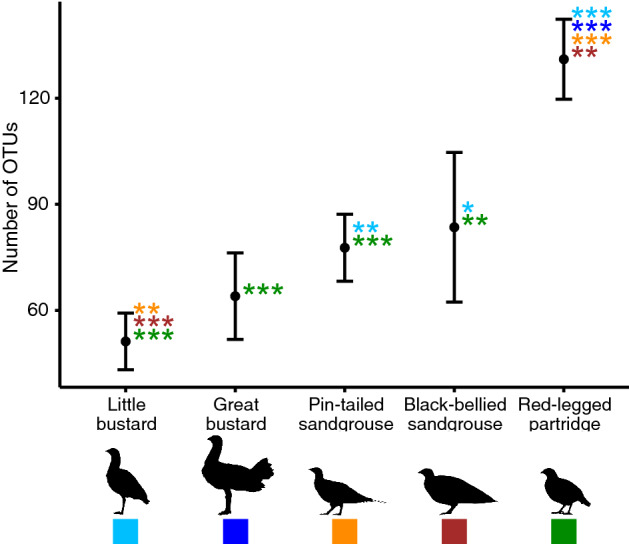
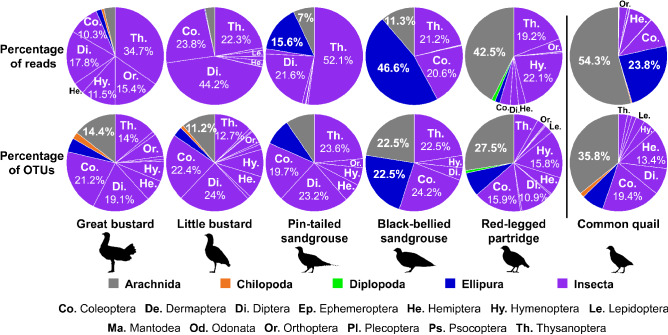
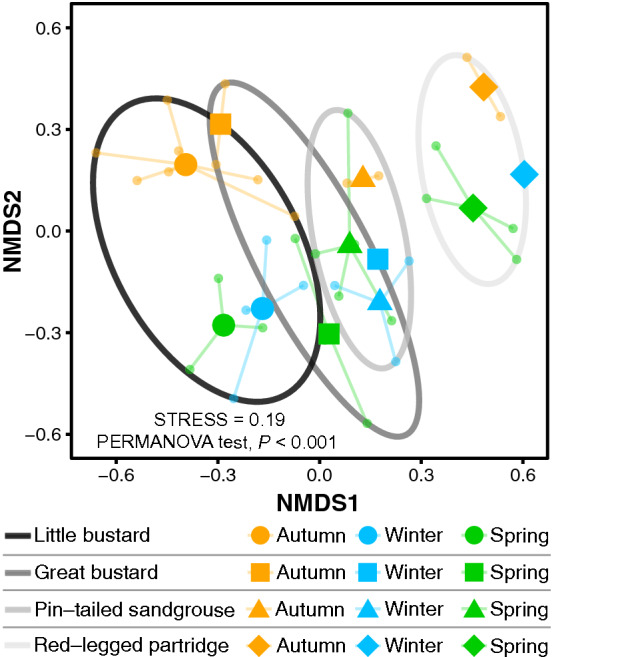
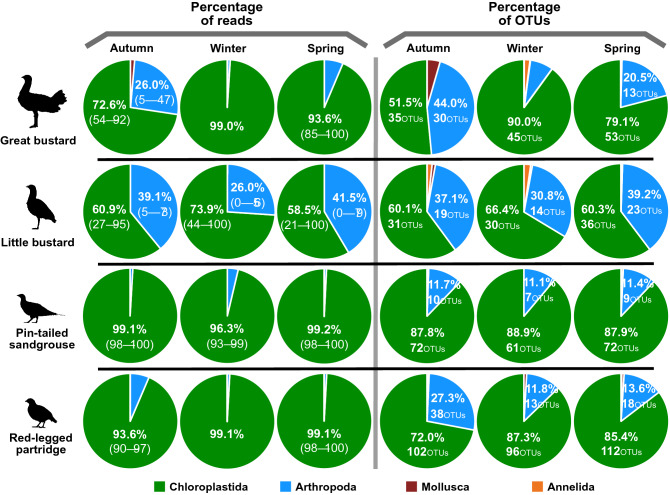
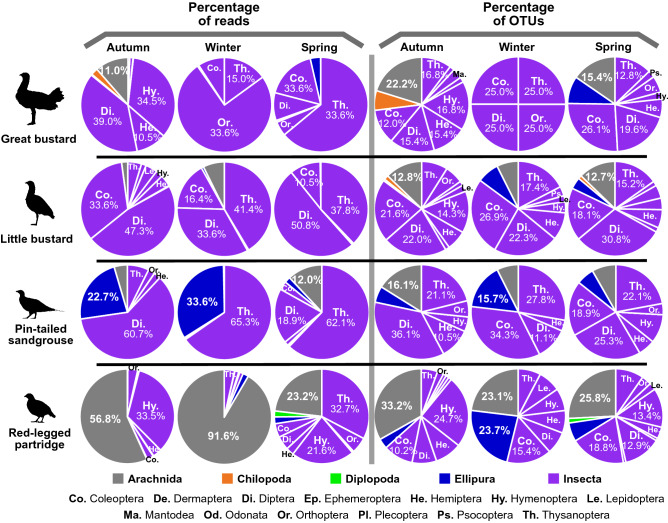
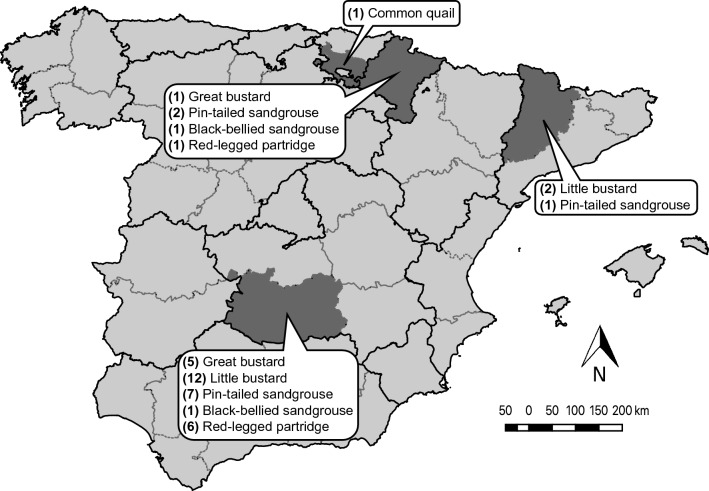
Knowledge of feeding ecology of declining species, such as farmland birds, is essential to address their conservation requirements, especially when their habitats are suffering important reductions of trophic resources. In this study, we apply a metabarcoding approach to describe the diet composition of six of the most significant farmland birds inhabiting European cereal pseudo-steppes: little bustard, great bustard, pin-tailed sandgrouse, black-bellied sandgrouse, red-legged partridge, and common quail. We further studied seasonal diet variations (autumn to spring) in all species but the common quail, whose diet was studied during spring and summer. We show that study species´ diets mostly consisted of plants, although in the case of little bustard and great bustard arthropods are also highly relevant. Among arthropods, we found high proportions of thrips, arachnids, and springtails, which were previously unreported in their diet, and some taxa that could be used as antiparasitic food. Moreover, we report that little bustard's diet is the least rich of that of all studied species, and that diet of all these species is less diverse in winter than in autumn and spring. Diet composition of these declining species supports the importance of natural and semi-natural vegetation and landscape mosaics that can provide a wide variety of arthropods, plants, and seeds all year-round.
© 2021. The Author(s).
Conflict of interest statement
The authors declare no competing interests.
Figures
Similar articles
-
Dietary DNA metabarcoding reveals a trophic niche partitioning among sympatric Iberian sandgrouses and bustards.Sci Total Environ. 2024 Jul 10;933:172989. doi: 10.1016/j.scitotenv.2024.172989. Epub 2024 May 5. Sci Total Environ. 2024. PMID: 38714259
-
Can current farmland landscapes feed declining steppe birds? Evaluating arthropod abundance for the endangered little bustard (Tetrax tetrax) in cereal farmland during the chick-rearing period: Variations between habitats and localities.Ecol Evol. 2021 Mar 2;11(7):3219-3238. doi: 10.1002/ece3.7271. eCollection 2021 Apr. Ecol Evol. 2021. PMID: 33841779 Free PMC article.
-
Temporal trends of land-use favourability for the strongly declining little bustard: assessing the role of protected areas.PeerJ. 2024 Jan 4;12:e16661. doi: 10.7717/peerj.16661. eCollection 2024. PeerJ. 2024. PMID: 38188158 Free PMC article.
-
Small things are important: the value of singular point elements for birds in agricultural landscapes.Biol Rev Camb Philos Soc. 2021 Aug;96(4):1386-1403. doi: 10.1111/brv.12707. Epub 2021 Mar 10. Biol Rev Camb Philos Soc. 2021. PMID: 33694303
-
Anatomy of the avian cecum.J Exp Zool Suppl. 1989;3:2-9. doi: 10.1002/jez.1402520503. J Exp Zool Suppl. 1989. PMID: 2575123 Review.
Cited by
-
Threshold responses of birds to agricultural intensification in Mediterranean olive groves.Ecol Appl. 2025 Jul;35(5):e70057. doi: 10.1002/eap.70057. Ecol Appl. 2025. PMID: 40634261 Free PMC article.
-
DNA metabarcoding reveals the seasonal variation of dietary composition of Taihangshan macaque (Macaca mulatta tcheliensis), Jiyuan, north China.Ecol Evol. 2024 Apr 19;14(4):e11256. doi: 10.1002/ece3.11256. eCollection 2024 Apr. Ecol Evol. 2024. PMID: 38646002 Free PMC article.
-
Multi-marker DNA metabarcoding reveals spatial and sexual variation in the diet of a scarce woodland bird.Ecol Evol. 2023 May 17;13(5):e10089. doi: 10.1002/ece3.10089. eCollection 2023 May. Ecol Evol. 2023. PMID: 37206688 Free PMC article.
-
Diet and Spatial Ecology Influence Red-Legged Partridge Exposure to Pesticides Used as Seed Treatment.Environ Sci Technol. 2023 Oct 10;57(40):14861-14870. doi: 10.1021/acs.est.3c03905. Epub 2023 Sep 25. Environ Sci Technol. 2023. PMID: 37747849 Free PMC article.
-
Using Next-Generation Sequencing to Disentangle the Diet and Incidence of Intestinal Parasites of Falkland Flightless Steamer Duck Tachyeres brachypterus and Patagonian Crested Duck Lophonetta specularioides Sharing a South Atlantic Island.Genes (Basel). 2023 Mar 16;14(3):731. doi: 10.3390/genes14030731. Genes (Basel). 2023. PMID: 36981002 Free PMC article.
References
-
- Tscharntke T, Klein AM, Kruess A, Steffan-Dewenter I, Thies C. Landscape perspectives on agricultural intensification and biodiversity–ecosystem service management. Ecol. Lett. 2005;8:857–874. doi: 10.1111/j.1461-0248.2005.00782.x. - DOI
-
- Van Zanten BT, et al. European agricultural landscapes, common agricultural policy and ecosystem services: A review. Agron. Sustain. Dev. 2014;34:309–325. doi: 10.1007/s13593-013-0183-4. - DOI
-
- Jongman RH. Homogenisation and fragmentation of the European landscape: Ecological consequences and solutions. Landsc. Urban Plan. 2002;58:211–221. doi: 10.1016/S0169-2046(01)00222-5. - DOI
Publication types
MeSH terms
LinkOut - more resources
Full Text Sources
