. 2021 Oct 26;11(1):21072.
doi: 10.1038/s41598-021-00626-7.

Optimizing the evaluation of gene-targeted panels for tumor mutational burden estimation

Affiliations

Optimizing the evaluation of gene-targeted panels for tumor mutational burden estimation

Yawei Li et al. Sci Rep. .

Abstract

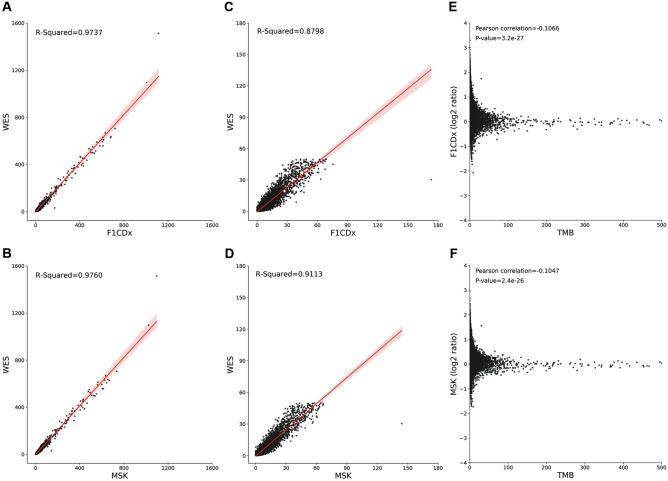
Though whole exome sequencing (WES) is the gold-standard for measuring tumor mutational burden (TMB), the development of gene-targeted panels enables cost-effective TMB estimation. With the growing number of panels in clinical trials, developing a statistical method to effectively evaluate and compare the performance of different panels is necessary. The mainstream method uses R-squared value to measure the correlation between the panel-based TMB and WES-based TMB. However, the performance of a panel is usually overestimated via R-squared value based on the long-tailed TMB distribution of the dataset. Herein, we propose angular distance, a measurement used to compute the extent of the estimated bias. Our extensive in silico analysis indicates that the R-squared value reaches a plateau after the panel size reaches 0.5 Mb, which does not adequately characterize the performance of the panels. In contrast, the angular distance is still sensitive to the changes in panel sizes when the panel size reaches 6 Mb. In particular, R-squared values between the hypermutation-included dataset and the non-hypermutation dataset differ widely across many cancer types, whereas the angular distances are highly consistent. Therefore, the angular distance is more objective and logical than R-squared value for evaluating the accuracy of TMB estimation for gene-targeted panels.


Conflict of interest statement

The authors declare no competing interests.

Figures

Figure 1
Figure 1
The TMB distribution of the 10,223 patients across 33 different cancer types. (A) The histogram of the TMB distribution of all patients. The X axis is the TMB (the number of somatic mutations per megabase (Mb) of interrogated genomic sequence), and the Y axis is the number of patients with the integer TMB being the corresponding number. The average TMB for the dataset is 9.64, and the median TMB is 2.60. (B) The boxplot of the TMB distribution for each of the 33 cancer types. The X axis denotes the 33 cancer types and the Y axis is the TMB for each cancer type. A log-10 scale is used for the Y axis of the graph.
Figure 2
Figure 2
TMB estimation results for gene panels in different datasets. (A, B) Linear fit with 95% confidence intervals of panel-based TMB estimated by the F1CDx and the MSK against WES-based TMB in the hypermutation-included dataset. (C, D) Linear fit with 95% confidence intervals of panel-based TMB estimated by the F1CDx and the MSK against WES-based TMB in the non-hypermutation dataset. The R-squared values are lower in the non-hypermutation dataset than in the hypermutation-included dataset for both panels. (E, F) The correlation between the estimated bias and TMB size (Pearson correlation: F1CDx: − 0.1066, P value: 3.2 × 10–27; MSK: − 0.1047, P value: 2.4 × 10–26). The X axis is the WES-based TMB of the patient and the Y axis is calculated as the panel-based TMB divided by the WES-based TMB. A log-2 scale is used for the Y axis of the graph. Patients with TMB > 500 are not shown.
Figure 3
Figure 3
Linear fit of panel-based TMB estimated by the F1CDx (A, C) and MSK (B, D) against WES-based TMB in cancer type OV dataset (A, B) and THYM dataset (C, D). The poor R-squared value in the cancer type OV dataset is due to the highly estimated bias of one patient (TCGA-13-0889, red dot in A, B) with very high TMB relative to other patients in the dataset, whereas the high R-squared value in cancer type THYM dataset is because the estimated bias of the patient (TCGA-ZB-A966, red dot in C, D) with very high TMB relative to other patients in the dataset is small.
Figure 4
Figure 4
TMB estimation results for the 10,000 simulated sequencing panels in different datasets. (A) The R-squared of the simulated sequencing panels of the hypermutation-included dataset (blue) and the non-hypermutation dataset (red). The X axis is the size of each simulated panel, and the Y axis is the R-squared value of each panel. (B) The average angular distance of the simulated sequencing panels of the hypermutation-included dataset (blue) and the non-hypermutation dataset (red). The X axis is the size for each simulated panel, and the Y axis is the average angular distance estimated for each simulated panel. (C) The correlation between TMB and average angular distance. The X axis is the WES-based TMB of the patient and the Y axis is the average angular distance of the 10,000 simulated panels. Patients with TMB > 100 are not shown.
Figure 5
Figure 5
The average angular distance of the simulated sequencing panels in the hypermutation-included dataset using total point mutations (blue) and nonsynonymous mutations (red). The X axis is the size for each simulated panel, and the Y axis is the average angular distance estimated by the simulated panels. The estimation bias is higher when using nonsynonymous mutations as opposed to using total point mutations for the same panels.

References

    1. Drake CG, Lipson EJ, Brahmer JR. Breathing new life into immunotherapy: Review of melanoma, lung and kidney cancer. Nat. Rev. Clin. Oncol. 2014;11:24–37. doi: 10.1038/nrclinonc.2013.208. - DOI - PMC - PubMed
    1. Khalil DN, Smith EL, Brentjens RJ, Wolchok JD. The future of cancer treatment: Immunomodulation, CARs and combination immunotherapy. Nat. Rev. Clin. Oncol. 2016;13:394. doi: 10.1038/nrclinonc.2016.65. - DOI - PMC - PubMed
    1. Leach DR, Krummel MF, Allison JP. Enhancement of antitumor immunity by CTLA-4 blockade. Science. 1996;271:1734–1736. doi: 10.1126/science.271.5256.1734. - DOI - PubMed
    1. Tumeh PC, et al. PD-1 blockade induces responses by inhibiting adaptive immune resistance. Nature. 2014;515:568–571. doi: 10.1038/nature13954. - DOI - PMC - PubMed
    1. Simoni Y, et al. Bystander CD8(+) T cells are abundant and phenotypically distinct in human tumour infiltrates. Nature. 2018;557:575–579. doi: 10.1038/s41586-018-0130-2. - DOI - PubMed

Publication types

Substances