. 2021 Dec;31(12):1244-1262.
doi: 10.1038/s41422-021-00573-y. Epub 2021 Oct 26.

Mesenchymal stem cell treatment improves outcome of COVID-19 patients via multiple immunomodulatory mechanisms

Affiliations

Mesenchymal stem cell treatment improves outcome of COVID-19 patients via multiple immunomodulatory mechanisms

Rongjia Zhu et al. Cell Res. 2021 Dec.

Abstract

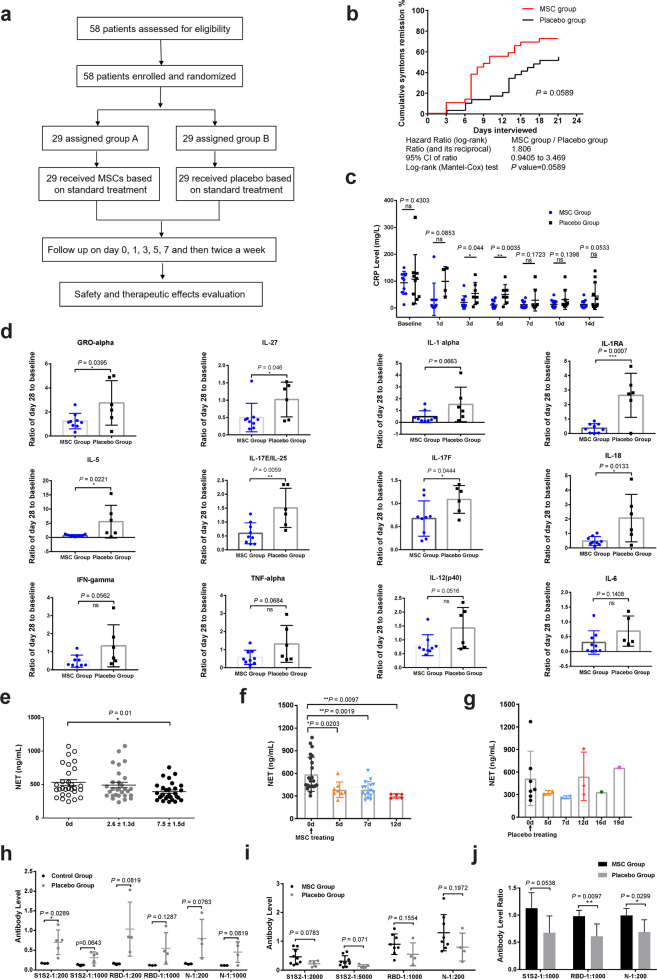
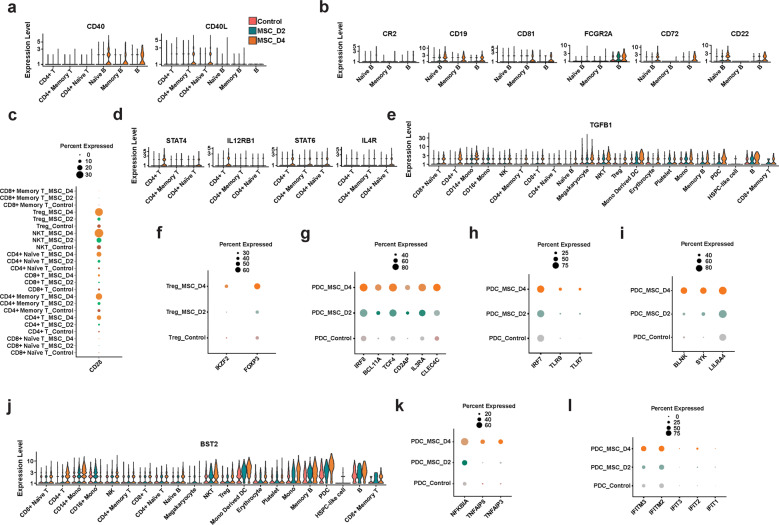
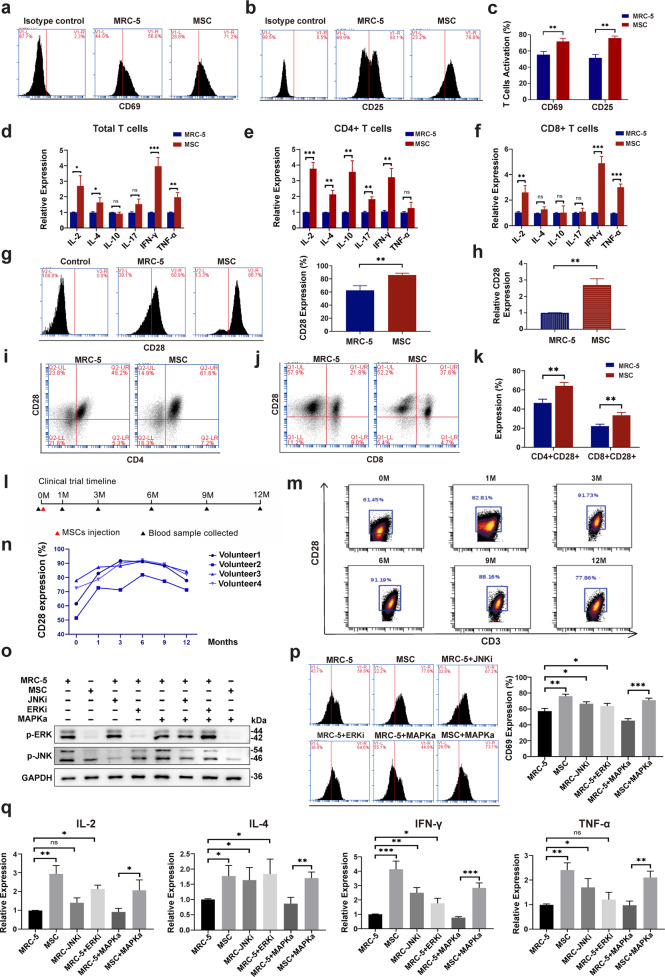
The infusion of coronavirus disease 2019 (COVID-19) patients with mesenchymal stem cells (MSCs) potentially improves clinical symptoms, but the underlying mechanism remains unclear. We conducted a randomized, single-blind, placebo-controlled (29 patients/group) phase II clinical trial to validate previous findings and explore the potential mechanisms. Patients treated with umbilical cord-derived MSCs exhibited a shorter hospital stay (P = 0.0198) and less time required for symptoms remission (P = 0.0194) than those who received placebo. Based on chest images, both severe and critical patients treated with MSCs showed improvement by day 7 (P = 0.0099) and day 21 (P = 0.0084). MSC-treated patients had fewer adverse events. MSC infusion reduced the levels of C-reactive protein, proinflammatory cytokines, and neutrophil extracellular traps (NETs) and promoted the maintenance of SARS-CoV-2-specific antibodies. To explore how MSCs modulate the immune system, we employed single-cell RNA sequencing analysis on peripheral blood. Our analysis identified a novel subpopulation of VNN2+ hematopoietic stem/progenitor-like (HSPC-like) cells expressing CSF3R and PTPRE that were mobilized following MSC infusion. Genes encoding chemotaxis factors - CX3CR1 and L-selectin - were upregulated in various immune cells. MSC treatment also regulated B cell subsets and increased the expression of costimulatory CD28 in T cells in vivo and in vitro. In addition, an in vivo mouse study confirmed that MSCs suppressed NET release and reduced venous thrombosis by upregulating kindlin-3 signaling. Together, our results underscore the role of MSCs in improving COVID-19 patient outcomes via maintenance of immune homeostasis.


Conflict of interest statement

The authors declare no competing interests.

Figures

Fig. 1
Fig. 1. Clinical outcomes of COVID-19 patients with MSC transplantation.
a Randomization and trial profile. b Cumulative remission rate of the two groups. c Plasma CRP levels were assessed for patients with severe/critical disease in the two groups. d Ratio of the mean value for each cytokine at day 28 to that of baseline (prior to treatment) after MSC or placebo infusion was calculated for the two groups. e Plasma NET-DNA levels for the MSC-treated patients at three time points (n = 29, P = 0.01, data at day 7.5 ± 1.5 compared with day 0). f Changes in the plasma NET-DNA levels in MSC-treated patients, showing the beneficial effects over time (n = 22, P = 0.0483, data at day 7 compared with that at day 0). g Change in plasma NET-DNA levels in placebo-treated patients over time (n = 7, P > 0.05). h Antibodies against SARS-CoV-2 spike S1 + S2 extracellular domain, RBD, and nucleocapsid/N detected in plasma of healthy subjects and placebo-treated patients over 28 days. i Detection of the three specific antibodies in plasma samples of both the MSC-treated and placebo groups on day 28 (P > 0.05). j Ratio of antibody level at day 28 to that of day 14 in the MSC-treated and placebo-treated groups. The data represent the means ± SD. The P values were determined using the unpaired Student’s t-test. *P < 0.05; **P < 0.01; ***P < 0.001.
Fig. 2
Fig. 2. Expression of chemotaxis-related genes and telomerase-related genes in PBMCs of COVID-19 patients treated with MSCs by high-throughput sequencing.
a UMAP presentation of major cell types and associated clusters among PBMCs of COVID-19 patients (n = 7). b Heatmap showing expression of hallmark genes stratified by cell clusters. The markers and their corresponding cell clusters are listed on the right. c Proportion of the major immune cell types among PBMCs from MSC-treated COVID-19 patients (MSC-D2 and MSC-D4) and MSC-untreated controls. d UMAP presentation of major cell types and associated clusters among PBMCs from MSC-treated COVID-19 patients (MSC-D2 and MSC-D4) and MSC-untreated controls. The HSPC-like cell cluster is highlighted in pink. e GO analysis of the top 171 most highly expressed genes in the bone marrow-derived cluster. Bubble chart showing the top 15 GO biological process terms. f–m DEG levels of CCL5, CXCR2, CCR7, CX3CR1, CXCR3, CD302, HMGB1, and L-selectin detected by scRNA-seq in different subpopulations of PBMCs from MSC-treated COVID-19 patients (MSC-D2 and MSC-D4) and MSC-untreated controls. n–s Differential gene expression levels of DKC1, GAR1, NOP10, NHP2, RPA1, and PARN in different leukocyte subpopulations of PBMCs from MSC-treated COVID-19 patients (MSC-D2 and MSC-D4) and MSC-untreated control samples. UMAP, Uniform Manifold Approximation and Projection; control, MSC-untreated controls.
Fig. 3
Fig. 3. MSC treatment promotes immune regulatory functions.
a–d Expression of markers in various cell types in peripheral blood. a CD40 and CD40L in B cells and CD4+ T cells; b CR2, CD19, CD81, FCGR2A, CD72, and CD22 in B cells; c CD28 in T cells; d STAT4, IL12RB1, STAT6, and IL4R in CD4+ T cells; e TGF-β1 in various immune cells. f Expression of the Treg-specific genes FOXP3 and IKZF2 in samples MSC-D2 and MSC-D4. g Expression of the pDC-specific genes CLEC4C, IL-3Rα, and CD2AP and regulatory genes TCF4, BCL11A, and IRF8. h Expression of TLR7 and TLR9 and of the important IFN-I regulator IRF7. i Expression of the pDC regulator receptor LILRA4 and its downstream signaling genes BLNK and SYK. j Expression of BST2 in various immune cells in peripheral blood. k Expression of the NFκB negative regulators TNFAIP3, TNFAIP8, and NFKBIA. l Expression of the IFN downstream genes IFIT1, IFIT2, IFIT3, IFITM2, and IFITM3; control, MSC-untreated controls.
Fig. 4
Fig. 4. MSCs support immune function and promote costimulatory CD28 expression partly via MAPK-ERK/JNK signaling.
a Representative flow cytometry results for activated PBMCs after co-culturing with MRC-5 or MSCs for 2 days. CD69 is an early-stage activation marker of T cells. b Representative flow cytometry results for activated PBMCs after co-culture with MRC-5 or MSCs for 5 days. CD25 is a mid-stage activation marker of T cells. c Summary histogram of T-cell activation markers CD69 and CD25. d–f Relative expression levels of RNAs encoding cytokines in total T cells (d), CD4+ T cells (e), and CD8+ T cells (f). g Representative flow cytometry results (left) and summary histogram (right) of CD28 expression on the surface of quiescent T cells co-cultured with MRC-5 or MSCs. h CD28 gene expression of T cells co-cultured with MRC-5 or MSCs by qRT-PCR. i Representative scatter diagram of CD28 expression on quiescent CD4+ T helper cells co-cultured with MRC-5 or MSCs. j Representative scatter diagram of CD28 expression on quiescent CD8+ cytotoxic T cells co-cultured with MRC-5 or MSCs. k Summary histogram of CD28 expression on CD4+/CD8+ quiescent T cells co-cultured with MRC-5 or MSCs. l Timeline of clinical trials of MSC infusion. m Representative scatter diagram of changes in CD28 expression on CD3+ T cells isolated from blood samples from volunteers over 12 months. n Line chart of changes in CD28 expression on CD3+ T cells isolated from blood samples from all four volunteers over 12 months. o Western blotting results of p-ERK and p-JNK of T cells co-cultured with MRC-5 or MSCs. p Representative flow cytometry results (left) and summary histogram (right) of CD69 expression on activated T cells co-cultured with MRC-5/MSCs with or without different signaling inhibitors or activators. q Relative expression of cytokines in T cells co-cultured with MRC-5/MSCs with or without different signaling inhibitors or activators. The data represent means ± SD. The P values were determined using the unpaired Student’s t-test. *P < 0.05, **P < 0.01, ***P < 0.001.
Fig. 5
Fig. 5. Mass-cytometry analysis of lung immune cells in LPS-treated and MSC-LPS-treated mice.
a Identification of 25 distinct clusters of lung immune cells using tSNE and PhenoGraph. b Heatmap of the normalized expression of markers of various lung immune cell types. c viSNE map of lung immune cells. d Composition of lung immune cells in LPS-treated and MSC-LPS-treated mice. e Percentage of total B cells over time in LPS-treated and MSC-LPS-treated mouse lungs. f Histogram of CD38 expression in B cells. The red line represents the MSC-LPS-treated group, and the green line represents the LPS-treated group. g CX3CR1 expression on distinct cell clusters. h CD62L expression on distinct cells clusters. i Lung morphology in LPS-treated and MSC-LPS-treated mice. The data represent the means ± SD. L3, LPS-treated group on day 3; L7, LPS-treated group on day 7; M3, MSC-LPS-treated group on day 3; M7, MSC-LPS-treated group on day 7; P, control, PBS group. The P values were determined using the unpaired Student’s t-test. ***P < 0.001.
Fig. 6
Fig. 6. MSCs modulate inflammatory responses by enhancing integrin signaling and suppressing NET release and DVT in vivo.
a–c Differential gene expression of β2-integrin (ITGB2) and the integrin activators talin-1 (TLN1) and kindlin-3 (FERMT3) in different leukocyte subpopulations of PBMCs isolated from control- or MSC-treated COVID-19 patients (MSC-D4). d DVT was induced by partially ligating IVC (IVC stenosis) in two groups of mice, one exogenously expressing EGFP and the other expressing EGFP-kindlin-3 (EGFP-K3) in bone-marrow cells with WT background. e Plasma NETs-DNA levels in mice (EGFP group and EGFP-K3 group) before and after IVC stenosis were measured using the Sytox Green assay. f, g Thrombi formed in the ligated IVC were collected from EGFP and EGFP-K3 mice. Weight (f) and length (g) were measured for each thrombus. h DVT was induced by IVC stenosis in MSC-treated mice and placebo-treated control mice. i Plasma NETs-DNA levels in control and MSC-treated mice before and after IVC stenosis were measured using the Sytox Green assay. j, k Thrombi that formed in the ligated IVC were collected from the control and MSC-treated mice. Weight (j) and length (k) were measured for each thrombus. Control, MSC-untreated controls. The data represent the means ± SD. The P values were determined using the unpaired Student’s t-test.
Fig. 7
Fig. 7. MSCs improve the prognosis of COVID-19 patients by modulating the immune esponse, promoting tissue repair, and suppressing NET release.
MSCs orchestrate immunomodulatory functions in two main ways to restore a harmonious homeostasis of the immune microenvironment and promoting immune system recovery in COVID-19 patients. On the one hand, the treatment of patients with MSCs (1) induced mobilization of COVID-19 patient-derived VNN2+ HSPC-like cells to the peripheral blood of patients via upregulation of CSF3R and PTPRE; (2) induced upregulation of chemotaxis-related genes (CCL5, CXCR2, CX3CR1, and L-selectin) in activated monocytes, NK cells, pDCs, and memory T cells; (3) supported the function of T cells (upregulation of CD28) through MAPK-ERK/JNK signaling; and (4) promoted the differentiation of CD4+ T cells into Th cells (upregulation of CD28, CD40L, IL12R, STAT4 and STAT6) to assist in B cell activation (upregulation of CD19 and CD81). On the other hand, MSCs also inhibit the overactivation of immune cells and their immune response in patients, characterized by promoted immunomodulatory functions of pDC, and increased TGF-β1 in various immune cells, upregulation of FOXP3 in Th cells. Concordantly, MSC treatment induced novel immune responses and facilitated IgM+IgD+ B cell activation to promote repair of damaged lung tissue. Finally, MSC treatment reduced the production of neutrophil extracellular traps (NETs) in COVID-19 patients by upregulating kindlin-3 expression in immune cells to reduce the risk of immunothrombosis. mT, memory T cells.

Comment in

References

    1. Wu Z, McGoogan JM. Characteristics of and Important Lessons From the Coronavirus Disease 2019 (COVID-19) Outbreak in China: summary of a Report of 72314 Cases From the Chinese Center for Disease Control and Prevention. JAMA. 2020;10:1001. - PubMed
    1. Huang C, et al. Clinical features of patients infected with 2019 novel coronavirus in Wuhan, China. Lancet. 2020;395:497–506. - PMC - PubMed
    1. Chakrabarti SS, et al. Of cross-immunity, herd immunity and country-specific plans: Experiences from COVID-19 in India. Aging Dis. 2020;11:1339–1344. - PMC - PubMed
    1. Barzilai N, et al. Geroscience in the Age of COVID-19. Aging Dis. 2020;11:725–729. - PMC - PubMed
    1. Moskalev A, Stambler I, Caruso C. Innate and adaptive immunity in aging and longevity: the foundation of resilience. Aging Dis. 2020;11:1363–1373. - PMC - PubMed

Publication types

MeSH terms